Multi Time Frame CCI Indicator
- Indikatoren
- Version: 1.0
- Aktivierungen: 5

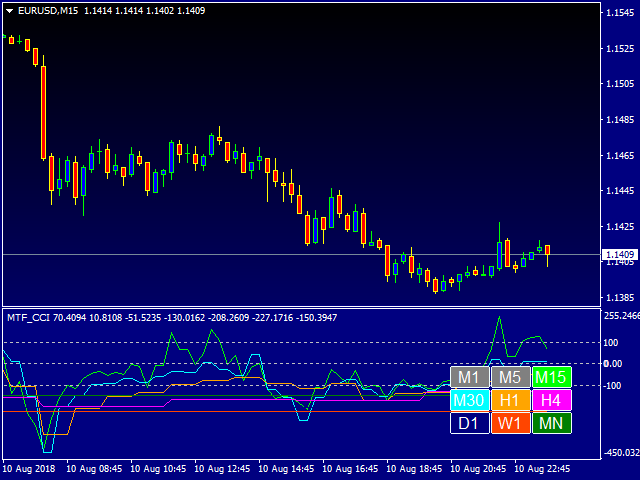
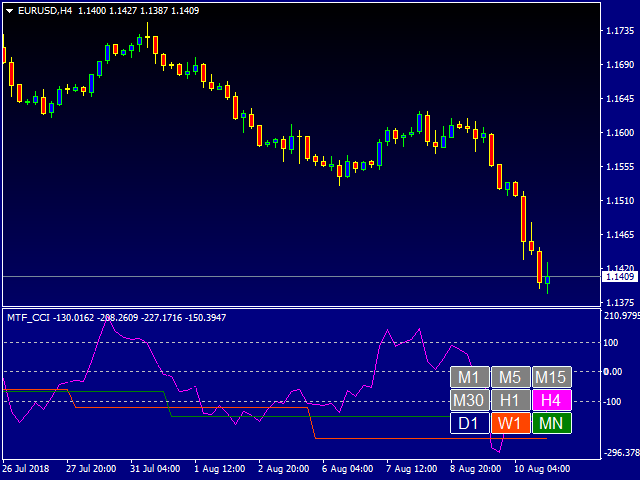
Dieser Indikator wurde entwickelt, um die CCI-Niveaus auf den aktuellen und älteren Zeitrahmen zu kontrollieren. Das Bedienfeld ist einfach zu verstehen und besteht aus Schaltflächen, mit denen die Anzeige der Linien gesteuert werden kann, die den auf den Namen der Schaltflächen angegebenen Linien entsprechen. Die Farbe der Schaltfläche stimmt mit der Farbe der Linie überein.
Dieser Indikator gehört zu einer Reihe von ähnlichen Indikatoren, die bereits sehr beliebt sind:
https://www.mql5.com/ru/market/product/30276 und https://www.mql5.com/ru/market/product/30403
Parameter
"Einstellungen des Hauptindikators" - Einstellungen des Hauptindikators;
- CCI Periode - Mittelungsperiode für die Indexberechnung (14 standardmäßig);
- CCI Preistyp - Preistyp (standardmäßig - Schlusskurs);
"___| Farbpalette " - Farbpalette ;
- Textfarbe - Textfarbe (standardmäßig Weiß);
- ColorM1 - Farbe der M1-Zeitrahmenlinie (standardmäßig DodgerBlue);
- FarbeM5 - Farbe der Linie des Zeitrahmens M5 (standardmäßig Rot);
- ColorM15 - Farbe der Linie des M15-Zeitrahmens (standardmäßig Limette);
- ColorM30 - Farbe der Linie des M30-Zeitrahmens (standardmäßig Aqua);
- ColorH1 - Farbe der Linie des H1-Zeitfensters (standardmäßig Orange);
- ColorH4 - Farbe der Linie des H4-Zeitfensters (standardmäßig Magenta);
- ColorD1 - Farbe der Linie des D1-Zeitfensters (standardmäßig Navy);
- ColorW1 - Farbe der Linie des Zeitrahmens W (standardmäßig Orange-Rot);
- ColorMN - Farbe der Linie des Zeitrahmens MN1 (standardmäßig Grün);
Es genügt, den Mittelungszeitraum für die Berechnung des Indexes einzugeben, und Sie können ihn für alle älteren Zeiträume beobachten und die von Ihnen benötigten Zeiträume auswählen.


Der Benutzer hat keinen Kommentar hinterlassen