Equidistant channel Window
- Indikatoren
- Version: 1.0
- Aktivierungen: 5

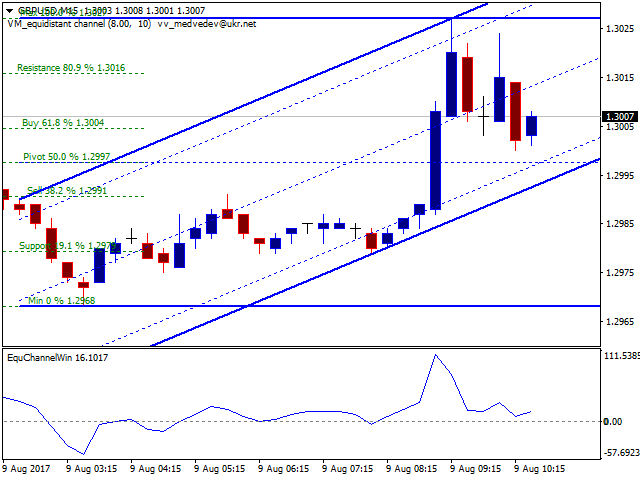
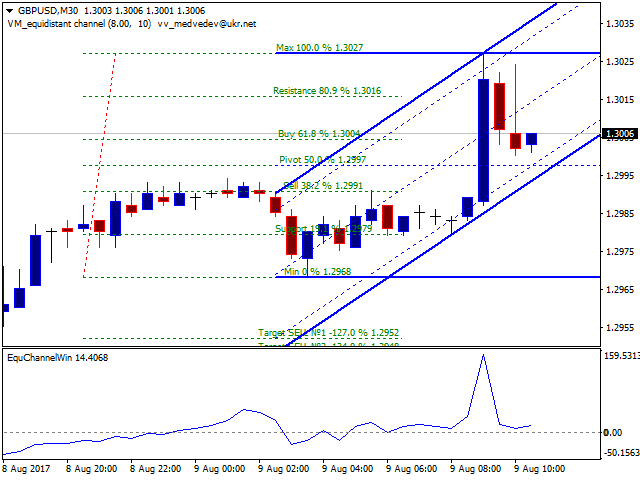
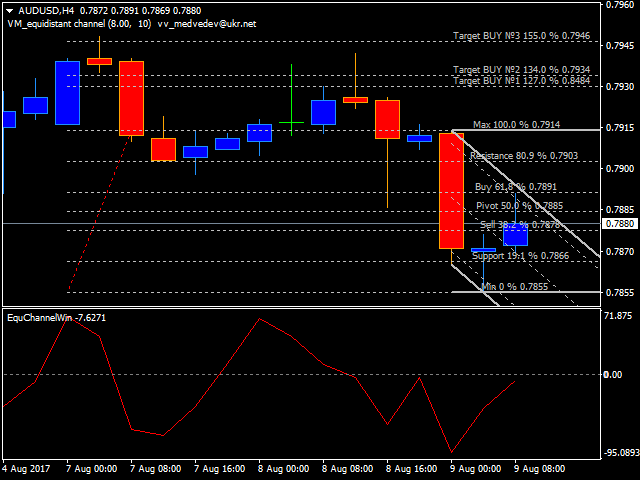
Dieser Indikator ist die logische Fortsetzung des bekannten Indikators für äquidistante Kanäle: https://www.mql5.com/en/market/product/8723. Der Hauptzweck des Indikators ist die Visualisierung der Kursniveaus in Bezug auf den parallelen Kanal unter Verwendung der Fibo-Bobokus-Niveaus in einem separaten Fenster und des Kursverlaufs. Dies ermöglicht oft eine Vorhersage der zukünftigen Preisbewegung mit einem ausreichend hohen Grad an Wahrscheinlichkeit. Die Gleichung zur Berechnung der Fibo-Levels lautet wie folgt:
FiboLevel = (50-(100*((Close[i]-CL)/delta_HLC)))*-1;
Close[i] - aktueller Balken Close Kursniveau;
CL - unteres Niveau des Kanals;
delta_HLC - Differenz zwischen oberem und unterem Kanalniveau.
Parameter
- Berechnungszeitraum des Indikators in Stunden - Berechnungszeitraum des Indikators in Stunden;
- Signalbereich % der Kanalbreite - Signalpegel in % der Kanalbreite. Der Signalpegel ist eine gestrichelte Linie, die parallel zur Hauptlinie mit den angegebenen Proportionen gezeichnet wird;
- Farbspektrum - Satz von Farben für die Darstellung der Kanäle;
- Farbe RES_SUP - Farbe des Parallelkanals;
- Farbe CHANNEL - Farbe des Hauptkanals;
- Linienstärke - Linienstärke des Kanals;
- width1 - Linienbreite des Parallelkanals;
- Breite2 - Linienbreite des Hauptkanals;
- Fibo-Ebenen im Kanal - Aktivieren/Deaktivieren der Fibo-Bobokus-Ebenen;
- Shift to the left of the display of the fibo levels - Verschiebung nach links für die Anzeige von Fibo Bobokus Levels;
- color_fibo - Farbe der Fibo-Bobokus-Levels.


Der Benutzer hat keinen Kommentar hinterlassen