Equidistant channel
- Indikatoren
- Version: 1.4
- Aktualisiert: 14 Juli 2017
- Aktivierungen: 5

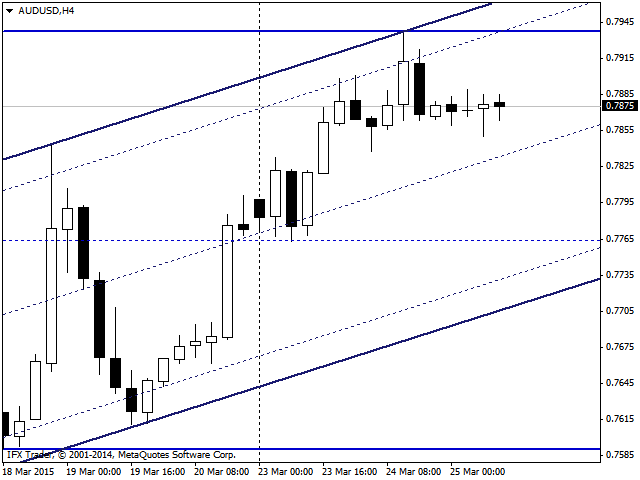
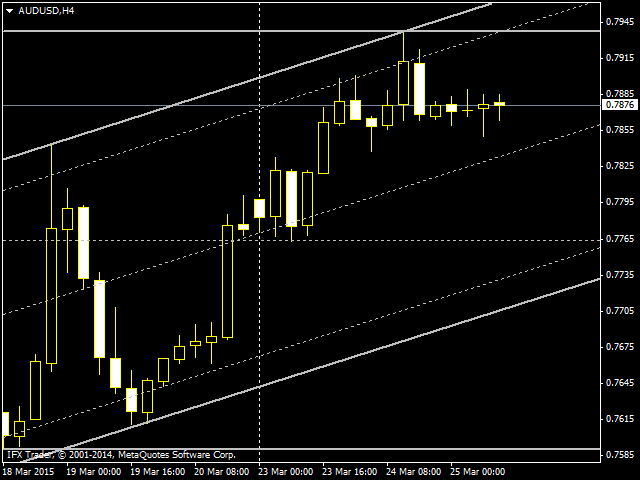
Der Zweck des Indikators ist das Zeichnen eines äquidistanten Kanals. Er unterscheidet sich etwas von dem traditionellen Modell. Die Wahl der Kontrollparameter ist einfach und bedarf keiner besonderen Beschreibung. Geben Sie das Berechnungsintervall in Stunden ein, und die Lösung des Problems wird auf dem Bildschirm angezeigt.
Bitte beachten Sie, dass die Zeit, die für die Berechnung des Kanals benötigt wird, größer sein muss als die Zeitspanne, für die sie angezeigt wird. Wenn die von Ihnen eingegebenen Parameter außerhalb der zulässigen Grenzen liegen, werden Sie benachrichtigt, wenn der Indikator Einschränkungen aufweist.
Die Dicke und Farbe der Linien sind einstellbar.
Parameter
- CycleHours - Zeitraum in Stunden;
- SensitivitySignalAlerts - Signalpegel in % der Kanalbreite. Der Signalpegel ist eine gestrichelte Linie, die parallel zur Hauptlinie mit den angegebenen Proportionen gezeichnet wird;
- color RES_SUP - die Farbe des Parallelkanals;
- Farbe CHANNEL - die Farbe des Hauptkanals;
- width1 - Dicke der Linien des parallelen Kanals;
- Breite2 - Dicke der Linien des Hauptkanals.


Der Benutzer hat keinen Kommentar hinterlassen