ZigZag on average for MQL5
- Indikatoren
- Version: 1.3
- Aktualisiert: 14 Juni 2021
- Aktivierungen: 10

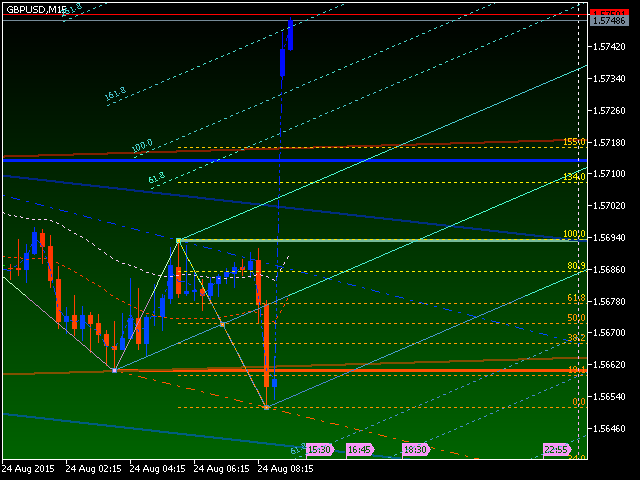
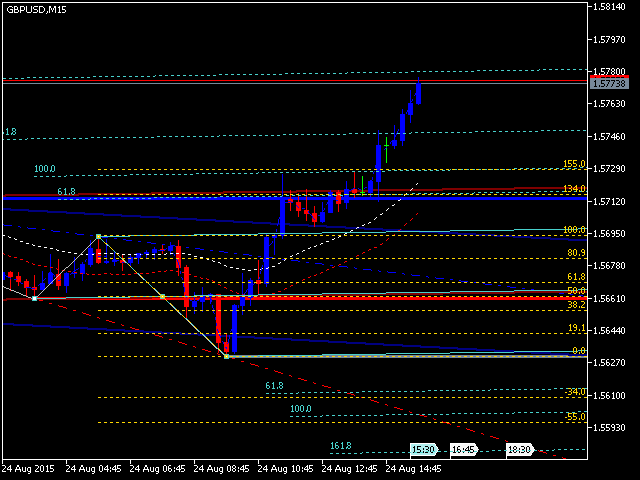
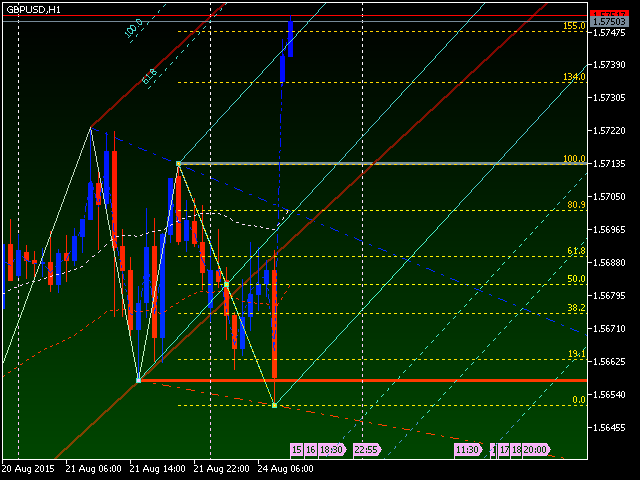
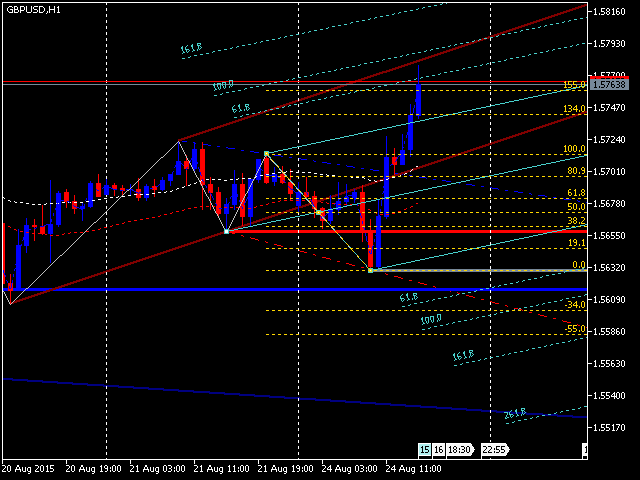
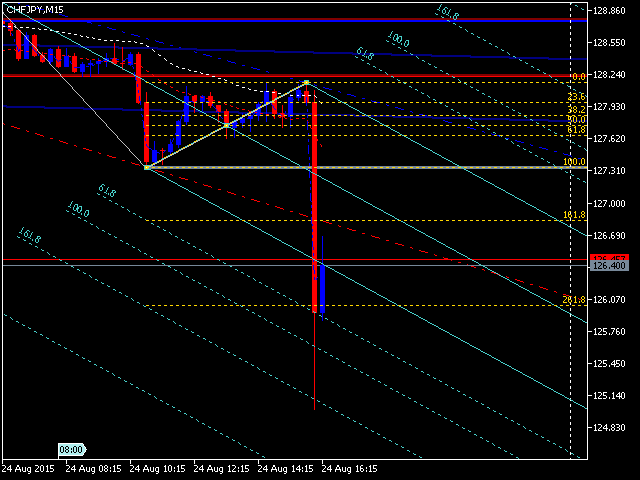
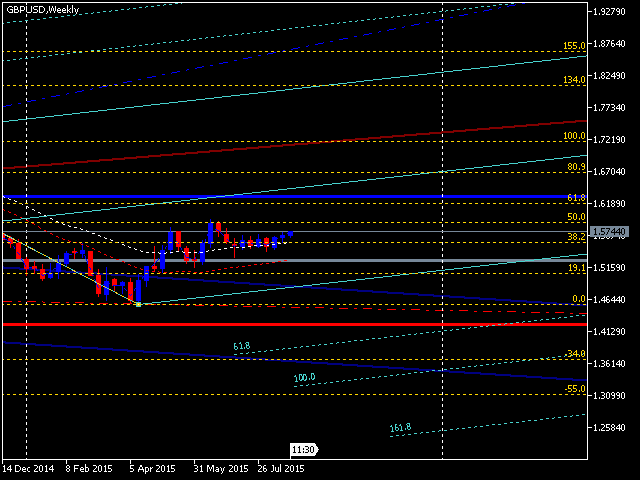
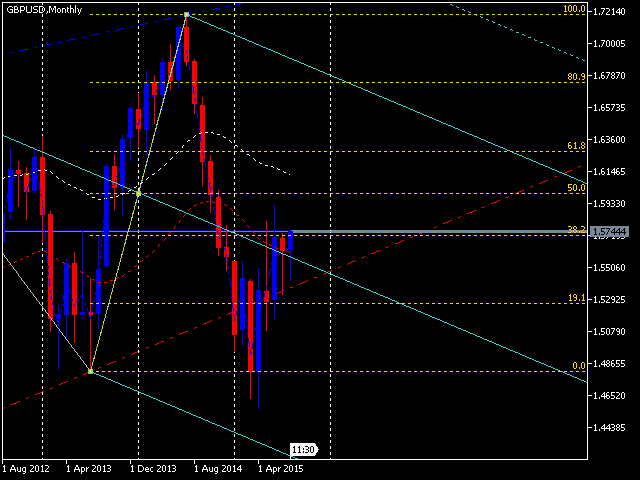
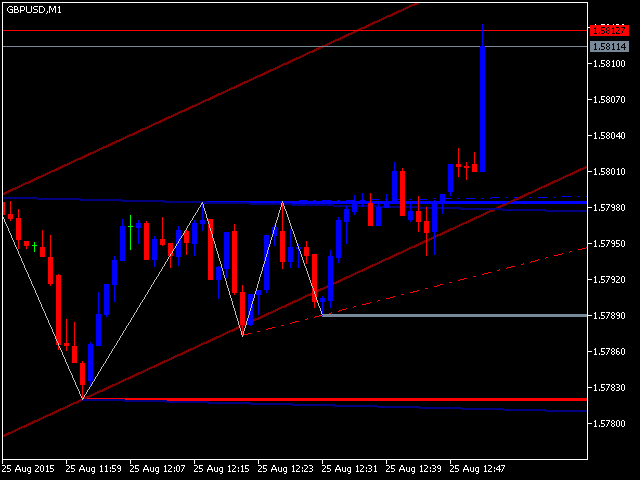
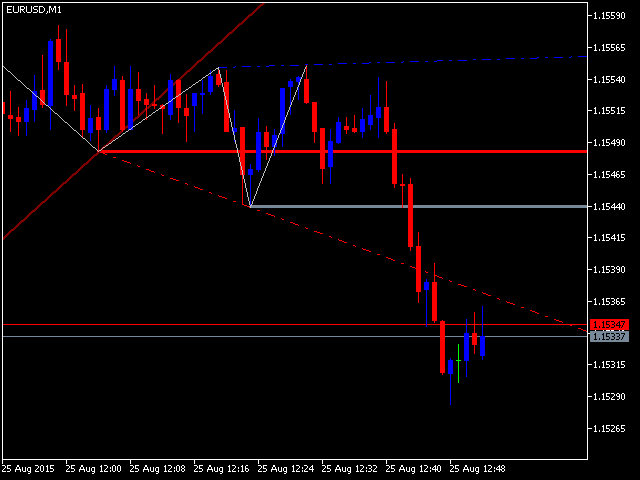
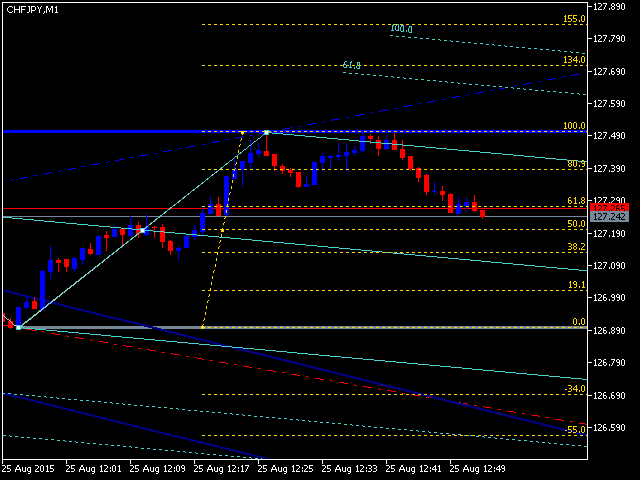
Dies ist ein bekannter ZigZag-Indikator. Er unterscheidet sich jedoch durch die Tatsache, dass seine Darstellung auf den Werten der Mittellinie basiert, die vom Benutzer festgelegt wird. Er kann Andrews' Pitchfork und Standard- oder Bobokus-Fibo-Levels anzeigen. KEIN REPAINTING.
Parameter
- Zeitraum МА - Zeitraum der Mittellinie. Standardwert ist 34. Der Minimalwert ist 4, der Maximalwert wird nach Ihrem Ermessen festgelegt.
- Zur Preisberechnung verwendet - Art des Preises, der für die Berechnung der Mittellinie verwendet wird.
- Mittelungsmethode - Art der Glättung für die Mittellinie.
- Drehen der Pitchfork - Aktivieren (true) oder Deaktivieren (false) der Andrews' Pitchfork.
- PitchColor - Farbe der Andrews' Pitchfork.
- Fibo-Ebenen einbeziehen - Fibo-Ebenen aktivieren (true) oder deaktivieren (false).
- Installation von Fibo-Bobokus-Levels - Bobokus-Fibo-Levels (true) oder Standard-Fibo-Levels (false) verwenden.
- Abstand zum Drehen der Fib-Levels Bobokus - Abstand in Punkten zwischen den Punkten der letzten Bewegung zur Visualisierung der Bobokus-Fibo-Levels.
- Farbe Fibonacci-Zone - Farbe der Bobokus-Fibo-Levels.
- Schalter (AUS) Anzeige der Unterstützungs- und Widerstandsniveaus - Anzeige (Ausblenden) der Unterstützungs- und Widerstandsniveaus.
- Kanäle für Unterstützung und Widerstand anzeigen (ausschalten ) - Kanäle für Unterstützung und Widerstand anzeigen (ausblenden).
Passen Sie hier das Farbschema und die Breite der Linien an. Bitte beachten Sie die folgenden Konstruktionsbesonderheiten von Unterstützungs- und Widerstandslinien. Sie erscheinen nur dort, wo sich die Trendrichtung ändert und sind daher eine gute Hilfe bei der Erkennung von Einstiegs- und Ausstiegspunkten. Beachten Sie auch die "Spuren" früherer Kanäle, die als kurze Trendlinien auf den Zickzack-Spitzen (-Untergründen) erscheinen. Dieser Indikator gibt Ihnen mehr Sicherheit bei Ihren Handelsentscheidungen.


Der Benutzer hat keinen Kommentar hinterlassen