ZigZag on average
- Indikatoren
- Version: 2.5
- Aktualisiert: 15 August 2021
- Aktivierungen: 5

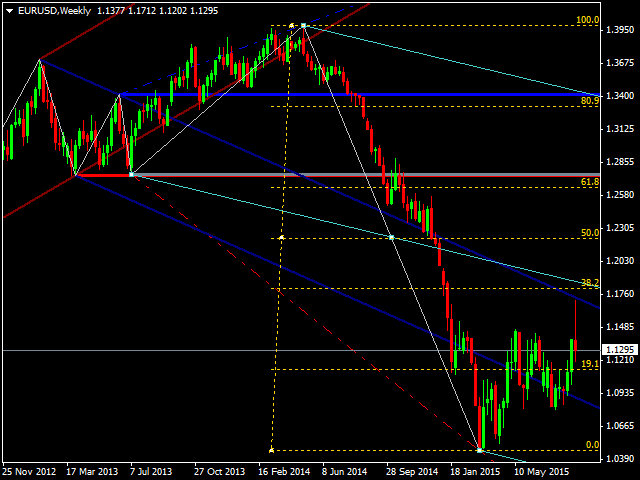
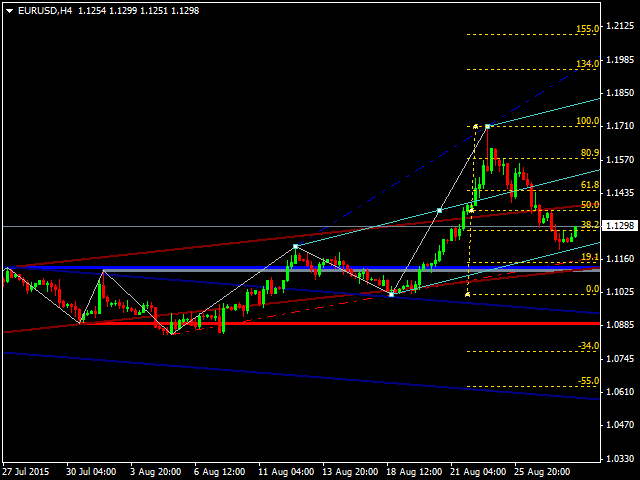
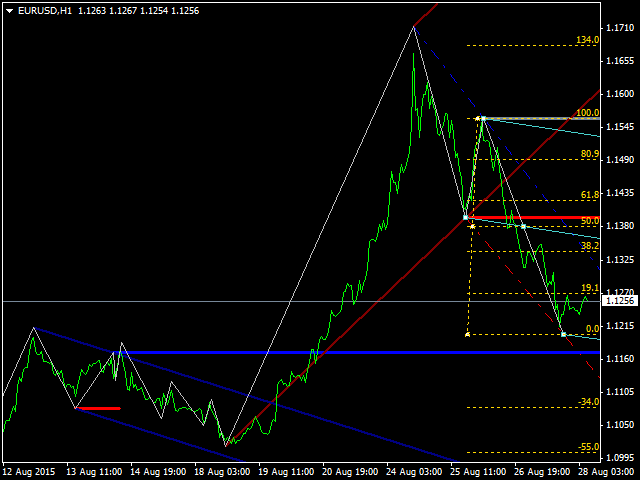
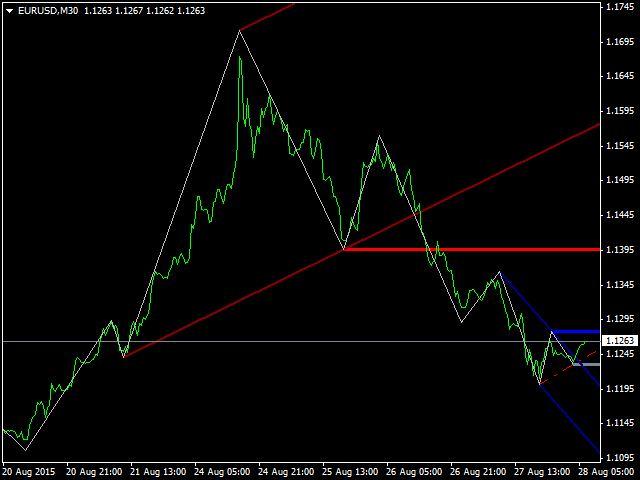
Dies ist ein bekannter ZigZag-Indikator. Er unterscheidet sich jedoch durch die Tatsache, dass seine Darstellung auf den Werten der Mittellinie basiert, die vom Benutzer festgelegt wird.
Er kann Andrews' Pitchfork und Standard- oder Bobokus-Fibo-Levels anzeigen. KEIN REPAINTING.
Parameter
- Zeitraum МА - Zeitraum der Mittellinie. Standardwert ist 34. Der Mindestwert ist 4. Der Maximalwert wird nach Ihrem Ermessen festgelegt.
- Preisberechnung - Basispreis für die Berechnung der Mittellinie.
- Die Mittelungsmethode - Methode zur Glättung der mittleren Linie.
- Drehen der Pitchfork - Aktivieren (true) oder Deaktivieren (false) der Andrews' Pitchfork.
- PitchColor - Andrews' Pitchfork Farbe.
- Fibo-Ebenen einbeziehen - Fibo-Ebenen aktivieren (true) oder deaktivieren (false).
- Installation von Fibo-Bobokus-Levels - aktivieren Sie Bobokus-Fibo-Levels (true) oder aktivieren Sie Standard-Fibo-Levels (false).
- Abstand, um Fib-Levels Bobokus zu drehen - Abstand in Punkten zwischen den Punkten der letzten Bewegung, um Bobokus Fibo-Levels zu visualisieren.
- Farbe Fibonacci-Zone - Farbe der Bobokus-Fibo-Levels.
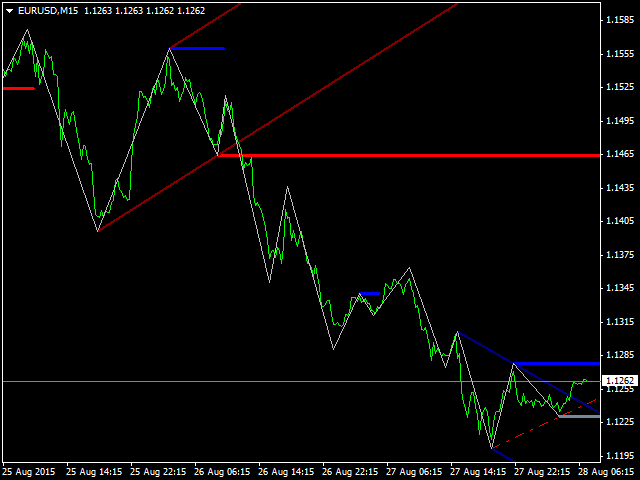
- Schalter (OFF) Anzeige von Unterstützungs- und Widerstandsniveaus - Aktivieren (Deaktivieren) von Unterstützungs- und Widerstandslinien.
- Schalter (AUS) Anzeige der Unterstützungs- und Widerstandskanäle - Aktivieren (Deaktivieren) der Unterstützungs- und Widerstandskanäle.
Sie können hier auch das Farbschema und die Linienbreite einstellen. Ich möchte auf eine Besonderheit bei der Darstellung von Kanälen und Linien der Unterstützung und des Widerstands hinweisen.
Sie erscheinen nur dort, wo der Trend seine Richtung ändert, und können daher bei der Suche nach Einstiegs- und Ausstiegspunkten sehr nützlich sein.
Achten Sie auf die "Spuren" früherer Kanäle, die als kurze Trendlinien auf den Oberseiten (Unterseiten) des Zickzacks angezeigt werden. Dieser Indikator wird Ihnen bei der Ausführung von Geschäften Sicherheit geben.


Der Benutzer hat keinen Kommentar hinterlassen