Channel Range Medvedev
- Indikatoren
- Version: 1.6
- Aktualisiert: 24 März 2020
- Aktivierungen: 5

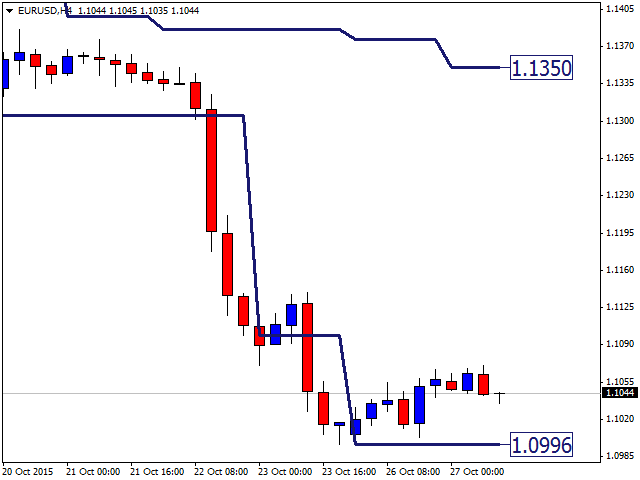
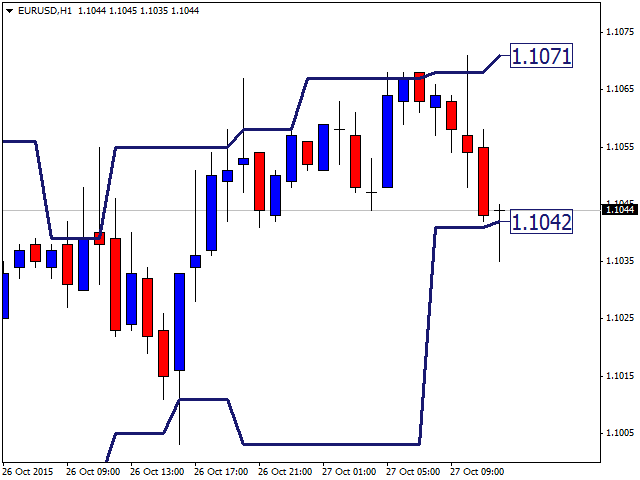
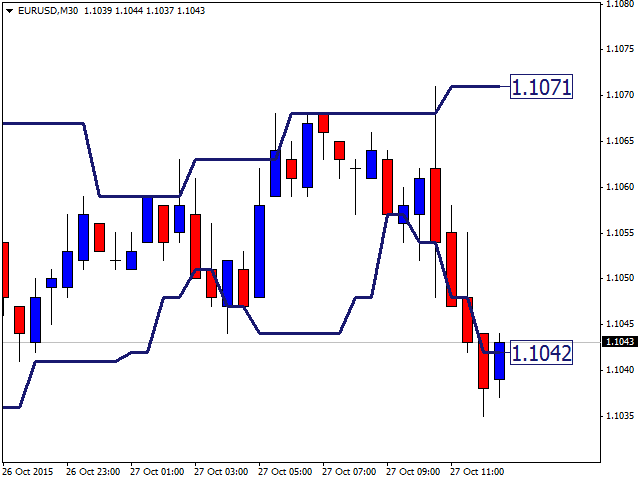
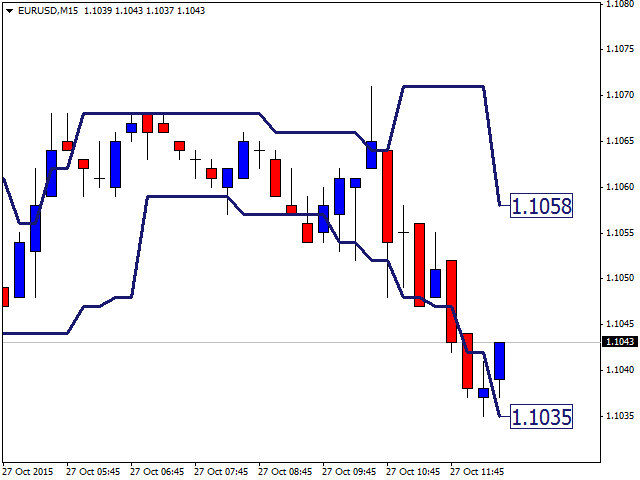
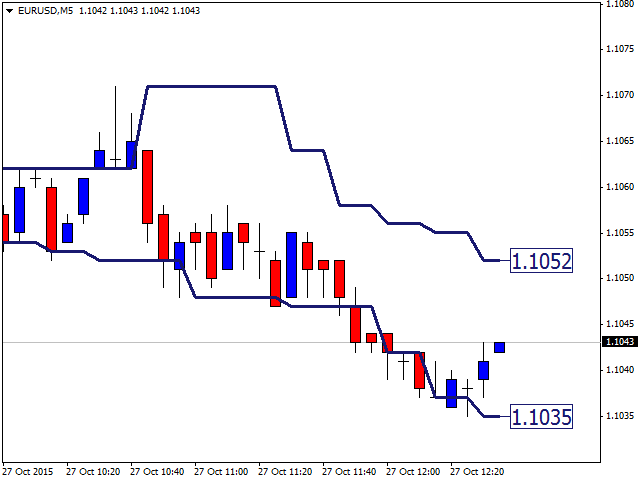
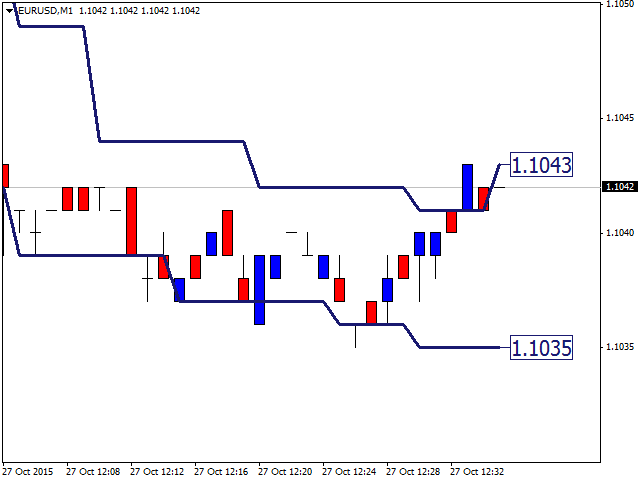
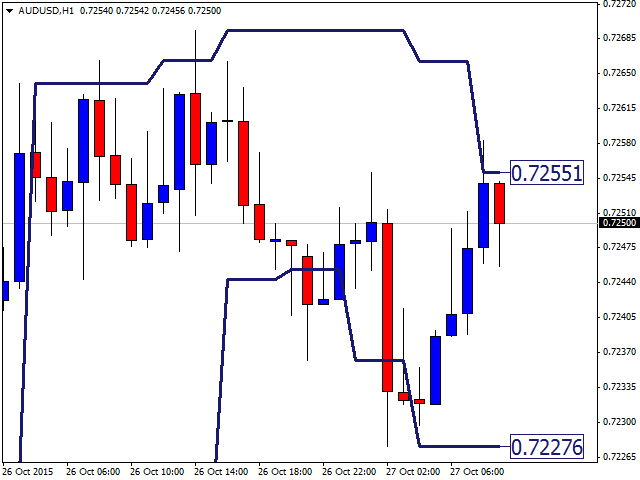
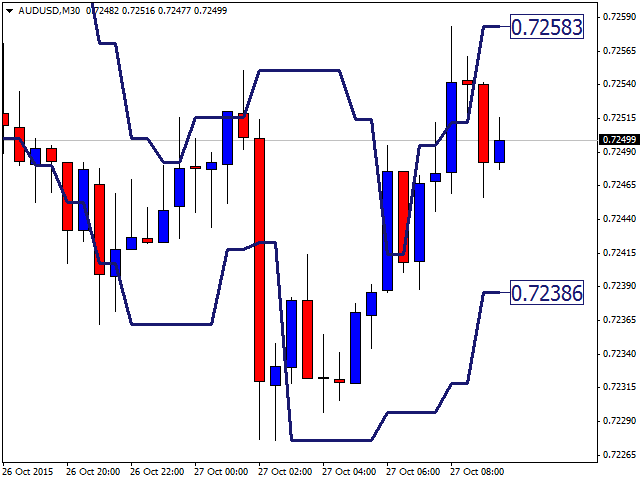
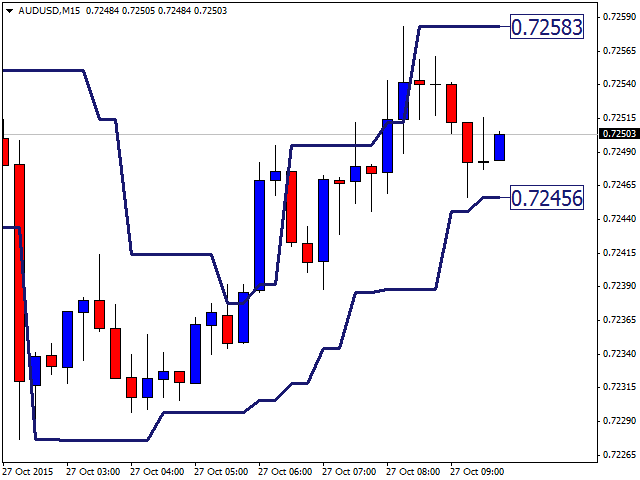
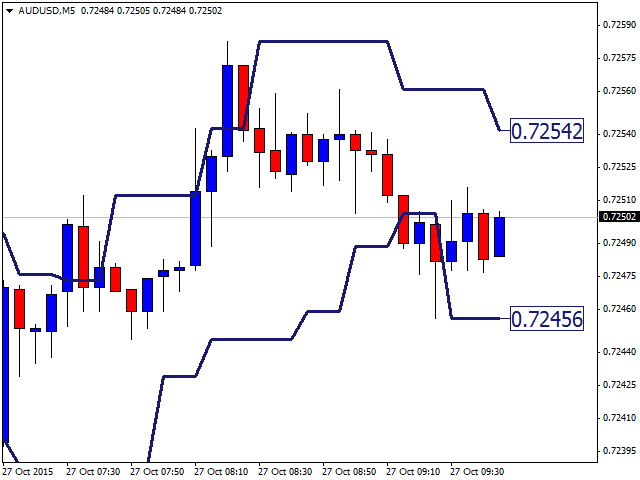
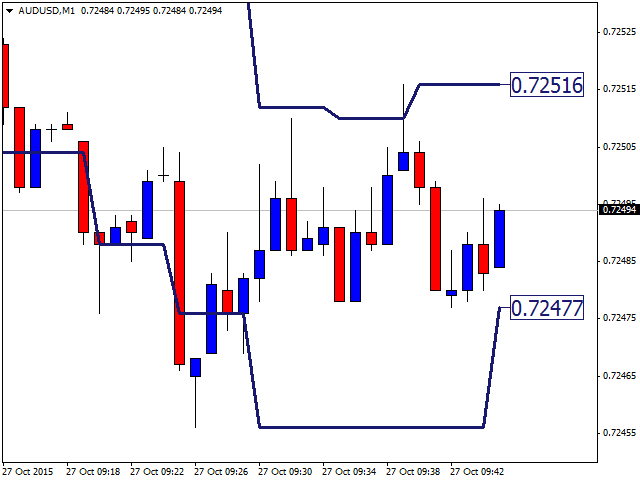
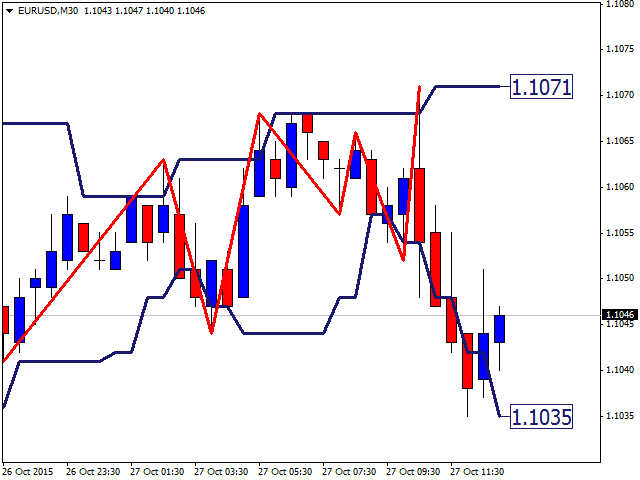
Die Idee des Indikators ergibt sich aus der Notwendigkeit, die Grenzen von Unterstützungs- und Widerstandsniveaus klar zu definieren, was dazu beiträgt, die Eröffnung und Schließung von Positionen in den Bereichen zu planen, die den Prozess am besten bestimmen. Achten Sie auf die Durchbrüche des Widerstandsniveaus, die die Absicht des Kurses bestätigen, die Aufwärtsbewegung fortzusetzen, nachdem er das Unterstützungsniveau überschritten hat und in den von den beiden Niveaus gebildeten Kanal eingetreten ist. Das Gleiche gilt für den Fall, dass der Kurs in den Kanal nach unten eintritt und dann auf das Unterstützungsniveau trifft und in die nächste Phase der Kursbewegung übergeht. Dieser Indikator eignet sich hervorragend für den kombinierten Einsatz mit einem Zickzackkurs, wie diesem hier: https://www.mql5.com/en/market/product/12330. Alles, was Sie tun müssen, ist, die Anzeige des Indikators zu konfigurieren, wenn Sie ihn auf dem gewünschten Zeitrahmen ausführen.
Parameter des Indikators
- color_channel - die Farbe der Unterstützungs- und Widerstandsebenen;
- with_channel - die Linienbreite, kann einen Wert von 1 bis 5 annehmen, Standard ist 2.
Konstruktive Vorschläge und Feedback sind sehr willkommen.