Seven equally spaced channels
- Indikatoren
- Version: 1.2
- Aktualisiert: 22 Januar 2018
- Aktivierungen: 5

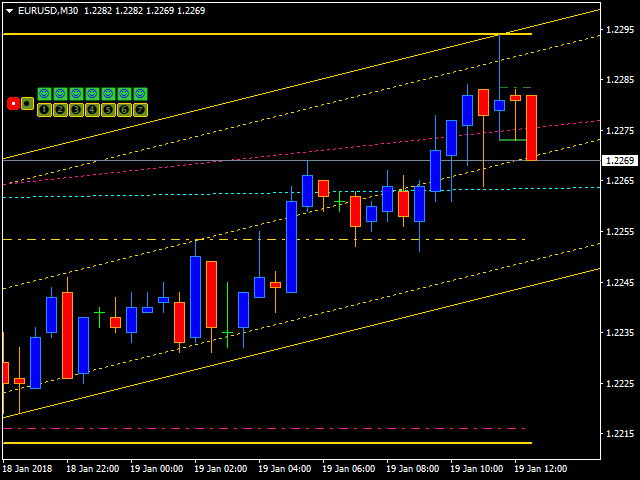
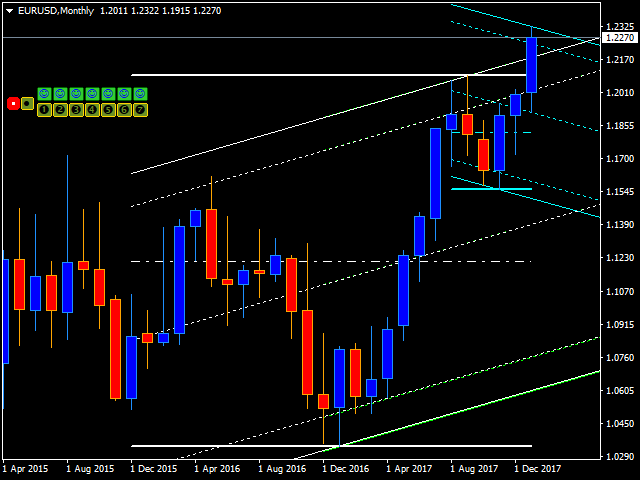
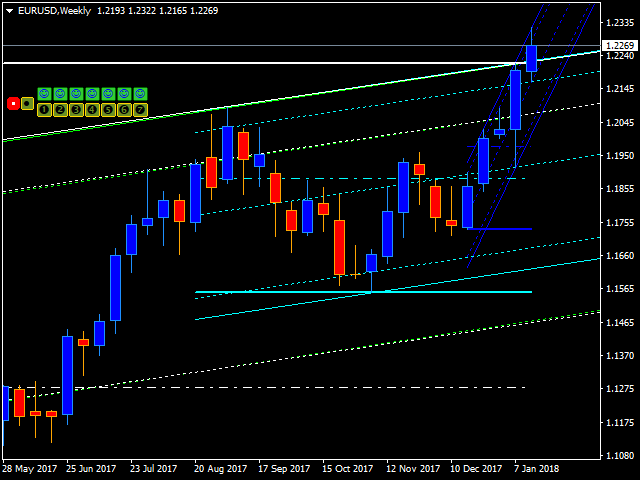
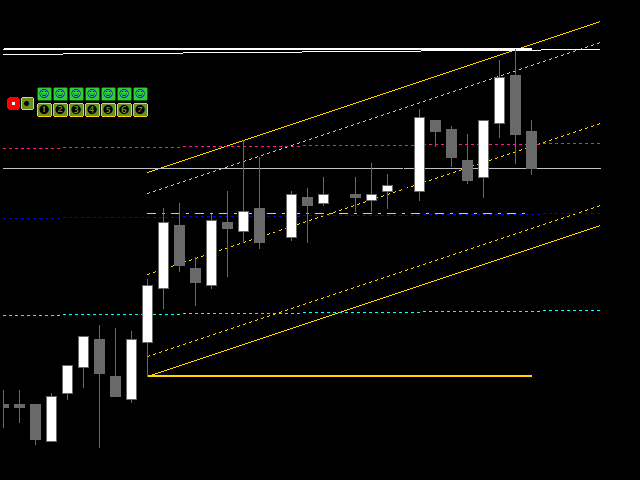
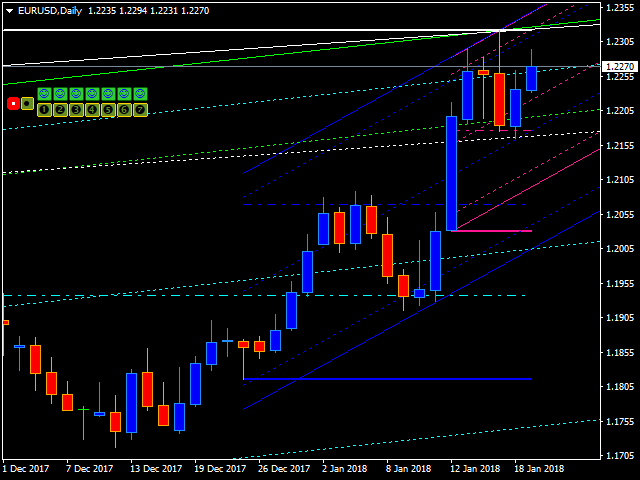
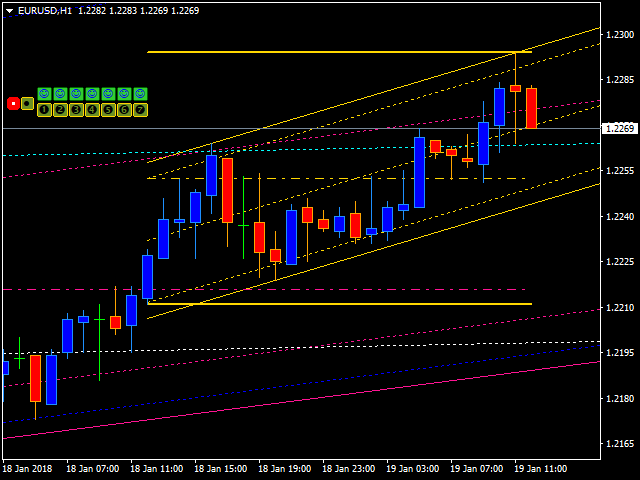
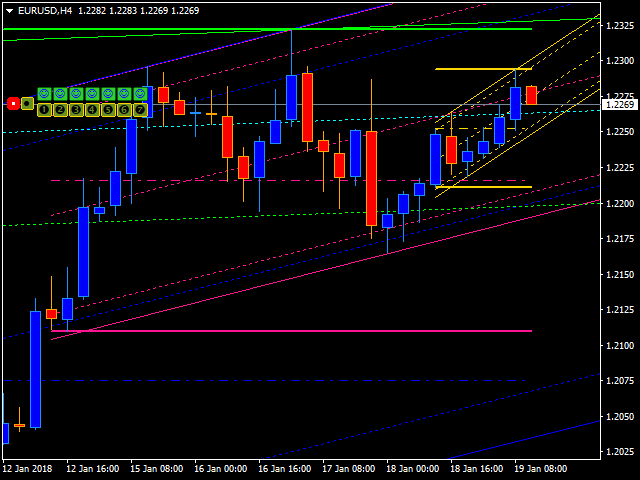
Dies ist ein interaktiver und leicht einzustellender Indikator, der es ermöglicht, sieben gleichmäßig verteilte Kanäle zu bilden, die gleichzeitig Ihre Einstellungen haben. Alle sieben Kanäle sind standardmäßig aktiviert. Sie können aber leicht den einen oder anderen Kanal aktivieren, indem Sie die Schaltflächen im oberen Teil des Kontrollfeldes des Indikators verwenden.
Sie können eine Periode der Indikatorberechnung ändern, indem Sie auf eine der Schaltflächen klicken, die die Nummer des Kanals im unteren Bereich des Bedienfeldes angeben. Mit zwei weiteren Schaltflächen (eine davon ist rot) können Sie das Bedienfeld an die gewünschte Stelle verschieben und bei Bedarf ausblenden. Halten Sie die linke Maustaste gedrückt und verschieben Sie das Bedienfeld an die gewünschte Stelle. Sie können den größten Teil des Bedienfelds ausblenden, indem Sie auf die andere Taste drücken. Beim zweiten Drücken wird das Bedienfeld wieder sichtbar.
Jeder Kanal hat folgende Einstellungen.
Parameter
- Aktivieren (deaktivieren) des Kanals №_ - aktivieren/deaktivieren des Kanals #_;
- Periode in Stunden Kanal №_ - Berechnungsperiode des Kanals #_ in Stunden (kann gebrochen sein, z.B.: 10.5);
- Farbe Kanal №_ - Farbe des Kanals #_;
- Linienstärke des Kanals №_ - Linienstärke des Kanals #_;
- Fortsetzung der Linien des Kanals №_ - das Flag für die Strahleneigenschaft setzen. (standardmäßig deaktiviert)
- ...
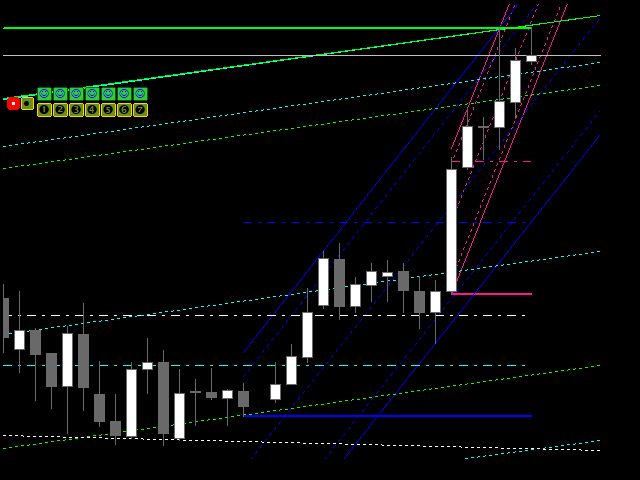
- Signalbereich % der Kanalbreite - aktivieren/deaktivieren Sie die Strahlen der Kanalsignalpegel in % der Kanalbreite (Standardwert ist 10%);
- Tagging aktivieren (deaktivieren) - Aktivieren/Deaktivieren von Kanalzeilen-Tags (Standardwert - deaktiviert);
- Tag-Breite - Tag-Breite (Standardwert ist 1).
- Aktivieren (Deaktivieren) des Zeichnens horizontaler Kanäle - Aktivieren (Deaktivieren) des Zeichnens horizontaler Kanäle. Standardmäßig aktiviert.
Das Ändern der Farben des Bedienfelds ist nicht kompliziert, ebenso wie das Ändern aller anderen Bedienelemente des Instruments.
Die Einstellungen des unmittelbaren Bedienfelds sind nur für den aktuellen Zeitraum gültig. Speichern Sie Ihre bevorzugten Parameter in den Eingängen des Instruments. Der Indikator basiert auf dem Algorithmus des äquidistanten Kanals: https://www.mql5.com/en/market/product/8723.


Der Benutzer hat keinen Kommentar hinterlassen