Multi Time Frame CCI Indicator
- Indicadores
- Versión: 1.0
- Activaciones: 5

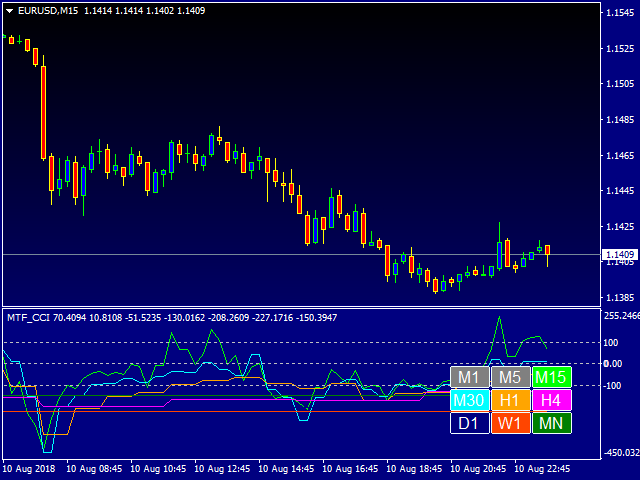
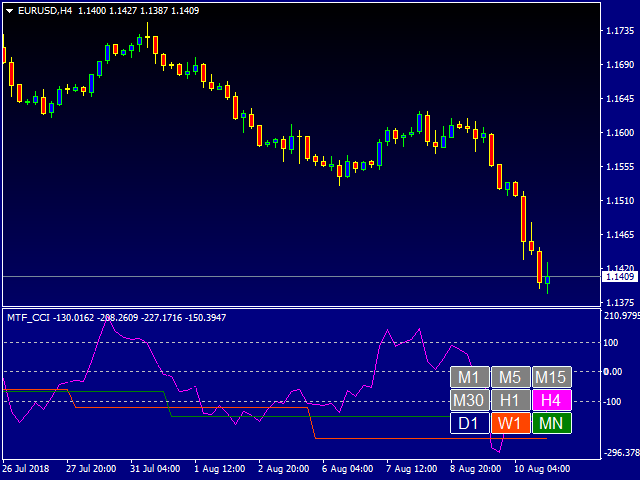
Este indicador está diseñado para controlar los niveles de CCI en los plazos actuales y en plazos anteriores. El panel de control es fácil de entender y consta de botones, con los que se puede controlar la visualización de las líneas correspondientes a las indicadas en el nombre de los botones. El color del botón coincide con el color de la línea.
Este indicador pertenece a una serie de indicadores similares que ya han ganado popularidad:
https://www.mql5.com/ru/market/product/30276 y https://www.mql5.com/ru/market/product/30403
Parámetros
" - Parámetros del indicador principal;
- Periodo CCI - Periodo promedio para el cálculo del índice (14 por defecto);
- CCI Price type - Tipo de precio (por defecto - precio de cierre);
" - Paleta de colores ;
- Color deltexto - Color del texto (Blanco por defecto);
- ColorM1 - color de la línea del marco temporal M1 (por defecto DodgerBlue);
- ColorM5 - color de la línea del timeframe M5 (Rojo por defecto);
- ColorM15 - color de la línea del timeframe M15 (Lima por defecto);
- ColorM30 - color de la línea del marco temporal M30 (Aqua por defecto);
- ColorH1 - color de la línea del marco temporal H1 (Naranja por defecto);
- ColorH4 - color de la línea del marco temporal H4 (Magenta por defecto);
- ColorD1 - color de la línea del marco temporal D1 (Azul marino por defecto);
- ColorW1 - color de la línea del timeframe W (NaranjaRojo por defecto);
- ColorMN - color de la línea del timeframe MN1 (Verde por defecto);
Basta con introducir el periodo de promediación para calcular el índice, y podrá observarlo en todos los periodos superiores, así como elegir los que necesite.


El usuario no ha dejado ningún comentario para su valoración