CCFpExt
- Indikatoren
-
Stanislav Korotky
 Trading is just my hobby. I'm working in IT industry. So developement of experts, indicators, and script is not a problem at all to me. Wide range of technologies are used: MQL4, MQL5, system and applied programming, web-services, neural networks and more.
New: - Version: 1.3
- Aktualisiert: 26 Juni 2023
- Aktivierungen: 5
CCFpExt ist eine erweiterte Version des klassischen Cluster-Indikators - CCFp.
Hauptmerkmale
- Beliebige Gruppen von Tickern oder Währungen werden unterstützt: Forex, CFDs, Futures, Spot, Indizes;
- Zeitliche Angleichung der Balken für verschiedene Symbole mit angemessener Behandlung von möglicherweise fehlenden Balken, einschließlich Fällen, in denen Ticker unterschiedliche Handelszeiten haben;
- Verwendung von bis zu 30 Instrumenten für die Marktberechnung (nur die ersten 8 werden angezeigt).
Parameter
- Instrumente - durch Komma getrennte Liste von Instrumenten mit einer gemeinsamen Währung; für Forex-Symbole ist die gemeinsame Währung entweder eine Kurswährung oder eine Basiswährung, die in allen gegebenen Symbolen erkannt wird; für jeden anderen Ticker wird sie von seiner Gewinnwährungseigenschaft genommen; wenn die automatische Erkennung fehlgeschlagen ist, wird der Parameter DefaultBase verwendet (hier bedeutet 'base' eine gemeinsame Währung für alle Ticker, nicht die Basiswährung eines Forex-Symbols); der Standardsatz von Instrumenten umfasst alle Forex-Majors EURUSD,GBPUSD,USDCHF,USDJPY,AUDUSD,USDCAD,NZDUSD; bitte beachten Sie, dass NZDUSD aus irgendeinem Grund auf dem MetaQuotes-Demo-Server fehlt, vergessen Sie also nicht, ihn entsprechend zu bearbeiten;
- MA_Methode - Methode des gleitenden Durchschnitts, die Voreinstellung ist linear gewichtet;
- Preis - Typ des auf den gleitenden Durchschnitt angewendeten Preises, der Standardwert ist der typische Preis;
- Fast - Periode des schnellen gleitenden Durchschnitts, der Standardwert ist 1;
- Slow - Zeitraum des langsamen gleitenden Durchschnitts, Standardwert ist 2;
- All_Bars - Anzahl der zu berechnenden Balken, der Standardwert 0 bedeutet alle verfügbaren Balken;
- BarByBar - false bedeutet, dass der 0-te Balken bei jedem Tick neu berechnet wird, true (Voreinstellung) bedeutet, dass der Balken nur einmal berechnet wird (beim 1. Tick und beim Schließen);
- DefaultBase - Standardwährung, die verwendet werden soll; sie wird nur verwendet, wenn die Basis nicht automatisch erkannt werden kann.
Beschreibung
Achten Sie beim Ausfüllen von Instruments darauf, dass Sie vorhandene Symbole eingeben. Wenn der Parameter Instrumente ein Symbol enthält, das in Market Watch fehlt, versucht der Indikator, es automatisch für Sie hinzuzufügen. Wenn das Symbol falsch geschrieben oder auf Ihrem Server nicht verfügbar ist, tritt ein Fehler auf - Sie sehen dann die Meldung "Errors! Prüfen Sie das Protokoll" auf dem Chart. Alle Details zu Fehlern und Warnungen werden im Expertenprotokoll aufgezeichnet.
Wenn die Anzahl der Instrumente größer als 8 ist, nehmen alle Instrumente an den Berechnungen teil und wirken sich auf die Diagrammlinien aus, aber nur die ersten 8 werden angezeigt. Obwohl es möglich ist, mehr als 8 Linien zu haben, würde dies zu Schwierigkeiten bei der Wahrnehmung führen. Außerdem beeinflusst jedes weitere Instrument, das dem Cluster hinzugefügt wird, das Gesamtbild weniger.
Bitte haben Sie Geduld. Der Indikator berechnet eine Reihe von gleitenden Durchschnitten für jedes Symbol und für verschiedene Zeitrahmen. Wenn der Indikator zum ersten Mal auf einem Chart platziert wird, kann der Prozess eine Weile dauern, was normalerweise bedeutet, dass einige Daten noch heruntergeladen und berechnet werden. Alle notwendigen Aktualisierungen finden automatisch statt. Sie sollten nur eingreifen, wenn Sie die oben genannte Fehlermeldung im Chart sehen.
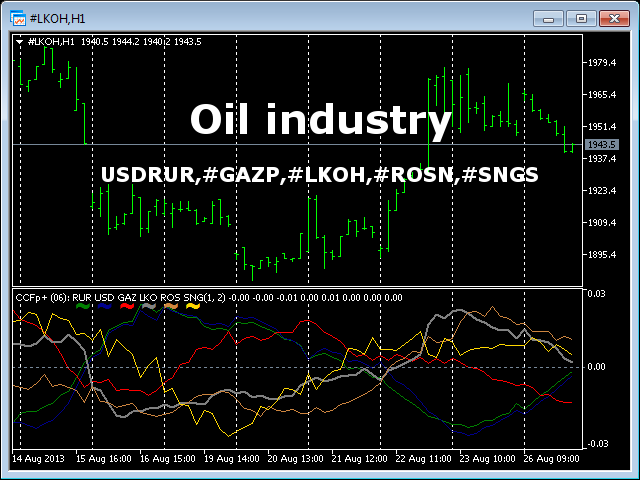
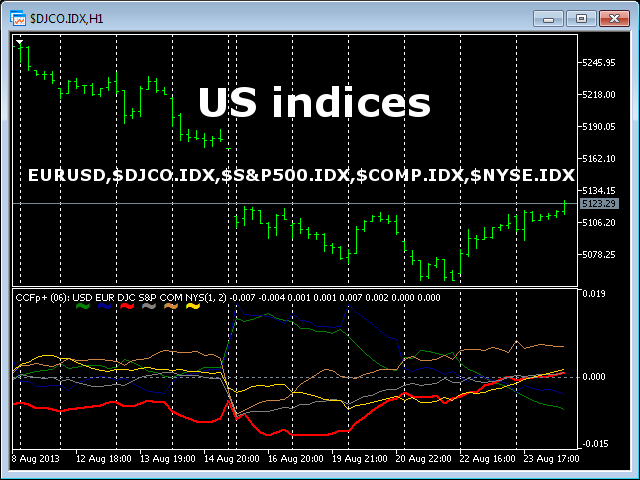
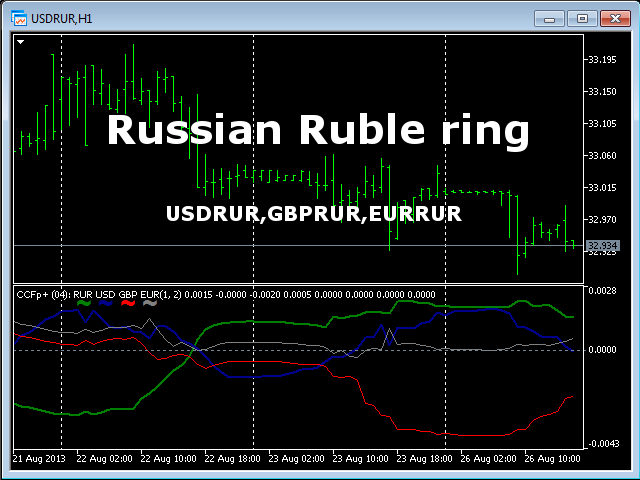
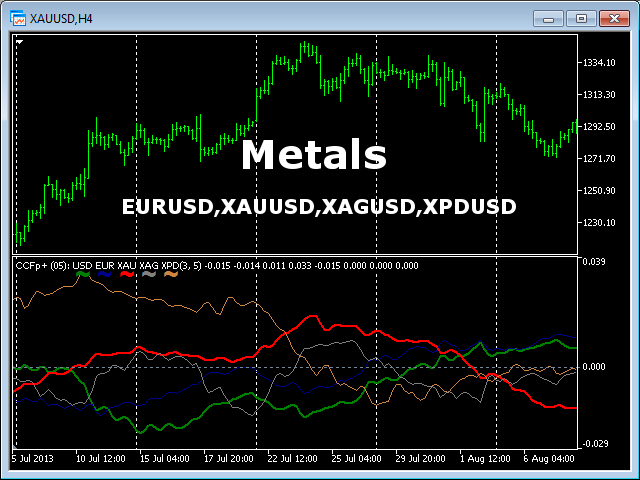
CCFpExt ermöglicht Ihnen die Analyse vieler interessanter Cluster, z.B. Russischer Rubelring (USDRUR, GBPRUR, EURRUR), Ölindustrie (#LKOH, #ROSN, #SGNS, #SIBN), Lebensmittel (Weizen, Mais, Soja), Indizes, etc. Einige Beispiele finden Sie in den Screenshots.