• Aperçu
  • Avis
  • Commentaires (6)
  • Nouveautés

CCFpExt

CCFpExt is an extended version of the classic cluster indicator - CCFp.


Main Features

  • Arbitrary groups of tickers or currencies are supported: can be Forex, CFDs, futures, spot, indices;
  • Time alignment of bars for different symbols with proper handling of possibly missing bars, including cases when tickers have different trading schedule;
  • Using up to 30 instruments for market calculation (only first 8 are displayed).

Parameters

  • Instruments - comma separated list of instruments with a common currency; for Forex symbols the common currency is either a quote currency or a base currency, which is detected in all given symbols; for any other ticker it's taken from its profit currency property; if the autodetection failed, DefaultBase parameter is used (here, 'base' means a common currency between all tickers, not a base currency of a Forex symbol); the default set of instruments includes all Forex majors EURUSD,GBPUSD,USDCHF,USDJPY,AUDUSD,USDCAD,NZDUSD; please note, that NZDUSD is missing at MetaQuotes-Demo server for some reason, so don't forget to edit as appropriate;
  • MA_Method - moving average method, the default is linear weighted;
  • Price - moving average applied price type, the default is typical price;
  • Fast - fast moving average period, the default is 1;
  • Slow - slow moving average period, the default is 2;
  • All_Bars - number of bars to calculate on, the default 0 means all available bars;
  • BarByBar - false means re-calculating 0-th bar on every tick, true (default) means calculating bar only once (on 1-st tick and when closed);
  • DefaultBase - default common currency to use; it's used only if the base can not be detected automatically.


Description

While filling in Instruments, please, make sure you enter existing symbols. If Instruments parameter contains a symbol missing in Market Watch, the indicator tries to add it automatically for you. If the symbol is misspelled or unavailable on your server, an error occurs - you'll see the message "Errors! Check the log" on the chart. All details about errors and warning are logged in the Experts log.

When number of Instruments is greater than 8, all of them participate in calculations and affect chart lines, but only first 8 are displayed. Though it's feasible to have more than 8 lines, it would produce difficulties with perception. Moreover, each next instrument added to the cluster affects the whole picture less.

Please, be patient. The indicator calculates a bunch of moving averages for every symbol, for different time frames. When it's placed on a chart first time, the process may take a while, usually this means some data has being still downloading and calculating. All necessary refreshes take place automatically. You should interfere only if you see the above mentioned error message in the chart.

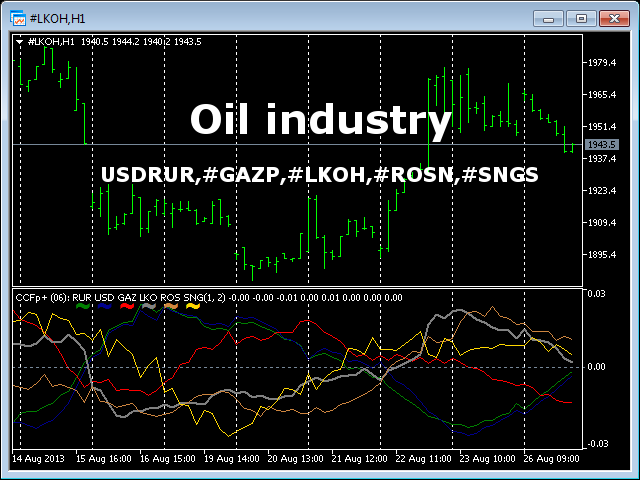
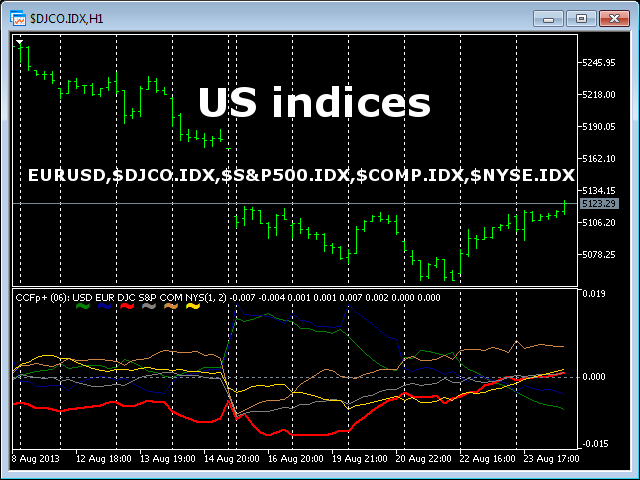
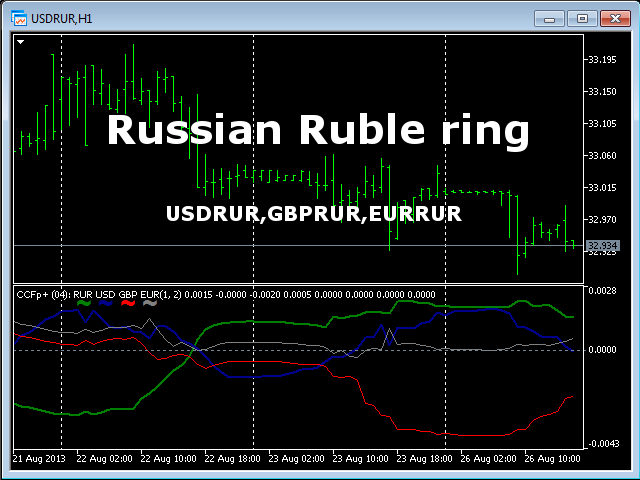
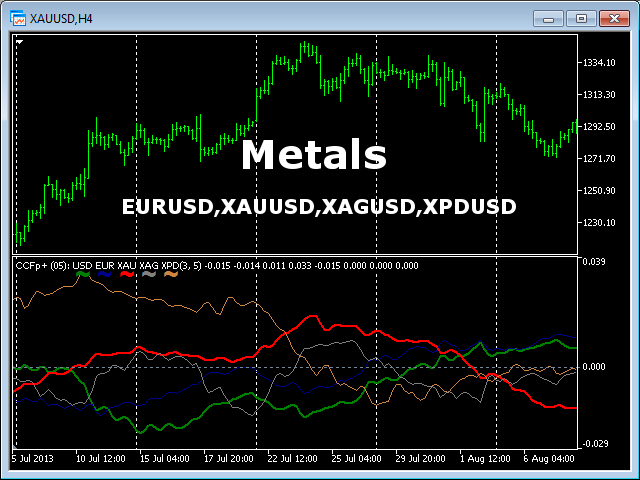
CCFpExt allows you analyzing many interesting clusters, for example, Russian ruble ring (USDRUR, GBPRUR, EURRUR), oil industry (#LKOH, #ROSN, #SGNS, #SIBN), foods (wheat, corn, soy), indices, etc. You may find some examples in screenshots.

Produits recommandés
Owl Smart Levels MT5
Sergey Ermolov
4.47 (36)
Version MT4   |  FAQ L' indicateur Owl Smart Levels est un système de trading complet au sein d'un seul indicateur qui comprend des outils d'analyse de marché populaires tels que les fractales avancées de Bill Williams , Valable ZigZag qui construit la structure d'onde correcte du marché et les niveaux de Fibonacci qui marquent les niveaux exacts d'entrée. sur le marché et les endroits où prendre des bénéfices. Description détaillée de la stratégie Mode d'emploi de l'indicateur Conseiller-Assis
Noize Absorption Index - is the manual trading system that measures the difference of pressure between bears forces and bulls forces. Green line - is a noize free index that showing curent situation. Zero value of index shows totally choppy/flat market.Values above zero level shows how powerfull bullish wave is and values below zero measures bearish forces.Up arrow appears on bearish market when it's ready to reverse, dn arrow appears on weak bullish market, as a result of reverse expectation.
HMA Trend Professional MT5
Pavel Zamoshnikov
4.4 (5)
Improved version of the free HMA Trend indicator (for MetaTrader 4) with statistical analysis. HMA Trend is a trend indicator based on the Hull Moving Average (HMA) with two periods. HMA with a slow period identifies the trend, while HMA with a fast period determines the short-term movements and signals in the trend direction. The main differences from the free version: Ability to predict the probability of a trend reversal using analysis of history data. Plotting statistical charts for analyz
Cet indicateur innovant de mesure de la force des devises de INFINITY est une aide indispensable pour les scalpers et les commerçants qui négocient à long terme. Le système d'analyse De la force/faiblesse des devises est connu depuis longtemps et utilisé sur le marché par les principaux traders du monde. Tout commerce d'arbitrage n'est pas complet sans cette analyse. Notre indicateur détermine facilement la force des devises sous-jacentes les unes par rapport aux autres. Il affiche des graphiqu
Le niveau Premium est un indicateur unique avec une précision de plus de 80 % des prédictions correctes ! Cet indicateur a été testé par les meilleurs Trading Specialists depuis plus de deux mois ! L'indicateur de l'auteur que vous ne trouverez nulle part ailleurs ! À partir des captures d'écran, vous pouvez constater par vous-même la précision de cet outil ! 1 est idéal pour le trading d'options binaires avec un délai d'expiration de 1 bougie. 2 fonctionne sur toutes les paires de de
Binary Options Assistant (BOA) Multi Currency Dashboard for Binary Options (MT5) . You can use any of the BOA Signals Indicators with the dashboard. Just change the BOA Signals Indicator Name in the dashboard settings to the indicator you want to get signals from. For example: CHILL. BLAZE:  BOA_BLAZE_Indicator_v1   Strategy :   BLW Online Trading Binary Options Strategy (3 Moving Average) LAVA:  BOA_LAVA_Indicator_v1   Strategy:   Lady Trader Binary Options Strategy (Bollinger Bands & Stoc
The Antique Trend Indicator is a revolutionary trend trading and filtering solution with all the important features of a trend tool built into one tool! The Antique Trend indicator is good for any trader, suitable for any trader both for Forex and binary options. There is no need to configure anything, everything has been perfected by time and experience, it works great during flats and trends. The Antique Trend indicator is a tool for technical analysis of financial markets, reflecting curre
The Riko Trend indicator is a revolutionary trend trading and filtering solution with all the important features of a trend tool built into one tool! The Riko Trend indicator is good for any trader, suitable for any trader for both forex and binary options. You don’t need to configure anything, everything is perfected by time and experience, it works great during a flat and in a trend. The Riko Trend indicator is a technical analysis tool for financial markets that reflects the current price
Be notified of every color change of Heiken Ashi (HA) candles. The indicator will trigger past and new signals every time that HA candles change their colors. ( Note : this tool is based on the code of Heiken Ashi indicator developed by MetaQuotes Software Corp.) Features The signals are triggered at closing of last bar/opening of a new bar; Any kind of alerts can be enabled: Dialog Box, Email message, SMS notifications for smartphones and tablets, and Sound alerts; By default, up arrows are p
Volality Index scalper indicator  Meant for Volality pairs such as Volality 10, 25, 50, 75 and 100 The indicator works on all timeframes from the 1 minute to the monthly timeframe the indicator is non repaint the indicator has 3 entry settings 1 color change on zero cross 2 color change on slope change 3 color change on signal line cross Orange line is your sell signal Blue line is your buy signal.
Laguerre SuperTrend Clouds   adds an Adaptive Laguerre averaging algorithm and alerts to the widely popular SuperTrend indicator. As the name suggests,   Laguerre SuperTrend Clouds (LSC)   is a trending indicator which works best in trendy (not choppy) markets. The SuperTrend is an extremely popular indicator for intraday and daily trading, and can be used on any timeframe. Incorporating Laguerre's equation to this can facilitate more robust trend detection and smoother filters. The LSC uses the
This indicator is used to compare the relative strength of the trade on the chart against the other several selected symbols. By comparing the price movement of each traded variety based on the same base day, several trend lines of different directions can be seen, reflecting the strong and weak relationship between the several different traded varieties, so that we can have a clearer understanding of the market trend. For example, you can apply this indicator on a EurUSD chart and compare it
Indicator and Expert Adviser  EA Available in the comments section of this product. Download with Indicator must have indicator installed for EA to work. Mt5 indicator alerts for bollinger band and envelope extremes occurring at the same time. Buy signal alerts occur when A bullish candle has formed below both the lower bollinger band and the lower envelope  Bar must open and close below both these indicators. Sell signal occur when A bear bar is formed above the upper bollinger band and upp
To get access to MT4 version please click here . - This is the exact conversion from TradingView: "Stochastic Momentum Index" By "UCSgears". - This is a popular version of stochastic oscillator on tradingview. - This is a light-load processing and non-repaint indicator. - Buffers are available for the lines on chart. - You can message in private chat for further changes you need. Thanks for downloading
Was: $249  Now: $99   Market Profile defines a number of day types that can help the trader to determine market behaviour. A key feature is the Value Area, representing the range of price action where 70% of trading took place. Understanding the Value Area can give traders valuable insight into market direction and establish the higher odds trade. It is an excellent addition to any system you may be using. Inspired by Jim Dalton’s book “Mind Over Markets”, this indicator is designed to suit the
Tout d'abord, il convient de souligner que cet outil de trading est un indicateur non repeint, non redessiné et non retardé, ce qui le rend idéal pour le trading professionnel. L'indicateur Smart Price Action Concepts est un outil très puissant à la fois pour les nouveaux et les traders expérimentés. Il regroupe plus de 20 indicateurs utiles en un seul, combinant des idées de trading avancées telles que l'analyse du trader Inner Circle et les stratégies de trading Smart Money Concepts. Cet in
An indicator of pattern #31 ("Long Island") from Encyclopedia of Chart Patterns by Thomas N. Bulkowski. The second gap is in the opposite direction. Parameters: Alerts - show alert when an arrow appears   Push - send a push notification when an arrow appears (requires configuration in the terminal) GapSize - minimum gap size in points ArrowType - a symbol from 1 to 17 ArrowVShift - vertical shift of arrows in points   ShowLevels - show levels ColUp - color of an upward line ColDn - color of a
The best time to trade Using this Indicator is when the time reach exactly hour,half,45 minutes,15 minutes and sometimes 5 minutes.. This indicators is helpful to those who trade boom and crash indecies.How to read this indicator first you'll see Blue allow and Red allow all these allows used to indicate or to detect the spike which will happen so the allow happens soon before the spike happen.This indicator works properly only in boom and crash trading thing which you have to consider when
L'indicateur construit les cotations actuelles, qui peuvent être comparées aux cotations historiques et, sur cette base, faire une prévision de l'évolution des prix. L'indicateur dispose d'un champ de texte pour une navigation rapide jusqu'à la date souhaitée. Option : Symbole - sélection du symbole que l'indicateur affichera ; SymbolPeriod - sélection de la période à partir de laquelle l'indicateur prendra des données ; IndicatorColor - couleur de l'indicateur ; HorisontalShift -
Indicateur pour déterminer plat et tendance. Si le prix est inférieur à l'un des deux histogrammes et des deux lignes (rouge et bleu), il s'agit d'une zone de vente. Lors de l'achat de cette version de l'indicateur, version MT4 pour un compte réel et un compte démo - en cadeau (pour recevoir, écrivez-moi un message privé) ! Si le prix est au-dessus de l'un des deux histogrammes et des deux lignes (rouge et bleue), il s'agit d'une zone d'achat. Version MT4 : https://www.mql5.com/en/market/
Renko Gold
Ignacio Agustin Mene Franco
Renko Gold! clearly indicates the floors and ceilings where it goes from 4 lines, the line below that marks the floor in green confirming with the thinnest line clarifies the purchase entry, the same is for sale, the top line marks the ceiling and the thinnest red line marks the sale, This indicator works for all temporalities! For Forex and Synthetic Indices markets! It also works for crypto markets! Good profit! World Investor.
QM Pattern Scanner MT5
Reza Aghajanpour
5 (3)
QM (Quasimodo) Pattern is based on Read The Market(RTM) concepts. The purpose of this model is to face the big players of the market (financial institutions and banks), As you know in financial markets, big traders try to fool small traders, but RTM prevent traders from getting trapped. This style is formed in terms of price candles and presented according to market supply and demand areas and no price oscillator is used in it. RTM concepts are very suitable for all kinds of investments, includi
Trade history
Andriy Konovalov
5 (3)
The indicator plots charts of profit taken at the Close of candles for closed (or partially closed) long and short positions individually. The indicator allows to filter deals by the current symbol, specified expert ID (magic number) and the presence (absence) of a substring in a deal comment, to set the start time and the periodicity of profit reset (daily, weekly or monthly) to calculate the profit chart. The indicator also displays the floating (not fixed) profit of the opened positions at th
FFx Watcher Pro MT5
Eric Venturi-Bloxs
3.67 (3)
The FFx Watcher PRO is a dashboard displaying on a single chart the current direction of up to 15 standard indicators and up to 21 timeframes. It has 2 different modes: Watcher mode: Multi Indicators User is able to select up to 15 indicators to be displayed User is able to select up to 21 timeframes to be displayed Watcher mode: Multi Pairs User is able to select any number of pairs/symbols User is able to select up to 21 timeframes to be displayed This mode uses one of the standard indicators
PZ Trend Trading MT5
PZ TRADING SLU
3.67 (3)
Trend Trading is an indicator designed to profit as much as possible from trends taking place in the market, by timing pullbacks and breakouts. It finds trading opportunities by analyzing what the price is doing during established trends. [ Installation Guide | Update Guide | Troubleshooting | FAQ | All Products ] Trade financial markets with confidence and efficiency Profit from established trends without getting whipsawed Recognize profitable pullbacks, breakouts and early reversals The ind
VR Cub MT 5
Vladimir Pastushak
VR Cub est un indicateur permettant d'obtenir des points d'entrée de haute qualité. L'indicateur a été développé pour faciliter les calculs mathématiques et simplifier la recherche de points d'entrée dans un poste. La stratégie de trading pour laquelle l'indicateur a été rédigé prouve son efficacité depuis de nombreuses années. La simplicité de la stratégie de trading est son grand avantage, qui permet même aux traders débutants de négocier avec succès avec elle. VR Cub calcule les points d'ouve
Cumulative delta indicator As most traders believe, the price moves under the pressure of market buying or selling. When someone redeems an offer standing in the cup, the deal is a "buy". If someone pours into the bid standing in the cup - the deal goes with the direction of "sale". The delta is the difference between purchases and sales. A cumulative delta - the difference between the cumulative sum of purchases and sales for a certain period of time. It allows you to see who is currently contr
Market Structure Patterns
Samuel Manoel De Souza
4.7 (20)
Market Structure Patterns is an indicator based on smart money concepts that displays almost all of the SMC/ICT elements needed to take your trading decisions to the next level. Take advantage of the alerts , push notifications and email messages to keep informed from when an element is formed on the chart, the price crosses a level and/or enters in a box/zone. Developers can access the values of the elements of the indicator using the global variables  what allows the automation of trading deci
Cet indicateur vous montrera les valeurs TP et SL (dans cette devise) que vous avez déjà définies pour chaque commande sur les graphiques (fermées à la ligne de transaction/commande) qui vous aideront beaucoup à estimer vos profits et pertes pour chaque commande. Et il vous montre également les valeurs PIP. le format affiché est "Valeurs monétaires de nos valeurs de profit ou de perte / PIPs". La valeur TP sera affichée en couleur verte et la valeur SL sera affichée en couleur rouge. Pour tou
Introduction The "Two Moving Average Crossover" indicator for MetaTrader 5 (MT5) is a technical analysis tool that displays two moving averages and notifies when the moving averages cross each other. The indicator calculates and plots two moving averages, one of which is faster and the other is slower. When the faster moving average crosses above the slower moving average, it is considered a bullish signal, indicating a potential trend reversal or the start of a new uptrend. Conversely, when th
Les acheteurs de ce produit ont également acheté
Tout d'abord, il convient de souligner que ce système de trading est un indicateur non repeint, non redessiné et non retardé, ce qui le rend idéal pour le trading manuel et automatisé. Le "Système de Trading Smart Trend MT5" est une solution de trading complète conçue pour les traders débutants et expérimentés. Il combine plus de 10 indicateurs premium et propose plus de 7 stratégies de trading robustes, ce qui en fait un choix polyvalent pour différentes conditions de marché. Stratégie de suivi
Atomic Analyst MT5
Issam Kassas
4.82 (11)
Tout d'abord, il convient de souligner que cet indicateur de trading n'est ni repainting, ni redrawing et ne présente aucun délai, ce qui le rend idéal à la fois pour le trading manuel et automatisé. L'Analyste Atomique est un indicateur d'action sur les prix PA qui utilise la force et le momentum du prix pour trouver un meilleur avantage sur le marché. Équipé de filtres avancés qui aident à éliminer les bruits et les faux signaux, et à augmenter le potentiel de trading. En utilisant plusieur
FX Volume MT5
Daniel Stein
4.94 (17)
Obtenez votre mise à jour quotidienne du marché avec des détails et des captures d'écran via notre Morning Briefing ici sur mql5 et sur Telegram ! FX Volume est le PREMIER et SEUL indicateur de volume qui fournit un VRAI aperçu du sentiment du marché du point de vue d'un courtier. Il fournit des informations impressionnantes sur la façon dont les acteurs institutionnels du marché, comme les courtiers, sont positionnés sur le marché des changes, bien plus rapidement que les rapports COT. Voir c
Quantum Trend Sniper
Bogdan Ion Puscasu
5 (37)
Présentation       Quantum Trend Sniper Indicator   , l'indicateur révolutionnaire MQL5 qui transforme la façon dont vous identifiez et négociez les inversions de tendance ! Développé par une équipe de traders expérimentés avec une expérience commerciale de plus de 13 ans,       Indicateur Quantum Trend Sniper       est conçu pour propulser votre parcours de trading vers de nouveaux sommets grâce à sa manière innovante d'identifier les inversions de tendance avec une précision extrêmement élevée
Gold Stuff mt5
Vasiliy Strukov
4.89 (166)
Gold Stuff mt5 est un indicateur de tendance conçu spécifiquement pour l'or et peut également être utilisé sur n'importe quel instrument financier. L'indicateur ne se redessine pas et ne traîne pas. Délai recommandé H1. Contactez-moi immédiatement après l'achat pour obtenir les réglages et un bonus personnel !   RÉGLAGES Dessiner la flèche - on off. dessiner des flèches sur le graphique. Alertes - activation et désactivation des alertes sonores. Notification par e-mail - activé désactivé.
Trend Screener Pro MT5
STE S.S.COMPANY
4.89 (61)
Indicateur de tendance, solution unique révolutionnaire pour le trading et le filtrage des tendances avec toutes les fonctionnalités de tendance importantes intégrées dans un seul outil ! Il s'agit d'un indicateur multi-période et multi-devises 100 % non repeint qui peut être utilisé sur tous les symboles/instruments : forex, matières premières, crypto-monnaies, indices et actions. Trend Screener est un indicateur de suivi de tendance efficace qui fournit des signaux de tendance fléchés avec des
RelicusRoad Pro MT5
Relicus LLC
4.82 (22)
Maintenant 147 $ (augmentant à 499 $ après quelques mises à jour) - Comptes illimités (PCS ou Mac) Manuel d'utilisation RelicusRoad + Vidéos de formation + Accès au groupe Discord privé + Statut VIP UNE NOUVELLE FAÇON DE REGARDER LE MARCHÉ RelicusRoad est l'indicateur de trading le plus puissant au monde pour le forex, les contrats à terme, les crypto-monnaies, les actions et les indices, offrant aux traders toutes les informations et tous les outils dont ils ont besoin pour rester renta
Top indicator for MT5   providing accurate signals to enter a trade without repainting! It can be applied to any financial assets:   forex, cryptocurrencies, metals, stocks, indices .  Watch  the video  (6:22) with an example of processing only one signal that paid off the indicator! MT4 version is here It will provide pretty accurate trading signals and tell you when it's best to open a trade and close it. Most traders improve their trading results during the first trading week with the help of
FX Power MT5 NG
Daniel Stein
5 (4)
Obtenez votre mise à jour quotidienne du marché avec des détails et des captures d'écran via notre Morning Briefing ici sur mql5 et sur Telegram ! FX Power MT5 NG est la nouvelle génération de notre très populaire indicateur de force des devises, FX Power. Et qu'est-ce que ce compteur de force de nouvelle génération offre ? Tout ce que vous avez aimé de l'original FX Power PLUS Analyse de la force de l'OR/XAU Des résultats de calcul encore plus précis Périodes d'analyse configurables individuel
Advanced Supply Demand MT5
Bernhard Schweigert
4.53 (15)
La meilleure solution pour tout commerçant débutant ou expert ! Cet indicateur est un outil de trading unique, de haute qualité et abordable car nous avons intégré un certain nombre de fonctionnalités propriétaires et une nouvelle formule. Avec cette mise à jour, vous pourrez afficher des zones à double horaire. Vous pourrez non seulement afficher un TF plus élevé, mais afficher les deux, le graphique TF, PLUS le TF supérieur : AFFICHAGE DES ZONES NICHÉES. Tous les traders Supply Demand vont ado
Auto Order Block with break of structure based on ICT and Smart Money Concepts Futures Break of Structure ( BoS )             Order block ( OB )            Higher time frame Order block / Point of Interest ( POI )    shown on current chart           Fair value Gap ( FVG ) / Imbalance   ,  MTF      ( Multi Time Frame )    Volume Imbalance     ,  MTF          vIMB Gap’s Equal High / Low’s     ,  MTF             EQH / EQL Liquidity               Current Day High / Low           HOD /
XQ Indicator MetaTrader 5
Marzena Maria Szmit
5 (1)
Step into the realm of Forex trading with confidence and precision using XQ, a cutting-edge Forex indicator designed to elevate your trading game to unprecedented heights. Whether you're a seasoned trader or just stepping into the world of currency exchange, XQ Forex Indicator empowers you with the insights and signals needed to make informed trading decisions. The signal conditions are a combination of three indicators, and XQ Forex Indicator only display  medium and long-term trends . The ind
ICT, SMC, SMART MONEY CONCEPTS, SMART MONEY, Smart Money Concept, Support and Resistance, Trend Analysis, Price Action, Market Structure, Order Blocks, BOS/CHoCH,   Breaker Blocks ,  Momentum Shift,   Supply&Demand Zone/Order Blocks , Strong Imbalance,   HH/LL/HL/LH,    Fair Value Gap, FVG,  Premium  &   Discount   Zones, Fibonacci Retracement, OTE, Buy Side Liquidity, Sell Side Liquidity, BSL/SSL Taken, Equal Highs & Lows, MTF Dashboard, Multiple Time Frame, BigBar, HTF OB, HTF Market Structure
Blahtech Supply Demand MT5
Blahtech Limited
4.57 (14)
Was: $299  Now: $99   Supply Demand uses previous price action to identify potential imbalances between buyers and sellers. The key is to identify the better odds zones, not just the untouched ones. Blahtech Supply Demand indicator delivers functionality previously unavailable on any trading platform. This 4-in-1 indicator not only highlights the higher probability zones using a multi-criteria strength engine, but also combines it with multi-timeframe trend analysis, previously confirmed swings
Le profit de la structure du marché change à mesure que le prix s'inverse et recule. L'indicateur d'alerte d'inversion de la structure du marché identifie le moment où une tendance ou un mouvement de prix approche de l'épuisement et est prêt à s'inverser. Il vous avertit des changements dans la structure du marché qui se produisent généralement lorsqu'un renversement ou un recul majeur est sur le point de se produire. L'indicateur identifie initialement les cassures et la dynamique des prix,
L'indicateur de Carré Gann est un puissant outil d'analyse du marché basé sur l'article "Formule Mathématique pour les Prédictions de Marché" écrit par W.D. Gann. Cet outil utilise des concepts mathématiques et des théories de Gann pour réaliser une analyse précise du marché. Il utilise les carrés de 144, 90, 52 et aussi le carré de 9. De plus, il intègre la méthode du  pour le carré de 9 et sa relation avec les canaux et le modèle en étoile de ce carré. Manuel d'Utilisateur et Application : Ava
AW Trend Predictor MT5
AW Trading Software Limited
4.76 (54)
La combinaison des niveaux de tendance et de panne dans un seul système. Un algorithme d'indicateur avancé filtre le bruit du marché, détermine la tendance, les points d'entrée, ainsi que les niveaux de sortie possibles. Les signaux indicateurs sont enregistrés dans un module statistique, qui vous permet de sélectionner les outils les plus appropriés, montrant l'efficacité de l'historique des signaux. L'indicateur calcule les marques Take Profit et Stop Loss. Manuel et instruction ->   ICI   / v
The Volume by Price Indicator for MetaTrader 5 features Volume Profile and Market Profile TPO (Time Price Opportunity). Get valuable insights out of currencies, equities and commodities data. Gain an edge trading financial markets. Volume and TPO histogram bar and line charts. Volume Footprint charts. TPO letter and block marker charts including split structures. Versatile segmentation and compositing methods. Static, dynamic and flexible ranges with relative and/or absolute visualizations. Lay
TrendLine PRO MT5
Evgenii Aksenov
4.78 (49)
The Trend Line PRO indicator is an independent trading strategy. It shows the trend change, the entry point to the transaction, as well as automatically calculates three levels of Take Profit and Stop Loss protection Trend Line PRO is perfect for all Meta Trader symbols: currencies, metals, cryptocurrencies, stocks and indices Advantages of Trend Line PRO Never redraws its signals The possibility of using it as an independent strategy It has three automatic levels Take Profit and Stop Loss lev
MetaBands M5
Vahidreza Heidar Gholami
4.67 (3)
MetaBands uses powerful and unique algorithms to draw channels and detect trends so that it can provide traders with potential points for entering and exiting trades. It’s a channel indicator plus a powerful trend indicator. It includes different types of channels which can be merged to create new channels simply by using the input parameters. MetaBands uses all types of alerts to notify users about market events. Features Supports most of the channel algorithms Powerful trend detection algorith
Présentation       Quantum Breakout PRO   , l'indicateur révolutionnaire MQL5 qui transforme la façon dont vous négociez les zones d'évasion ! Développé par une équipe de traders expérimentés avec une expérience commerciale de plus de 13 ans,       Évasion quantique PRO       est conçu pour propulser votre parcours commercial vers de nouveaux sommets grâce à sa stratégie de zone de discussion innovante et dynamique. Quantum Breakout Indicator vous donnera des flèches de signalisation sur le
Gartley Hunter Multi
Siarhei Vashchylka
5 (5)
Gartley Hunter Multi - An indicator for searching for harmonic patterns simultaneously on dozens of trading instruments and on all classic timeframes: (m1, m5, m15, m30, H1, H4, D1, Wk, Mn). Manual (Be sure to read before purchasing) | Version for MT4 Advantages 1. Patterns: Gartley, Butterfly, Shark, Crab. Bat, Alternate Bat, Deep Crab, Cypher 2. Simultaneous search for patterns on dozens of trading instruments and on all classic timeframes 3. Search for patterns of all possible sizes. Fr
Trend Line Map Pro MT5
STE S.S.COMPANY
4.67 (9)
Trend Line Map indicator is an addons for   Trend Screener Indicator . It's working as a scanner for all signals generated by Trend screener ( Trend Line Signals ) . It's a Trend Line Scanner based on Trend Screener Indicator.  If you don't have Trend Screener Pro Indicator,   the Trend Line Map Pro will not work.     LIMITED TIME OFFER : Trend Line Map Indicator is available for only 50 $ and lifetime. ( Original price 125$ ) By accessing to our MQL5 Blog,  you can find all our premium indica
TrendDecoder Premium MT5
Christophe, Pa Trouillas
5 (1)
Identifiez les ranges et les tendances fortes  |  Obtenez les premiers signaux   |    Obtenez des TP et des sorties   clairs   |    Repérer les niveaux Fibo que le prix va tester   |  Indicateur qui ne retrace pas, non retardé - idéal pour le trading manuel et automatisé - adapté à tous les actifs et à toutes les unités de temps - 50% discount   pour le lancement - puis retour à >>   149 $ Après votre achat,   contactez-moi sur ce canal  pour obtenir les réglages recommandés. Version MT4 :   cli
TPSpro TRENDPRO  - is a trend indicator that automatically analyzes the market and provides information about the trend and each of its changes, as well as giving signals for entering trades without redrawing! The indicator uses each candle, analyzing them separately. referring to different impulses - up or down impulse. Exact entry points into transactions for currencies, crypto, metals, stocks, indices!  -  Version MT4                  DETAILED DESCRIPTION        /       TRADING SETUPS       
Golden Spikes Detector
Batsirayi L Marango
5 (1)
Golden Spikes Detector Cet indicateur est basé sur une stratégie avancée principalement pour les pics de trading sur les indices Boom et Crash. Des algorithmes complexes ont été mis en œuvre pour détecter uniquement les entrées à forte probabilité. Il alerte sur les entrées potentielles d’achat et de vente. Pour échanger des pics sur le courtier Deriv ou Binary, prenez uniquement les alertes Buy Boom et Sell Cash. Il a été optimisé pour être chargé sur une période de 5 minutes, bien qu'une analy
Matrix Arrow Indicator MT5
Juvenille Emperor Limited
5 (14)
Matrix Arrow Indicator MT5   est une tendance unique 10 en 1 suivant un indicateur multi-période   100% non repeint   qui peut être utilisé sur tous les symboles/instruments:   forex ,   matières premières ,   crypto-monnaies ,   indices ,  actions .  Matrix Arrow Indicator MT5  déterminera la tendance actuelle à ses débuts, en rassemblant des informations et des données à partir d'un maximum de 10 indicateurs standard, qui sont: Indice de mouvement directionnel moyen (ADX) Indice de canal de m
IX Power MT5
Daniel Stein
5 (2)
IX Power   apporte enfin la précision imbattable de FX Power aux symboles non-Forex. Il détermine avec précision l'intensité des tendances à court, moyen et long terme de vos indices, actions, matières premières, ETF et même crypto-monnaies préférés. Vous pouvez   analyser tout ce que   votre terminal a à offrir. Essayez-le et découvrez comment   votre timing s'améliore considérablement   lors de vos transactions. Caractéristiques principales d'IX Power Résultats de calcul précis à 100 %,
** All Symbols x All Timeframes scan just by pressing scanner button ** ***Contact me after purchase to send you instructions and add you in "123 scanner group" for sharing or seeing experiences with other users. After 15 years of experience in the markets and 3 years of programming, Winner indicator is ready. I would like to share with you! Introduction The 123 Pattern Scanner indicator with a special enhanced algorithm is a very repetitive common pattern finder with a high success rate . Inte
Strong Support mt5
Vasiliy Strukov
5 (9)
Les niveaux de support et de résistance sont depuis longtemps un outil puissant pour l'analyse du marché. Strong support l'indicateur construit les niveaux de support sur les bas de prix locaux et les niveaux de résistance sur les hauts de prix locaux. Mes autres développements peuvent être consultés ici Il est recommandé d'utiliser conjointement avec un indicateur de tendance, par exemple, Gold Stuff - cela vous permettra de négocier sur la tendance et de définir simultanément des zones de
Plus de l'auteur
WalkForwardOptimizer MT5
Stanislav Korotky
3.86 (7)
WalkForwardOptimizer library allows you to perform rolling and cluster walk-forward optimization of expert advisers (EA) in MetaTrader 5. To use the library include its header file WalkForwardOptimizer.mqh into your EA source code, add call provided functions as appropriate. Once the library is embedded into EA, you may start optimization according to the procedure described in the User guide . When it's finished, intermediate results are saved into a CSV file and some special global variables.
RenkoFromRealTicks
Stanislav Korotky
4.67 (3)
This non-trading expert utilizes so called custom symbols feature ( available in MQL API as well) to build renko charts based on history of real ticks of selected standard symbol. RenkoFromRealTicks generates custom symbol quotes, thus you may open many charts to apply different EAs and indicators to the renko. It also transmits real ticks to update renko charts in real time. The generated renko chart uses M1 timeframe. It makes no sense to switch the renko chart to a timeframe other than M1. T
VolumeDeltaBars
Stanislav Korotky
This indicator is a conventional analytical tool for tick volumes changes. It calculates tick volumes for buys and sells separately, and their delta on every bar, and displays volumes by price clusters (cells) within a specified bar (usually the latest one). The algorithm used internally is the same as in the indicator VolumeDeltaMT5 , but results are shown as cumulative volume delta bars (candlesticks). Analogous indicator for MetaTrader 4 exists - CumulativeDeltaBars . This is a limited substi
AutomaticZigZag
Stanislav Korotky
4.67 (3)
This is a non-parametric ZigZag providing 4 different methods of calculation. Upward edge continues on new bars while their `highs` are above highest `low` among previous bars, downward edge continues on next bars while their `lows` are below lowest `high` among previous; Gann swing: upward edge continues while `highs` and `lows` are higher than on the left adjacent bar, downward edge continues while `highs` and `lows` are lower than on the left adjacent bar. Inside bars (with lower `high` and
FREE
Time And Sales Layout indicator shows traded buy and sell volumes right on the chart. It provides a graphical representation of most important events in the time and sales table. The indicator downloads and processes a history of real trade ticks. Depending from selected depth of history, the process may take quite some time. During history processing the indicator displays a comment with progress percentage. When the history is processed, the indicator starts analyzing ticks in real time. The l
SOMFX1Predictor
Stanislav Korotky
If you like trading by candle patterns and want to reinforce this approach by modern technologies, this indicator and other related tools are for you. In fact, this indicator is a part of a toolbox, that includes a neural network engine implementing Self-Organizing Map (SOM) for candle patterns recognition, prediction, and provides you with an option to explore input and resulting data. The toolbox contains: SOMFX1Builder  - a script for training neural networks; it builds a file with generalize
CustomVolumeDelta
Stanislav Korotky
4.5 (2)
This indicator displays volume delta (of either tick volume or real volume) encoded in a custom symbol, generated by special expert advisers, such as RenkoFromRealTicks . MetaTrader does not allow negative values in the volumes, this is why we need to encode deltas in a special way, and then use CustomVolumeDelta indicator to decode and display the deltas. This indicator is applicable only for custom instruments generated in appropriate way (with signed volumes encoded). It makes no sense to ap
FREE
VolumeDeltaWaves
Stanislav Korotky
5 (1)
This indicator is an extended implementation of Weis waves. It builds Weis waves on absolute volumes (which is the classical approach) or delta of volumes (unique feature) using different methods of wave formation and visualization. It works with real volumes, if available, or with tick volumes otherwise, but also provides an option to use so called "true volume surrogates", as an artificial substitution for missing real volumes (for example, for Forex symbols), which was introduced in correspo
Comparator
Stanislav Korotky
4.14 (7)
This indicator compares the price changes during the specified period for the current symbol and other reference symbol. It allows to analyze the similar movements of highly correlated symbols, such as XAUUSD and XAGUSD, and find their occasional convergences and divergences for trading opportunities. The indicator displays the following buffers: light-green thick line - price changes of the current symbol for TimeGap bars; light-blue thin line - price changes of the reference symbol ( LeadSymbo
FREE
Order Book, known also as Market Book, market depth, Level 2, - is a dynamically updated table with current volumes of orders to buy and to sell specific financial instument at price levels near Bid and Ask. MetaTrader 5 provides the means for receiving market book from your broker, but in real time only, without access to its history. This expert adviser OrderBook History Playback allows you to playback the market book events on the history using files, created by OrderBook Recorder . The exper
FREE
Most of traders use resistance and support levels for trading, and many people draw these levels as lines that go through extremums on a chart. When someone does this manually, he normally does this his own way, and every trader finds different lines as important. How can one be sure that his vision is correct? This indicator helps to solve this problem. It builds a complete set of virtual lines of resistance and support around current price and calculates density function for spatial distributi
ADXS
Stanislav Korotky
5 (3)
Ever wondered why standard ADX is made unsigned and what if it would be kept signed? This indicator gives the answer, which allows you to trade more efficient. This indicator calculates ADX values using standard formulae, but excludes operation of taking the module of ADX values, which is forcedly added into ADX for some reason. In other words, the indicator preserves natural signs of ADX values, which makes it more consistent, easy to use, and gives signals earlier than standard ADX. Strictly s
ADXSignal
Stanislav Korotky
Classical ADX revamped to provide faster and more solid trading signals. This indicator calculates ADX values using standard formulae, but excludes operation of taking the module of ADX values, which is forcedly added into ADX for some reason. In other words, the indicator preserves natural signs of ADX values, which makes it more consistent, easy to use, and gives signals earlier than standard ADX. Strictly speaking, any conversion to an absolute value destroys a part of information, and it mak
RenkoChartsDemo
Stanislav Korotky
This is a demo version of a non-trading expert , which utilizes so called the custom symbols feature ( available in MQL as well ) to build renko charts based on historical quotes of selected standard symbol and to refresh renko in real-time according to new ticks. Also it translates real ticks to the renko charts, which allows other EAs and indicators to trade and analyze renko. Place the EA on a chart of a working instrument. The lesser timeframe of the source chart is, the more precise resulti
FREE
RenkoFromRealTicks DEMO
Stanislav Korotky
1 (1)
This non-trading expert utilizes so called   custom symbols   feature to build renko charts based on history of real ticks of selected standard symbol. RenkoFromRealTicks generates custom symbol quotes, thus you may open many charts to apply different EAs and indicators to the renko. It also transmits real ticks to update renko charts in real time. This is a functionally limited demo version of  RenkoFromRealTicks . RenkoFromRealTicks utility can not work in the tester because it uses CustomSym
FREE
Order Book, known also as Market Book, market depth, Level 2, - is a dynamically updated table with current volumes of orders to buy and to sell specific financial instument at price levels near Bid and Ask. MetaTrader 5 provides the means for receiving market book from your broker in real time. The expert OrderBook Recorder records market book changes and stores them in local files for further usage in indicators and expert adviser, including testing in the tester. The expert stores market book
FREE
HZZM
Stanislav Korotky
2.67 (3)
This is an adaptive ZigZag based on modification of  HZZ indicator (original source code is available in this article ). Most important changes in this version: two additional indicator buffers added for zigzag evolution monitoring - they show cross signs at points where zigzag direction first changes; zigzag range (H) autodetection on day by day basis; time-dependent adjustment of zigzag range. Parameters: H - zigzag range in points; this parameter is similar to original HZZ, but it can take 0
FREE
WalkForwardDemo MT5
Stanislav Korotky
4 (2)
WalkForwardDemo is an expert adviser (EA) demonstrating how the built-in library WalkForwardOptimizer (WFO) for walk-forward optimization works. It allows you to easily optimize, view and analyze your EA performance and robustness in unknown trading conditions of future. You may find more details about walk-forward optimization in Wikipedia . Once you have performed optimization using WFO, the library generates special global variables (saved in an "archived" file with GVF-extension) and a CSV-f
FREE
ReturnAutoScale
Stanislav Korotky
5 (2)
The indicator calculates running total of linear weighted returns. It transforms rates into integrated and difference-stationary time series with distinctive buy and sell zones. Buy zones are shown in blue, sell zones in red. Parameters: period - number of bars to use for linear weighted calculation; default value - 96; smoothing - period for EMA; default value - 5; mode - an integer value for choosing calculation mode: 0 - long term trading; 1 - medium term trading; 2 - short term trading; defa
FREE
PointsVsBars
Stanislav Korotky
This indicator provides a statistical analysis of price changes (in points) versus time delta (in bars). It calculates a matrix of full statistics about price changes during different time periods, and displays either distribution of returns in points for requested bar delta, or distribution of time deltas in bars for requested return. Please, note, that the indicator values are always a number of times corresponding price change vs bar delta occurred in history. Parameters: HistoryDepth - numbe
FREE
Year2Year
Stanislav Korotky
This indicator shows price changes for the same days in past years. D1 timeframe is required. This is a predictor indicator that finds D1 bars for the same days in past 8 years and shows their relative price changes on the current chart. Parameters: LookForward - number of days (bars) to show "future" price changes; default is 5; Offset - number of days (bars) to shift back in history; default is 0; ShowAverage - mode switch; true - show mean value for all 8 years and deviation bounds; false - s
FREE
CyclicPatterns
Stanislav Korotky
This indicator shows price changes for the same days in the past. This is a predictor that finds bars for the same days in past N years, quarters, months, weeks, or days (N is 10 by default) and shows their relative price changes on the current chart. Number of displayed buffers and historical time series for comparison is limited to 10, but indicator can process more past periods if averaging mode is enabled (ShowAverage is true) - just specify required number in the LookBack parameter. Paramet
RenkoCharts
Stanislav Korotky
This non-trading expert utilizes so called custom symbols feature ( available in MQL as well ) to build renko charts based on historical quotes of selected standard symbol and to refresh renko in real-time according to new ticks. Also, it translates real ticks to the renko charts, which allows other EAs and indicators to trade and analyze renko. Place RenkoCharts on a chart of a work instrument. The lesser timeframe of the source chart is, the more precise resulting renko chart is, but the lesse
SOMFX1Builder
Stanislav Korotky
5 (1)
If you like trading by candle patterns and want to reinforce this approach by modern technologies, this script is for you. In fact, it is a part of a toolbox, that includes a neural network engine implementing Self-Organizing Map (SOM) for candle patterns recognition, prediction, and provides you with an option to explore input and resulting data. The toolbox contains: SOMFX1Builder  - this script for training neural networks; it builds a file with generalized data about most characteristic pric
FREE
WalkForwardBuilder MT5
Stanislav Korotky
5 (1)
This script allows performing a walk-forward analysis of trading experts based on the data collected by the WalkForwardLight MT5 library. The script builds a cluster walk forward report and rolling walk forward reports that refine it, in the form of a single HTML page. This script is optional, as the library automatically generates the report immediate after the optimization in the tester is complete. However, the script is convenient because it allows using the same collected data to rebuild th
FREE
OrderBook Utilities is a script, which performs several service operations on order book hob-files, created by OrderBook Recorder . The script processes a file for work symbol of the current chart. The file date is selected by means of the input parameter CustomDate (if it's filled in) or by the point where the script is dropped on the chart. Depending from the operation, useful information is written into the log, and optionally new file is created. The operation is selected by the input parame
FREE
Mirror
Stanislav Korotky
This indicator predicts rate changes based on the chart display principle. It uses the idea that the price fluctuations consist of "action" and "reaction" phases, and the "reaction" is comparable and similar to the "action", so mirroring can be used to predict it. The indicator has three parameters: predict - the number of bars for prediction (24 by default); depth - the number of past bars that will be used as mirror points; for all depth mirroring points an MA is calculated and drawn on the ch
If you like trading crosses (such as AUDJPY, CADJPY, EURCHF, and similar), you should take into account what happens with major currencies (especially, USD and EUR) against the work pair: for example, while trading AUDJPY, important levels from AUDUSD and USDJPY may have an implicit effect. This indicator allows you to view hidden levels, calculated from the major rates. It finds nearest extremums in major quotes for specified history depth, which most likely form resistence or support levels, a
EvoLevels
Stanislav Korotky
The indicator displays most prominent price levels and their changes in history. It dynamically detects regions where price movements form attractors and shows up to 8 of them. The attractors can serve as resistance or support levels and outer bounds for rates. Parameters: WindowSize - number of bars in the sliding window which is used for detection of attractors; default is 100; MaxBar - number of bars to process (for performance optimization); default is 1000; when the indicator is called from
This is an intraday indicator that uses conventional formulae for daily and weekly levels of pivot, resistance and support, but updates them dynamically bar by bar. It answers the question how pivot levels would behave if every bar were considered as the last bar of a day. At every point in time, it takes N latest bars into consideration, where N is either the number of bars in a day (round the clock, i.e. in 24h) or the number of bars in a week - for daily and weekly levels correspondingly. So,
Filtrer:
Aucun avis
Répondre à l'avis
Version 1.3 2023.06.26
Recompilation.
Version 1.2 2018.06.27
Fixed incompatibility issue introduced in build 1860+. For those who still works on pre-1860 build, this update is optional.