Neural Predictor MT5
- Indikatoren
-
Evgeny Shevtsov
 Indicators for volume trading :
Volume profile,
Classic profile,
Clusters chart,
Demand and supply levels,
Demand and supply diagram,
Cumulative delta.
Indicators for probabilistic analysis :
Monte Carlo predictor,
Neural predictor. - Version: 2.4
- Aktualisiert: 29 April 2026
- Aktivierungen: 10
Der Indikator bezieht sich auf die Mittel der probabilistischen Analyse.
Die Vorhersage wird durch die Monte-Carlo-Methode zusammen mit einem mathematischen Modell eines Neurons durchgeführt.
Die Modellierung der Stichproben für diese Methode wird jedoch nicht künstlich vorgenommen, sondern stammt aus der ursprünglichen "Natur", d. h. aus der Geschichte.
Die Anzahl der Stichproben und die Detailliertheit ihrer Modellierung wird durch die Verwendung eines niedrigeren (relativ aktuellen) Zeitrahmens erreicht.
Algorithmus des Indikators :
Im Allgemeinen läuft der Algorithmus darauf hinaus, dass der Indikator auf die Historie der Ursachen- und Wirkungsstichproben trainiert wird, wobei eine Art kumulative Wirkungsstichprobe, d. h. eine Prognose, gebildet wird.
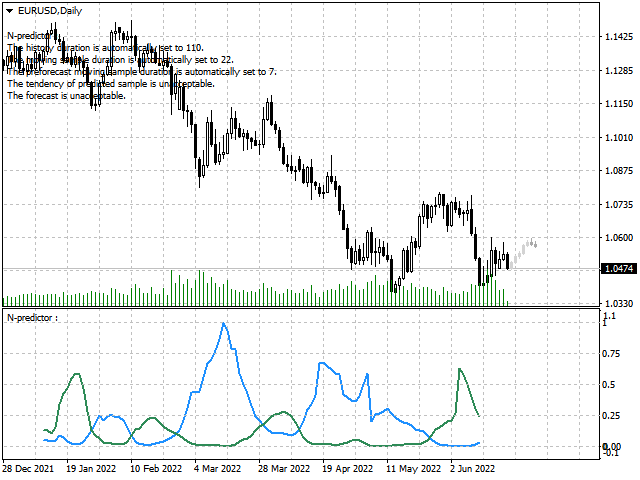
Anschließend wird die erstellte Prognose auf ihre ausgedrückte Tendenz hin überprüft, und wenn sie diese erfüllt, kann diese Prognose berücksichtigt werden.
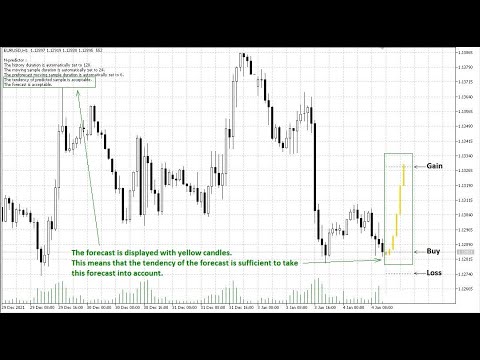
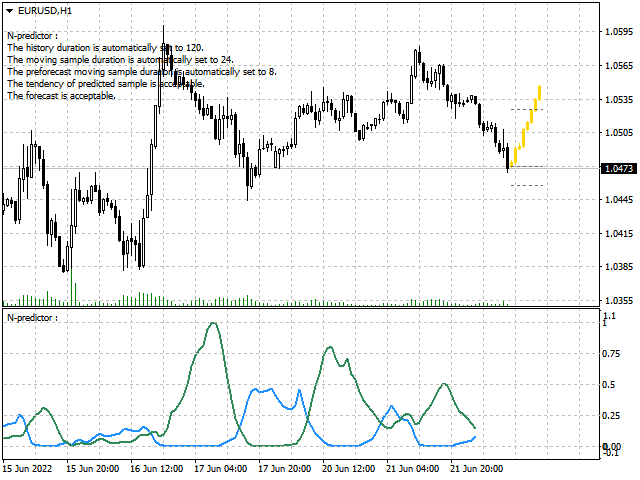
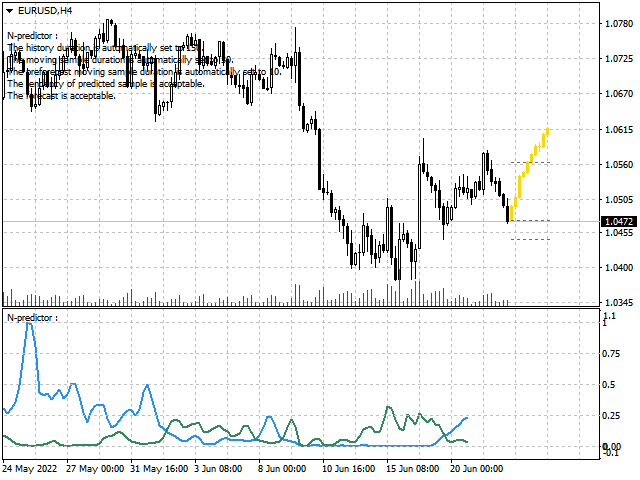
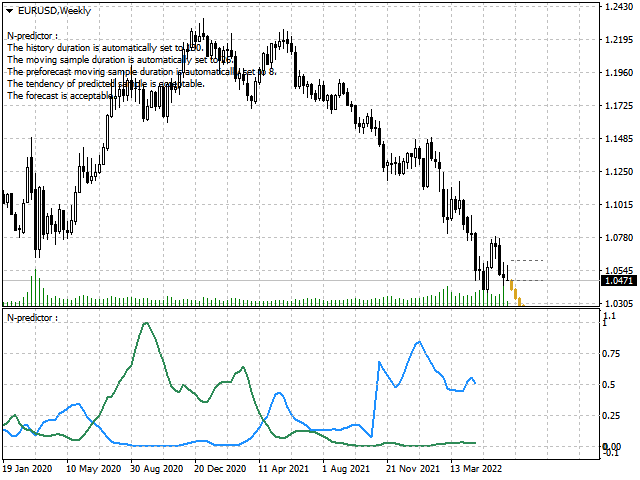
Gleichzeitig werden die Vorhersagekerzen in einer anderen Farbe neu gezeichnet, und die für die Platzierung von Stop-Loss und Take-Profit empfohlenen Kursniveaus erscheinen ebenfalls.
Das erwartete Ergebnis im Falle einer korrekten Vorhersage - ein gewinnbringendes Geschäft bringt mehrere Anteile an Gewinn.
Das erwartete Ergebnis im Falle einer falschen Prognose - ein unrentables Geschäft bringt nur einen Verlustanteil.
Die Häufigkeit der vollständigen Neuberechnung/Nachschulung entspricht der Häufigkeit des unteren Zeitrahmens, der automatisch zugewiesen wird oder über die Eingabevariable willkürlich gewählt werden kann.
Die Dauer der Lernhistorie wird ebenfalls über die Eingabevariable festgelegt, und gerade die Begrenzung dieser Dauer schließt den Effekt des Übertrainings aus.
Verwendungsstrategie :
Die Eröffnung einer Handelsposition erfolgt gemäß der Prognose, die durch gelbe Kerzen angezeigt wird.
Wenn eine Handelsposition mit Stop-Loss geschlossen wurde, aber die vorherige Prognose weiterhin besteht, müssen Sie lediglich eine neue Position eröffnen.
Sie sollten eine eröffnete Handelsposition nicht länger halten als die Dauer der Prognose, d.h. nicht länger als der ForecastDuration-Abstand (siehe unten).
Verwenden Sie dieses Produkt nur als Hilfsmittel für Ihre Handelsstrategie.
Mit anderen Worten, es wird nicht empfohlen, dieses Produkt als alleinige Strategie zu verwenden.
Eingabevariablen:
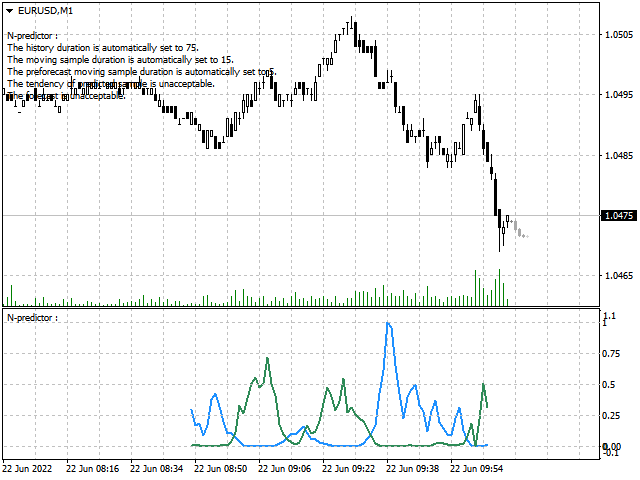
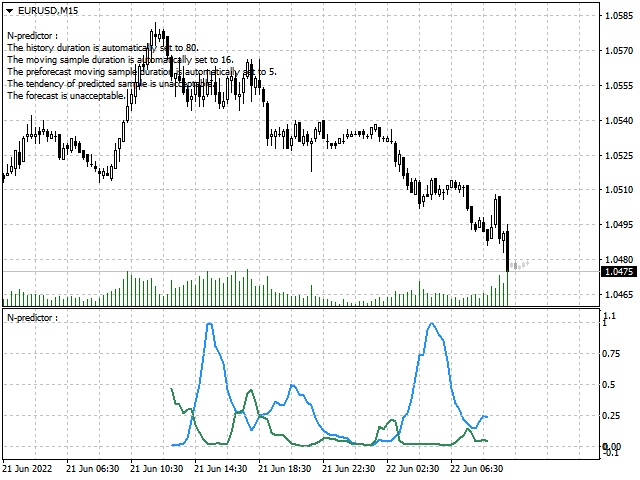
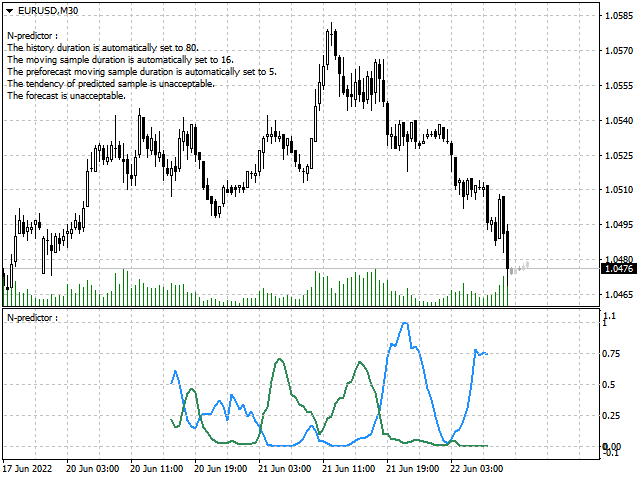
HistoryDuration - der Abstand der Lerngeschichte, wird durch die Anzahl der Kerzen des aktuellen Zeitrahmens festgelegt, wenn der Wert auf Null gesetzt ist, wird er automatisch zugewiesen.
MovingSampleDuration - die Größe (Dauer) der Samples, wird durch die Anzahl der Kerzen des aktuellen Zeitrahmens bestimmt, wenn der Wert auf Null gesetzt wird, wird er automatisch zugewiesen.
ForecastDuration - die Größe (Dauer) der Vorhersage, wird durch die Anzahl der Kerzen des aktuellen Zeitrahmens festgelegt, wenn der Wert auf Null gesetzt wird, wird er automatisch zugewiesen.
ForecastRangeMultiplier - der Multiplikator für die prognostizierte Amplitude.
ForecastAcceptableTendency - der Wert der akzeptablen Prognosetendenz, wird in ATR-s festgelegt.
AverageRangeDuration - der Zeitraum für die Berechnung des ATR-Wertes, wird durch die Anzahl der Kerzen des aktuellen Zeitrahmens festgelegt, wenn der Wert auf Null gesetzt wird, wird er automatisch der HistoryDuration zugeordnet.
AverageRangeMultiplier - der Multiplikator für den ATR-Wert.
ChartMessage - Aktivierung/Deaktivierung der Meldung im Chart-Fenster.
AlertMessage - Aktivieren/Deaktivieren der Warnmeldung über die Akzeptanz der Prognose.
PushMessage - Aktivieren/Deaktivieren der Push-Nachricht über die Annehmbarkeit der Prognose.
LowerTimeframe - unterer Zeitrahmen.
VolumesType - Art der Volumina.
Die anderen Eingabevariablen beziehen sich auf die Farbeinstellungen und ihr Zweck ist aus ihrem Namen ersichtlich.
Indikator-Puffer :
PredictedHighValues - hohe Kurswerte der vorhergesagten Kerzen.
PredictedLowValues - Niedrigpreiswerte der vorhergesagten Kerzen.
PredictedOpenValues - Eröffnungskurswerte der vorhergesagten Kerzen.
PredictedCloseValues - Schlusskurswerte der vorhergesagten Kerzen.
PredictedVolumeValues - Volumenspaltenwerte der vorhergesagten Kerzen.
Die Puffer des Indikators werden nicht im Diagramm angezeigt (die Standardfarbe ist None), da sie nur dann angezeigt werden, wenn der Indikator von außen aufgerufen wird.
Der Beispielcode für den Aufruf des Indikators und die Überprüfung der Annehmbarkeit des Wertes der prognostizierten Tendenz ist auf der Registerkarte "Kommentare" beigefügt.
Anmerkung :
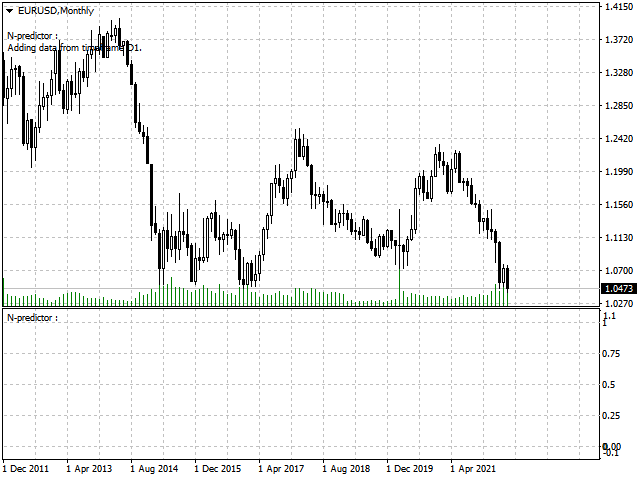
Die Screenshots zeigen die technische Version des Produkts in Form eines Indikators für das Teilfenster.
Die endgültige Version des Produkts wird in Form eines Indikators für das Hauptfenster erstellt und zeigt nur die vorhergesagten Kerzen an.