Cumulative Delta MT4
- Indikatoren
-
Evgeny Shevtsov
 Indicators for volume trading :
Volume profile,
Classic profile,
Clusters chart,
Demand and supply levels,
Demand and supply diagram,
Cumulative delta.
Indicators for probabilistic analysis :
Monte Carlo predictor,
Neural predictor. - Version: 3.6
- Aktualisiert: 10 November 2024
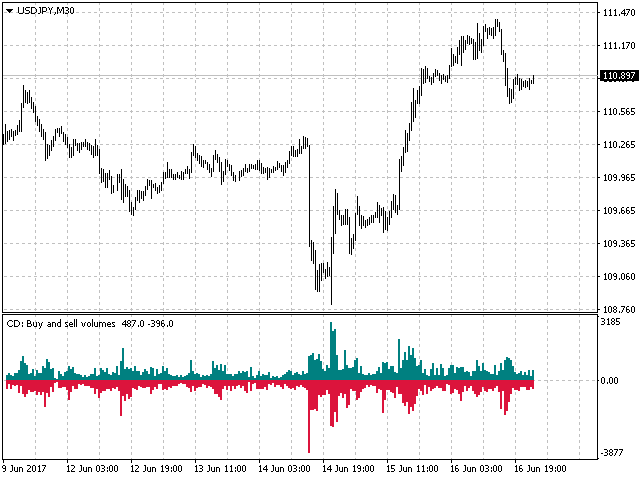
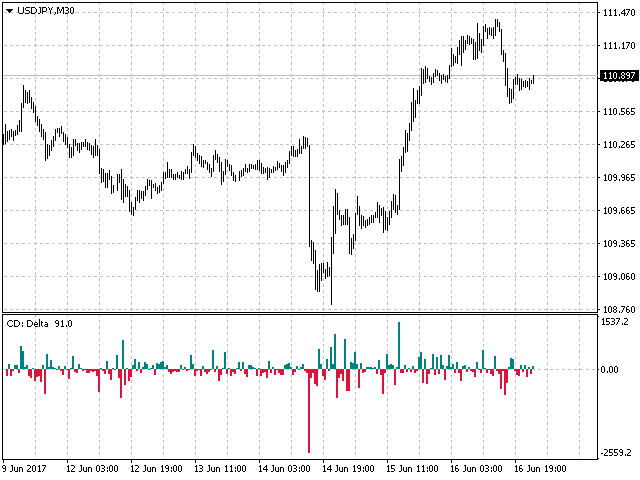
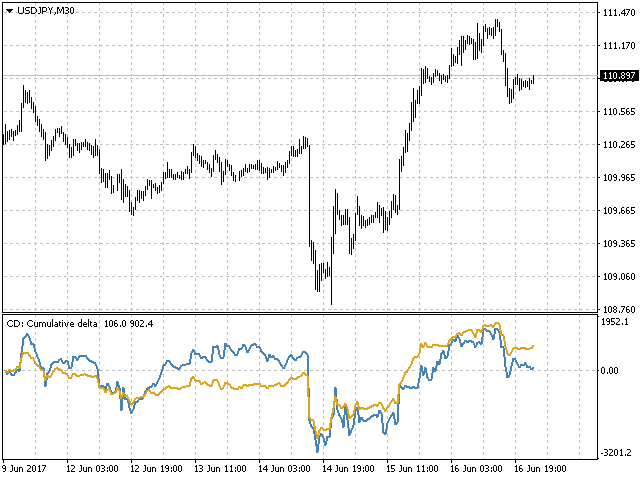
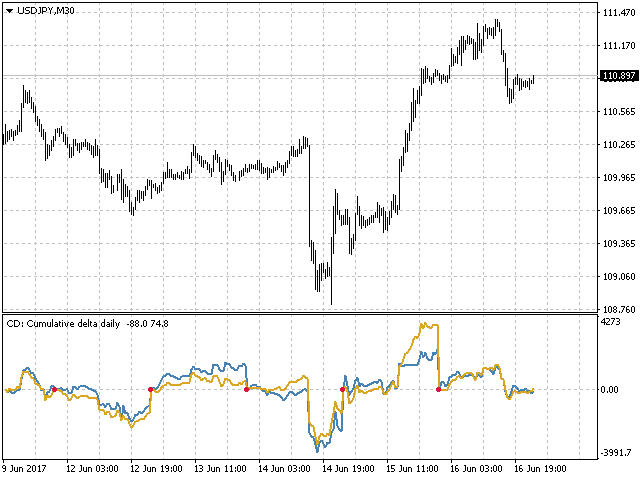
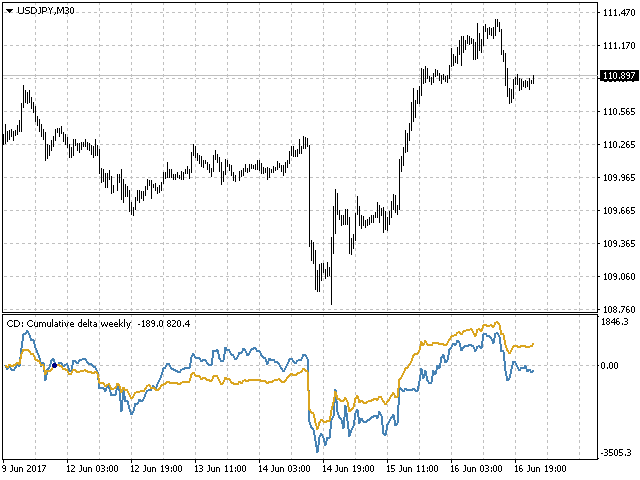
Der Indikator analysiert die Volumenskala und teilt sie in zwei Komponenten auf - Verkäufer- und Käufervolumen - und berechnet außerdem das Delta und das kumulative Delta.
Der Indikator flackert nicht und wird nicht neu gezeichnet, seine Berechnung und Darstellung erfolgen relativ schnell, wobei die Daten der kleineren (im Vergleich zum aktuellen) Zeiträume verwendet werden.
Die Betriebsmodi des Indikators können über die Eingangsvariable Modus umgeschaltet werden:
- Kaufen - zeigt nur die Käufervolumina an.
- Sell - zeigt nur die Volumina der Verkäufer an.
- BuySell - Anzeige nur der Käufer- und Verkäufer-Volumina in zwei getrennten Skalen.
- Delta - der Modus der Differenz (Delta) zwischen den Käufer- und Verkäufer-Volumina.
- CumDelta - kumulierter Delta-Modus.
- CumDeltaDaily - kumulativer Deltamodus mit Nullstellung des Saldos zu Beginn eines jeden Tages.
- CumDeltaWeekly - kumulativer Deltamodus mit Nullsetzung des Saldos zu Beginn jeder Woche.
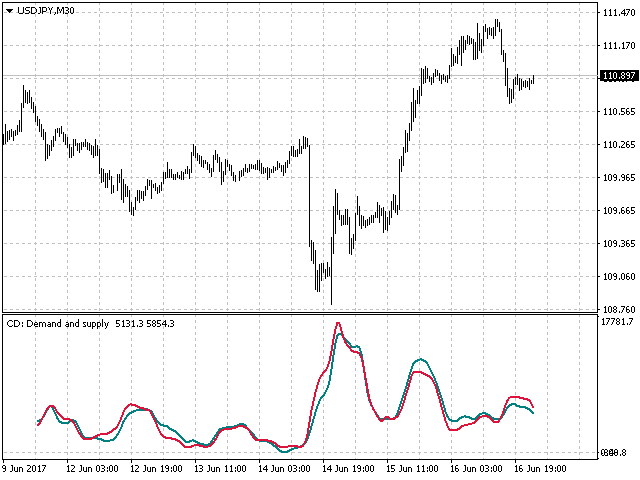
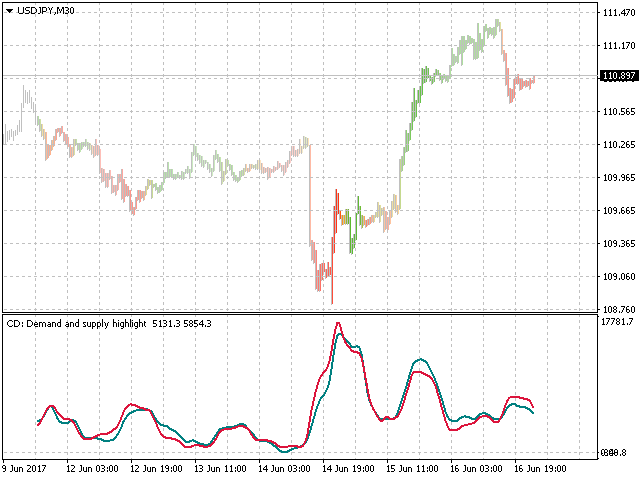
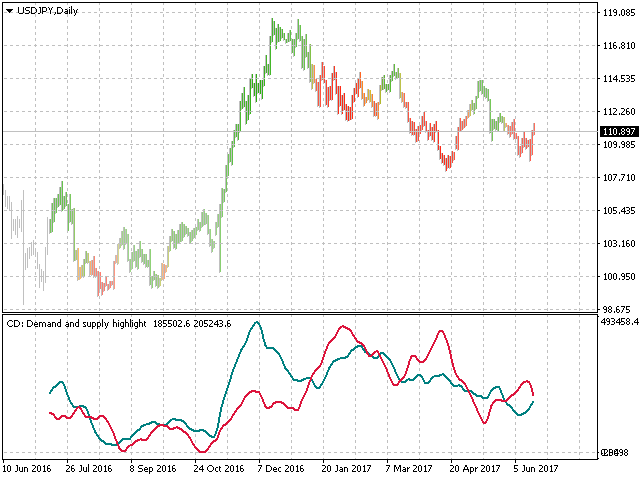
- DemandAndSupply - Anzeige des Diagramms von Angebot und Nachfrage.
Die vollständige Neuberechnung der Daten erfolgt einmal pro Minute, wenn eine neue Kerze im M1-Zeitrahmen geöffnet wird, oder im Falle einer Benutzeraktivität, d.h. wenn das Diagramm tiefer in die Historie gescrollt wird, wenn die Zeitskala des Diagramms geändert wird oder wenn der aktuelle Zeitrahmen geändert wird.
Standardmäßig ist der anfängliche Referenzpunkt die allererste Kerze vom linken Rand des Chart-Fensters. Der Referenzpunkt kann über die Eingabevariable BarsLimit geändert werden.
Falls die Daten für eine der für die Berechnungen erforderlichen Perioden fehlen, generiert der Indikator eine entsprechende Meldung.


As you might know, Volume is the "missing link" to understand price action. Having this prepared in the way CD does it is invaluable to make decisions fast - and it helps. The indicator seems to be rock solid; I have 12-16 instances running per profile, in various configurations and with different pairs, changing is quick, adds only about 5 seconds for the entire profile on good ol' MT4. After migrating from an STP to ECN (different account, new install, copied data) the higher TF didn't show up. I've looked around in the forum, didn't find anything and send a message to Evgeny. While I was hoping to get an answer within 1-2 days, he replied within < 4 hours. THX, btw. Also, his reply was clever enough to help me SOLVE the issue right away. The description is basic but complete, and parameter names are self-explanatory and fun to work with. My issue would probably make a good FAQ item: The higher TF simply needed more M1 and M5 history (by scrolling on those TF a couple of months) - and I think I have even seen a note of this somewhere when I bought CD half a year ago. Anyway, highly recommend this - it's one of the good indicators, gets updated and you have full support. Bye | Buy now :))