Clusters Chart MT5
- Indikatoren
-
Evgeny Shevtsov
 Indicators for volume trading :
Volume profile,
Classic profile,
Clusters chart,
Demand and supply levels,
Demand and supply diagram,
Cumulative delta.
Indicators for probabilistic analysis :
Monte Carlo predictor,
Neural predictor. - Version: 3.4
- Aktualisiert: 30 April 2026
- Aktivierungen: 10
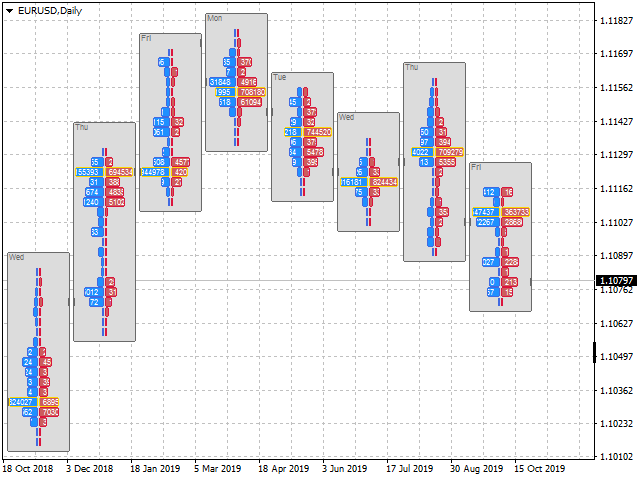
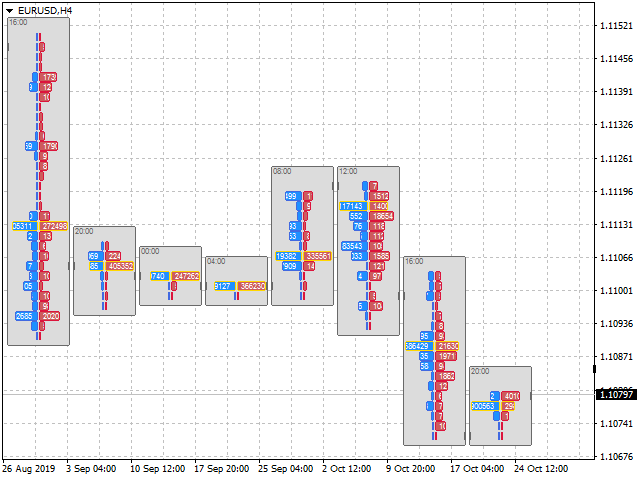
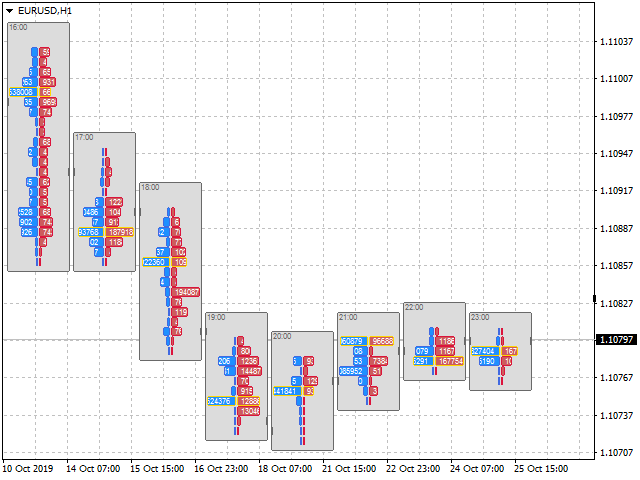
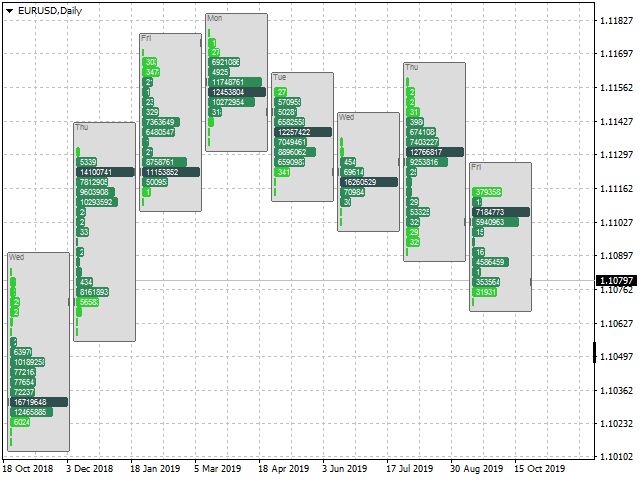
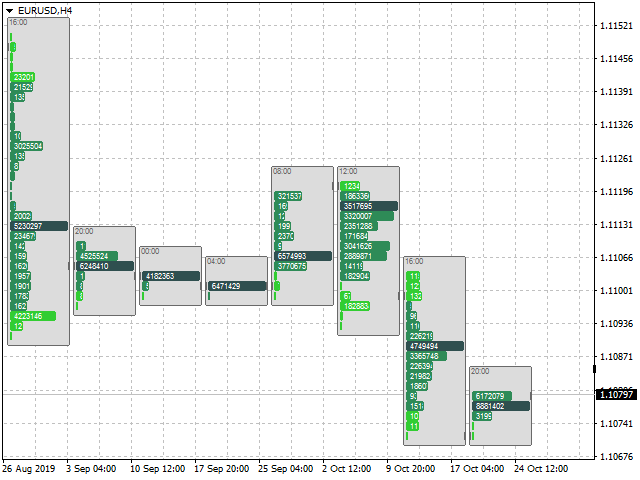
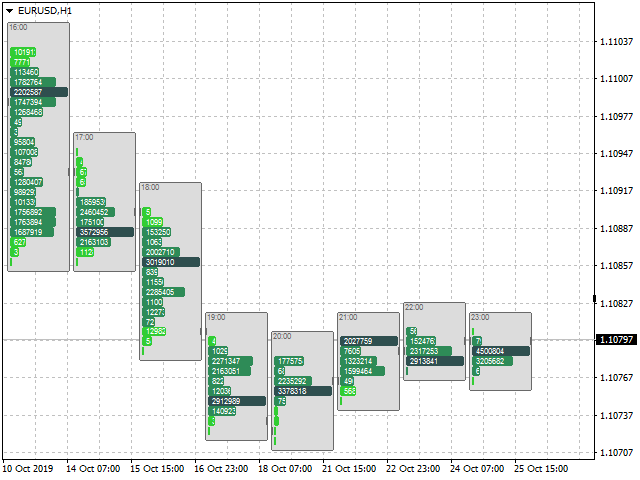
Der Indikator zeigt Volumencluster oder Volumenprofile zur Auswahl an.
Für Handelssymbole, die das Band der Geschäfte enthalten, kann der Indikator Berechnungen auf der Grundlage des Bandes der Geschäfte durchführen.
Eingabevariablen
StepPoint - Clusterschritt in Punkten, wenn der Wert Null ist, wird der Schritt automatisch zugewiesen.
HistoryTicks - Größe der Tick-Historie (für VolumeType im Modus TimeAndSales).
AssociatedTimeframe - Bindung des Indikators an den angegebenen Zeitrahmen des Charts, wenn der Wert gleich Current ist, funktioniert der Indikator auf allen Zeitrahmen.
ClustersVolume - Volumen in Clustern:
- Alle - alle Volumen.
- Active - aktives Volumen (das die Preisbewegung verursacht hat).
ClustersAsDelta - Differenz zwischen dem Volumen von Käufern und Verkäufern.
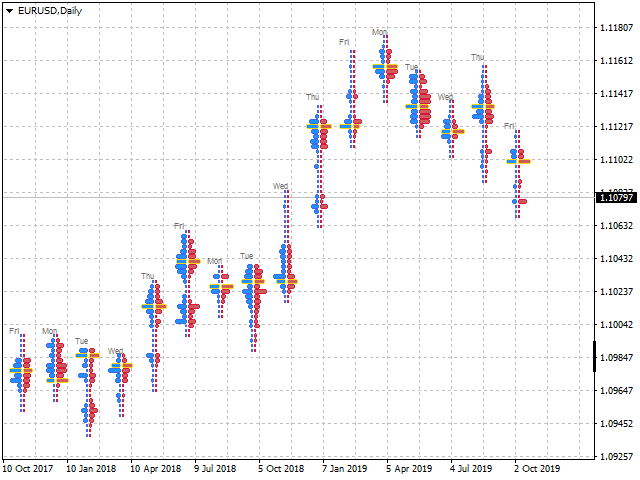
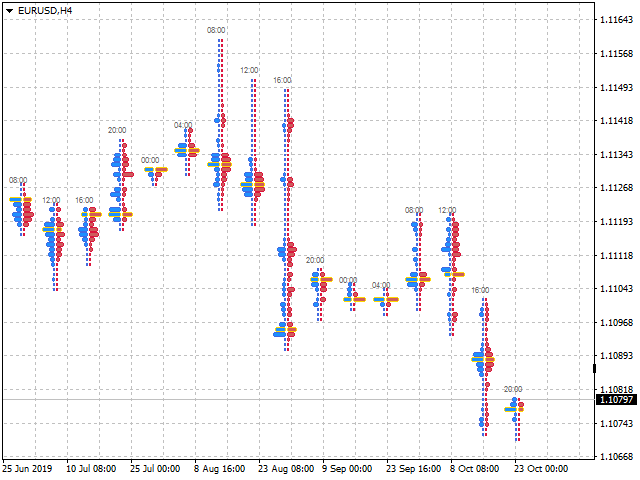
ProfilesVolume - Volumen in Profil-Clustern:
- All - alles Volumen.
- Active - aktives Volumen (das die Preisbewegung verursachte).
ProfilesAsDelta - Differenz zwischen dem Volumen von Käufern und Verkäufern.
ProfilesValueArea - Größe des Profilwertbereichs.
ProfilesValueAreaType - Berechnungsmodus des Wertbereichs:
- OfPocND - Verteilung relativ zur POC-Ebene.
- OfTotalVolume - Verteilung bezogen auf das im Profil gehandelte Volumen.
FramesDelta - Anzeige des aggregierten Deltas für jeden Cluster-Frame.
FramesCompare - normalisiert die visuelle Länge von Clustern relativ zum maximalen Volumencluster im Chartfenster.
SignReverse - Umkehrung des Volumens von Clustern (Käufer als Verkäufer und Verkäufer als Käufer).
VolumeType - Typ der für die Berechnungen verwendeten Volumen:
- Tick - Tick-Volumen.
- Real - reale Volumina (wenn sie von einem Broker übertragen werden).
- Ohne - alternativer Modus, ohne die Volumina.
- TimeAndSales - Band der Geschäfte.
Der Rest der Variablen bezieht sich auf die Farbeinstellungen, und ihr Zweck ist aus ihrem Namen ersichtlich.
Merkmale des Indikators
Während des Betriebs ändert der Indikator die Skalierung des Charts auf der Preisachse und ersetzt auch das Bild des Charts, was dazu führen kann, dass einige andere Indikatoren im Chartfenster nicht richtig funktionieren.
Für Handelssymbole, die eine Tick-Historie ohne den Inhalt des Bandes der Geschäfte haben, wird automatisch ein Interpretationsalgorithmus angewendet:
- Jeder positive Ask-Tick wird als eine Einheit des Kaufvolumens interpretiert.
- Jeder negative Bid-Tick wird als zu verkaufende Volumeneinheit interpretiert.
Dieser Algorithmus funktioniert nur im Modus VolumeType=TimeAndSales und ist hauptsächlich für Währungspaare relevant.
In den Modi Tick, Real und Without funktioniert der Indikator nicht auf dem Zeitrahmen M1.
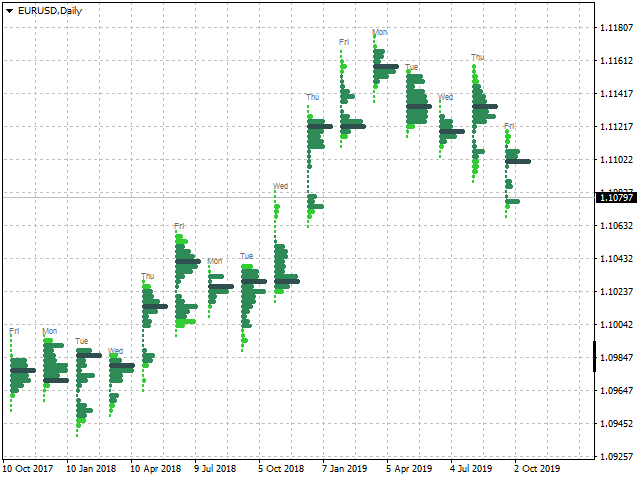
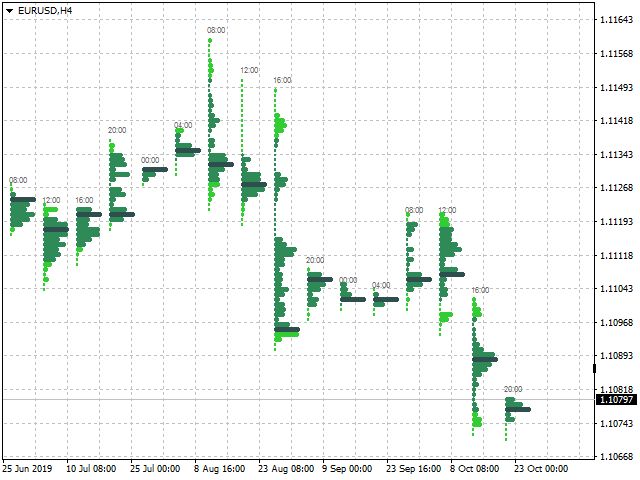


Very well thought and contructed Foot Print Chart for MT5.