SMC setup 1 Double Order Blocks Proof for MT4
- Indikatoren
-
Minh Truong Pham
 Hello, my name is Pham and I am a programmer and trader! At here, I create amazing forex indicators and expert advisors for Metatrader.
I will try:
+ Provide best tools base on my 5 years experience as a trader and 10 years as a programmer. - Version: 1.3
- Aktualisiert: 15 Mai 2024
- Aktivierungen: 8
🔵Einführung
Die Price Action, die als "Smart Money Concept" oder "SMC" bezeichnet wird, wurde im Jahr 2000 von David J. Crouch eingeführt und ist einer der modernsten technischen Stile in der Finanzwelt. Auf den Finanzmärkten bezieht sich "Smart Money" auf Kapital, das von großen Marktteilnehmern (Zentralbanken, Fonds usw.) kontrolliert wird, und diese Händler können Markttrends genau vorhersagen und die höchsten Gewinne erzielen.
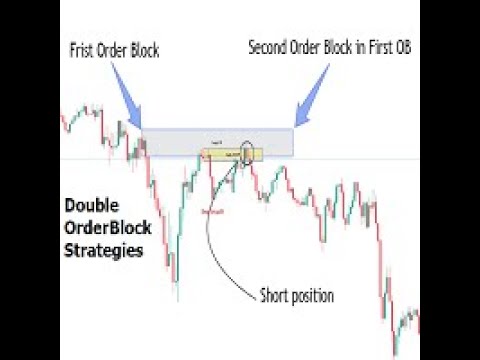
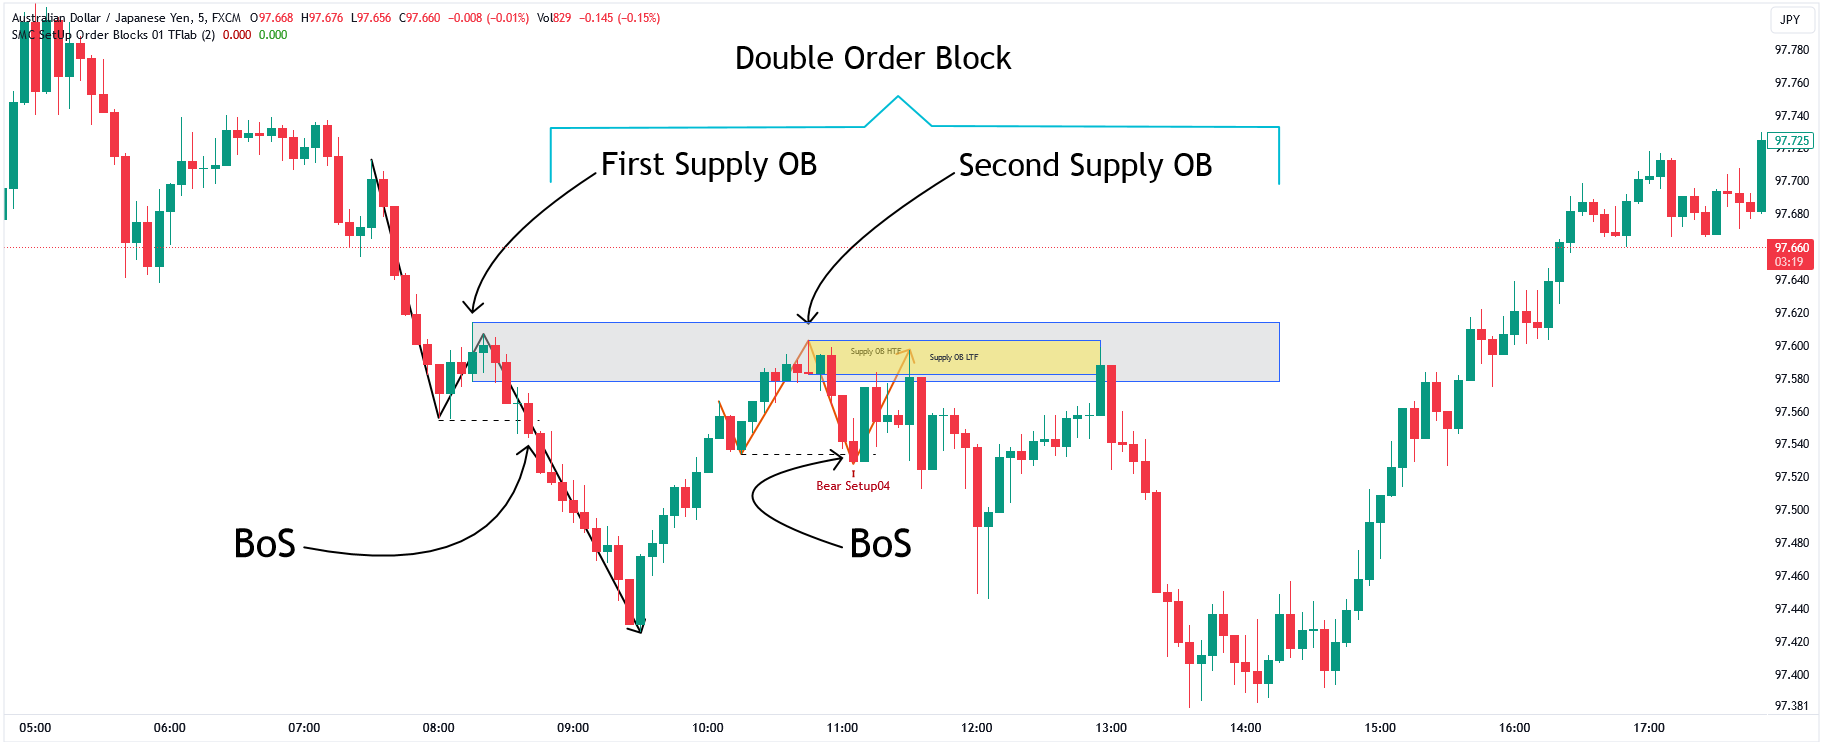
Im "Smart Money"-Stil können verschiedene Arten von "Orderblöcken" gehandelt werden. Dieser Indikator verwendet eine Art von "Orderblock", der von "BoS" (Breakout of Structure) stammt. Das wichtigste Merkmal dieses Indikators ist die Bestätigung von zwei Orderblöcken.
🟣Wichtig
Wenn z.B. nach dem ersten "BoS" und der Bildung des ersten Orderblocks ein zweiter "BoS" auftritt, bevor der Preis des ersten Orderblocks und die Bildung des zweiten Orderblocks berührt werden, wird ein Handelssetup mit 2 Orderblöcken gebildet, das den vorherrschenden Markttrend bestätigt.
Zum besseren Verständnis dieses Themas siehe die Erklärungen in den beiden folgenden Bildern.
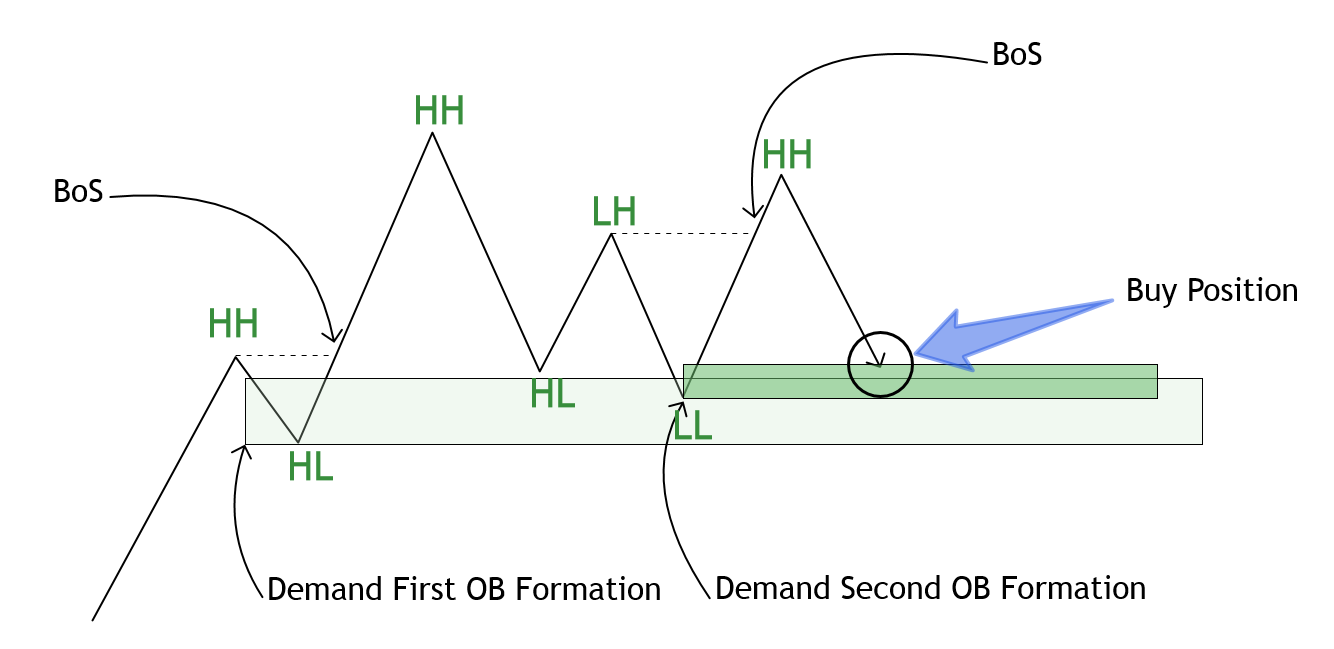
Bullish Setup Details: (Bild 01)
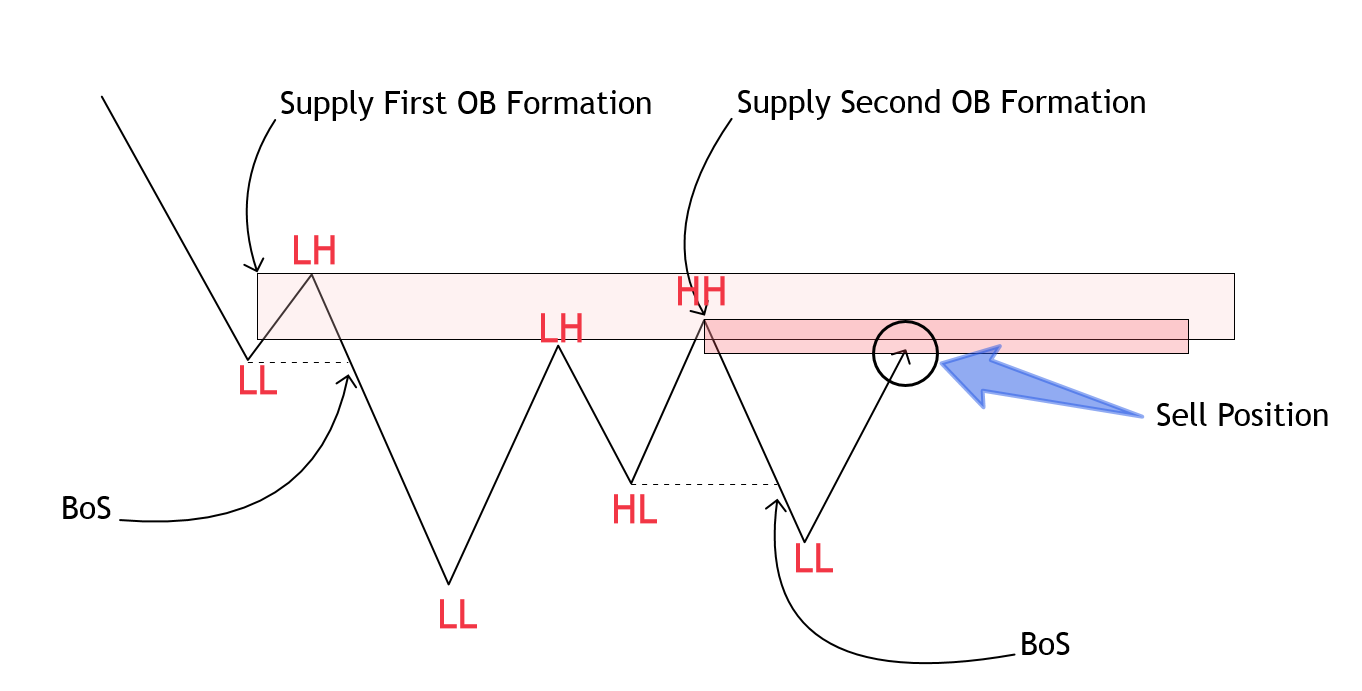
Details zum Bearish-Setup: (Bild 02)
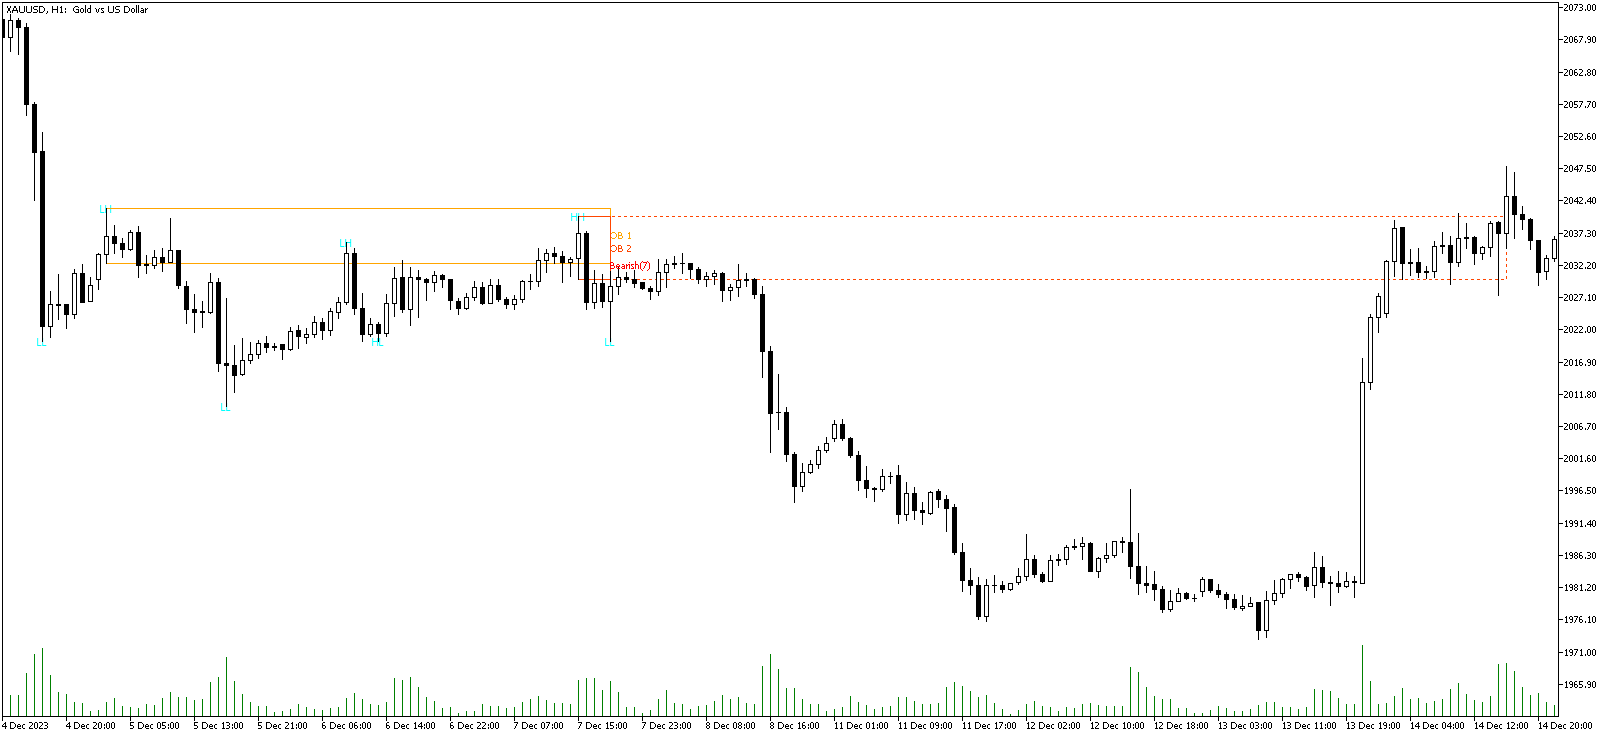
Nachdem Sie den Indikator in den Chart eingefügt haben, sollten Sie die Bildung eines Trading-Setups abwarten. Sie können verschiedene Handelspositionen beobachten, indem Sie den "Time Frame" und die "Pivot Period" ändern. Generell gilt: Je höher der "Time Frame" und die "Pivot Period", desto valider ist das gebildete Setup.
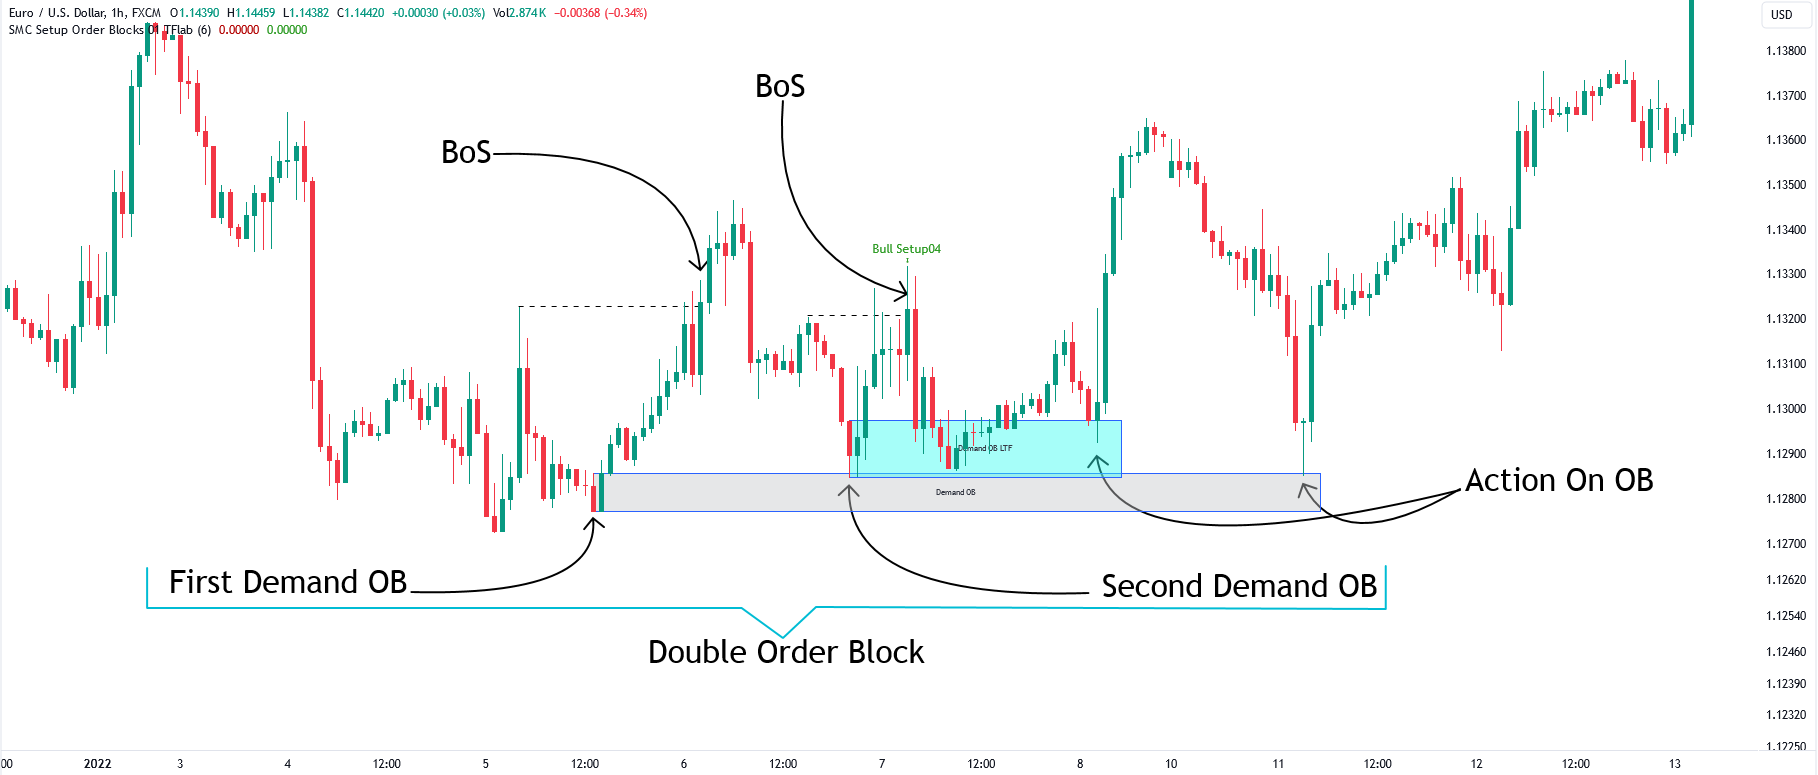
Bullish Setup Details on Chart: (Bild 03)
Details zum Bearish Setup auf dem Chart: (Bild 04)
🔵Einstellungen
- Pivot-Periode: die wichtigste Einstellung, die die Länge des Pivot-Punktes (links und rechts) definiert. Je nach Periode wird ein anderes Modell erkannt.
- Rückblicksnummer: der Verlaufsbalken wird zum Startzeitpunkt berechnet.
- Pivotpunkt anzeigen oder hoch, wenn ein Modell vorhanden ist
- Alarm-Einstellung.
- Präfix: Das Präfix des Objekts, das im Chart angezeigt wird.
Die gemeinsame Schwäche der Indikatoren, die automatisch Muster nach der SMC-Strategie erkennen, ist, dass sie eine feste Länge benötigen, um den Pivot-Punkt zu bestimmen. Bei unterschiedlichen Längenwerten werden "HH", "LL", "LH", "HL" unterschiedlich sein, das strukturell erkannte Modell wird unterschiedlich sein.
Um die oben genannten Schwächen zu überwinden, habe ich das Konzept des Präfixes eingeführt. Mit verschiedenen Präfixen können Benutzer mehrere Indikatoren auf demselben Diagramm anbringen, wobei jeder Indikator für eine andere Pivot-Länge gilt, z. B. 2, 5, 6, 7.... Auf diese Weise ist es möglich, Modelle über alle Marktstrukturen hinweg zu überwachen.
********************************
Häufig gestellte Fragen
Warum wird nichts auf dem Chart angezeigt, wenn ich einen Indikator lade?
https://www.youtube.com/watch?v=hW-KHHvUCWI
Wie baue ich ein Signal-Scan-System mit diesem Indikator auf?