Trendlines with Breaks MT4
- Indikatoren
-
Minh Truong Pham
 Hello, my name is Pham and I am a programmer and trader! At here, I create amazing forex indicators and expert advisors for Metatrader.
I will try:
+ Provide best tools base on my 5 years experience as a trader and 10 years as a programmer. - Version: 1.7
- Aktualisiert: 29 Mai 2025
- Aktivierungen: 5
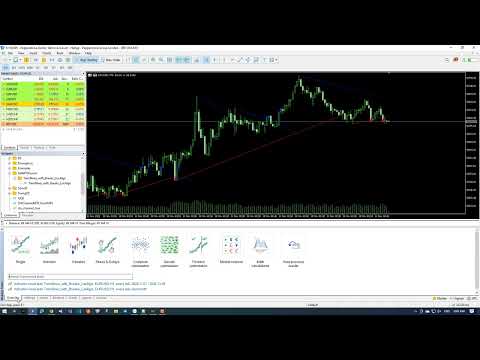
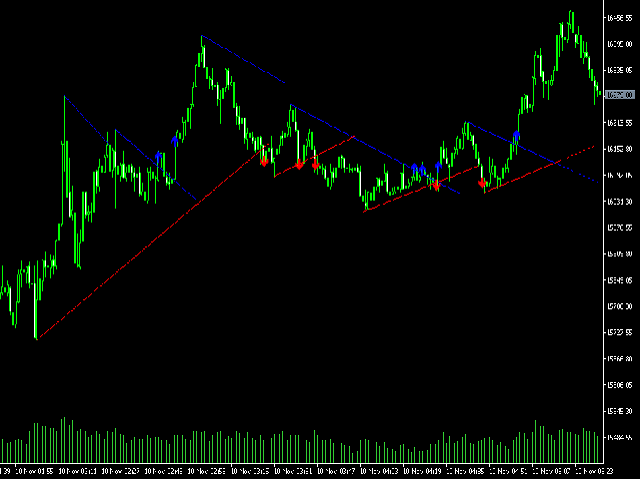
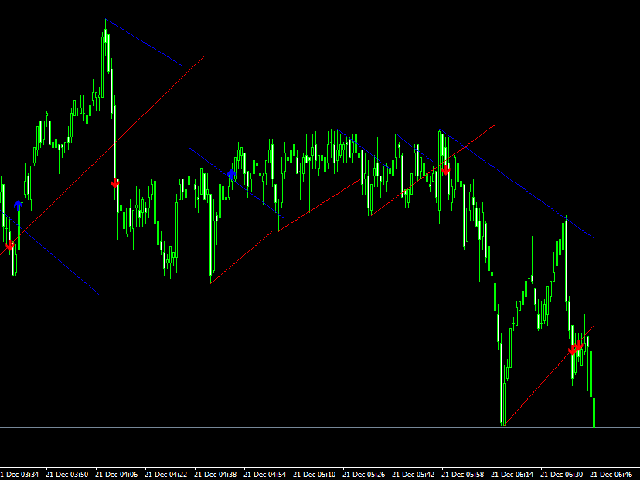
Der Indikatorliefert Pivotpunkt-basierte Trendlinien mit hervorgehobenen Ausbrüchen. Die Trendlinie wird durch den Pivot-Punkt berechnet und andere Anhaltspunkte sind ATR, Stdev.Der Indikator beinhaltet auch integrierte Alarme für Trendlinienausbrüche und die Weiterleitung von Nachrichten an Telegram-Kanäle oder Gruppen, wenn Sie dies wünschen.
Einstellungen
- Rückblick Bar: Standardmäßig 200 ist die Anzahl der Balken, die beim Start des Indikators kalkuliert werden.
-Länge: Zeitraum derPivot-Punkte
-Slope Berechnungsmethode: Legt fest, wie die Steigung berechnet wird. Wir unterstützen jetzt ATR und Stddev.
-Steigung: Steilheit der Steigung, Werte größer als 1 ergeben eine steilere Steigung. Die Verwendung einer Steigung von 0 wäre gleichbedeutend mit dem Erhalt von Niveaus.
- Art der Benachrichtigung : Sie können zwischen Alert und Telegram wählen. Wenn Sie die Nachricht an ein Telegramm weiterleiten möchten, lesen Sie bitte das Ende dieser Anleitung
- Benachrichtigung bei: Sie können wählen, ob Sie einmalig benachrichtigt werden möchten, wenn ein Signal vorliegt, oder ob Sie pro Bar (bei einem neuen Bar) benachrichtigt werden möchten.
Einige andere Einstellungen, wenn Sie das Signal an Telegram weiterleiten
-Telegramm Kanal_id: Telegramm-Kanal-ID oder Gruppen-ID. Verwenden Sie 0, wenn Sie die Nachricht nicht an Telegram weiterleiten möchten.
-Telegram Bot-Token: Telegram-Bot-Token. Leer, wenn die Nachricht nicht weitergeleitet werden soll.
-Telegram Nachrichtenvorlage: Vorlage der Nachricht, die an Telegram gesendet wird.
Erläuterung
Der IndikatorTrendlinien mit Brüchen verwendet den Pivot-Punkt (Pivot-Punkt ist der höchste oder niedrigste Punkt im Bereich (x-Länge, x+Länge) als Basis, die zusätzlich die Berechnung der Steigung der Trendlinie durch eine der folgenden Methoden:
ATR : berechnet mit Periode =Länge.Die Average True Range (ATR) ist ein Volatilitätsindikator, der anzeigt, wie stark sich ein Vermögenswert im Durchschnitt während eines bestimmten Zeitrahmens bewegt. Dieser zuverlässige Indikator kann zur Vorhersage der nächsten Kursentwicklung verwendet werden.
Stdev : Der Standardabweichungsindikator misst die Marktvolatilität und wird in der Statistik verwendet, um die Variabilität oder Streuung einer Datenmenge um den Durchschnitt zu beschreiben. Dieser Indikator kann das Marktverhalten vorhersagen und damit die nächste Volumenzahl und die nachfolgenden Preisaktivitäten vorhersagen.
Verwendung
Die Berechnungsmethode der Steigung hat einen großen Einfluss auf das Verhalten der Trendlinie. Standardmäßig wird ein durchschnittlicher wahrer Bereich verwendet, der eine einheitliche Neigung der Trendlinien ergibt . Andere Methoden können Trendlinien mit deutlich abweichenden Steigungen liefern .Stdev verwendet die Standardabweichung für die Berechnung der Steigung.
Konfigurieren Sie Benachrichtigungen über Telegramm
Unsere Lösung besteht darin, einen Dienst zu erstellen, der im Hintergrund läuft und Nachrichten vom Indikator an Telegram weiterleitet. Dies ist in meinem kostenlosenDienst (Telegram helper for indicator)
Nachdem Sie das Tool heruntergeladen haben, folgen Sie diesen Schritten:
1. kopieren Sie das Tool in den "Service"-Ordner von MT5, so wie Sie den Indikator in den "Indikatoren"-Ordner kopieren
2. konfigurieren Sie den Indikator in folgenden Schritten:
In der Gruppe Benachrichtigung konfigurieren
Telegram-Kanal-ID: Geben Sie IhreKanal-ID-Nummer ein
Telegram bot token: Geben Sie Ihren Telegram bot_token ein
Datei .txt write msg: Geben Sie einen beliebigen Dateinamen ein, der mit der Erweiterung. txt endet. Wenn Sie andere unserer Indikatoren verwenden,geben Sie diesen Dateinamen bittefür jeden Indikator anders ein. Konfigurieren Sie den Dienst wie folgt:
In Input "files (with .txt ext) separate by | character": geben Sie den Dateinamen [file_name].txt ein. Wenn Sie einen anderen unserer Indikatoren verwenden, geben Sie bitte [ file_name].txt getrennt durch Zeichen | ein.Zum Beispiel:trendline.txt|swingzz.txt bedeutet, dass Sie meine 2 Indikatoren verwenden: trendline mit break và swingzz und Sie konfigurieren diese beiden IndikatorenBenachrichtigung durch Telegramm. Schließlich, bitte denken Sie daran, dass der Dienst nur läuft, wenn Sie es einschalten. Dann wird ein blaues Symbol erscheinen
Der Benutzer hat keinen Kommentar hinterlassen