Real SMC same with Lux method
- Indikatoren
-
Minh Truong Pham
 Hello, my name is Pham and I am a programmer and trader! At here, I create amazing forex indicators and expert advisors for Metatrader.
I will try:
+ Provide best tools base on my 5 years experience as a trader and 10 years as a programmer. - Version: 2.2
- Aktualisiert: 10 April 2024
- Aktivierungen: 5
Dieser All-in-One-Indikator zeigt die Marktstruktur in Echtzeit an (interne & Swing BOS / CHoCH), Orderblöcke, Premium- & Discount-Zonen, gleiche Hochs & Tiefs und vieles mehr... und ermöglicht Händlern, ihre Charts automatisch mit weit verbreiteten Preisaktionsmethoden zu markieren. Nach der Veröffentlichung unseres Fair Value Gap-Skripts erhielten wir zahlreiche Anfragen aus unserer Community, weitere Funktionen in derselben Kategorie zu veröffentlichen.
//------------------------------------//
In der Version 1.x fehlen folgende Funktionen
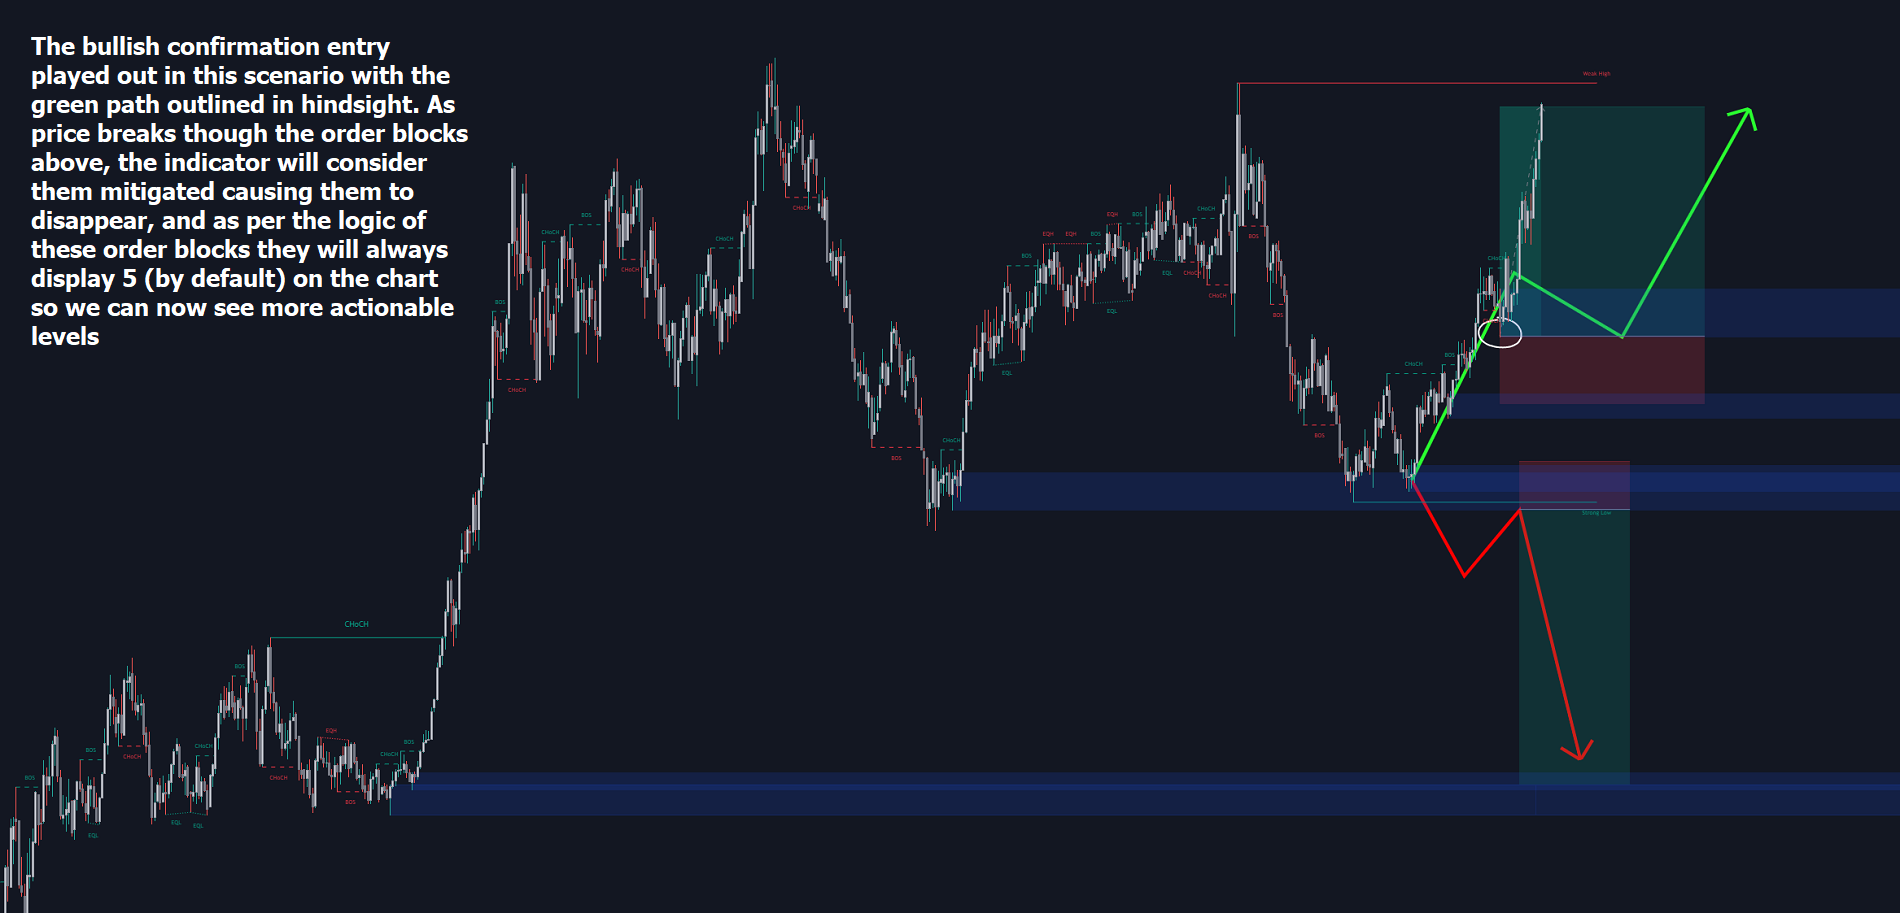
+ PDArray-Verfolgung (erstellt, gemildert, gefüllt)
+ Informationen über Premium, Discount PDArray
+ Einstellung für Benachrichtigungen und verschiedene Benachrichtigungsmethoden
Daher habe ich die Version 2.x aktualisiert und diese Funktionen hinzugefügt:
1. Option hinzufügen, um die letzte Leiste zu erweitern
2. Gültige OB auf aktuell erweitern; Stil und Anzeigename der OB (in den Einstellungen); Premium/Discount OB nach Schwunglänge trennen
3. Gültige FVG auf den aktuellen Stand verlängern; Stil und Anzeigename der FVG (in den Einstellungen); Premium/Discount FVG nach Swing-Länge trennen
4. Erweitern Sie PMhl, PWhl, PDhl bis zum aktuellen Wert;
5. Alarmeinstellungen hinzufügen
//------------------------------------//
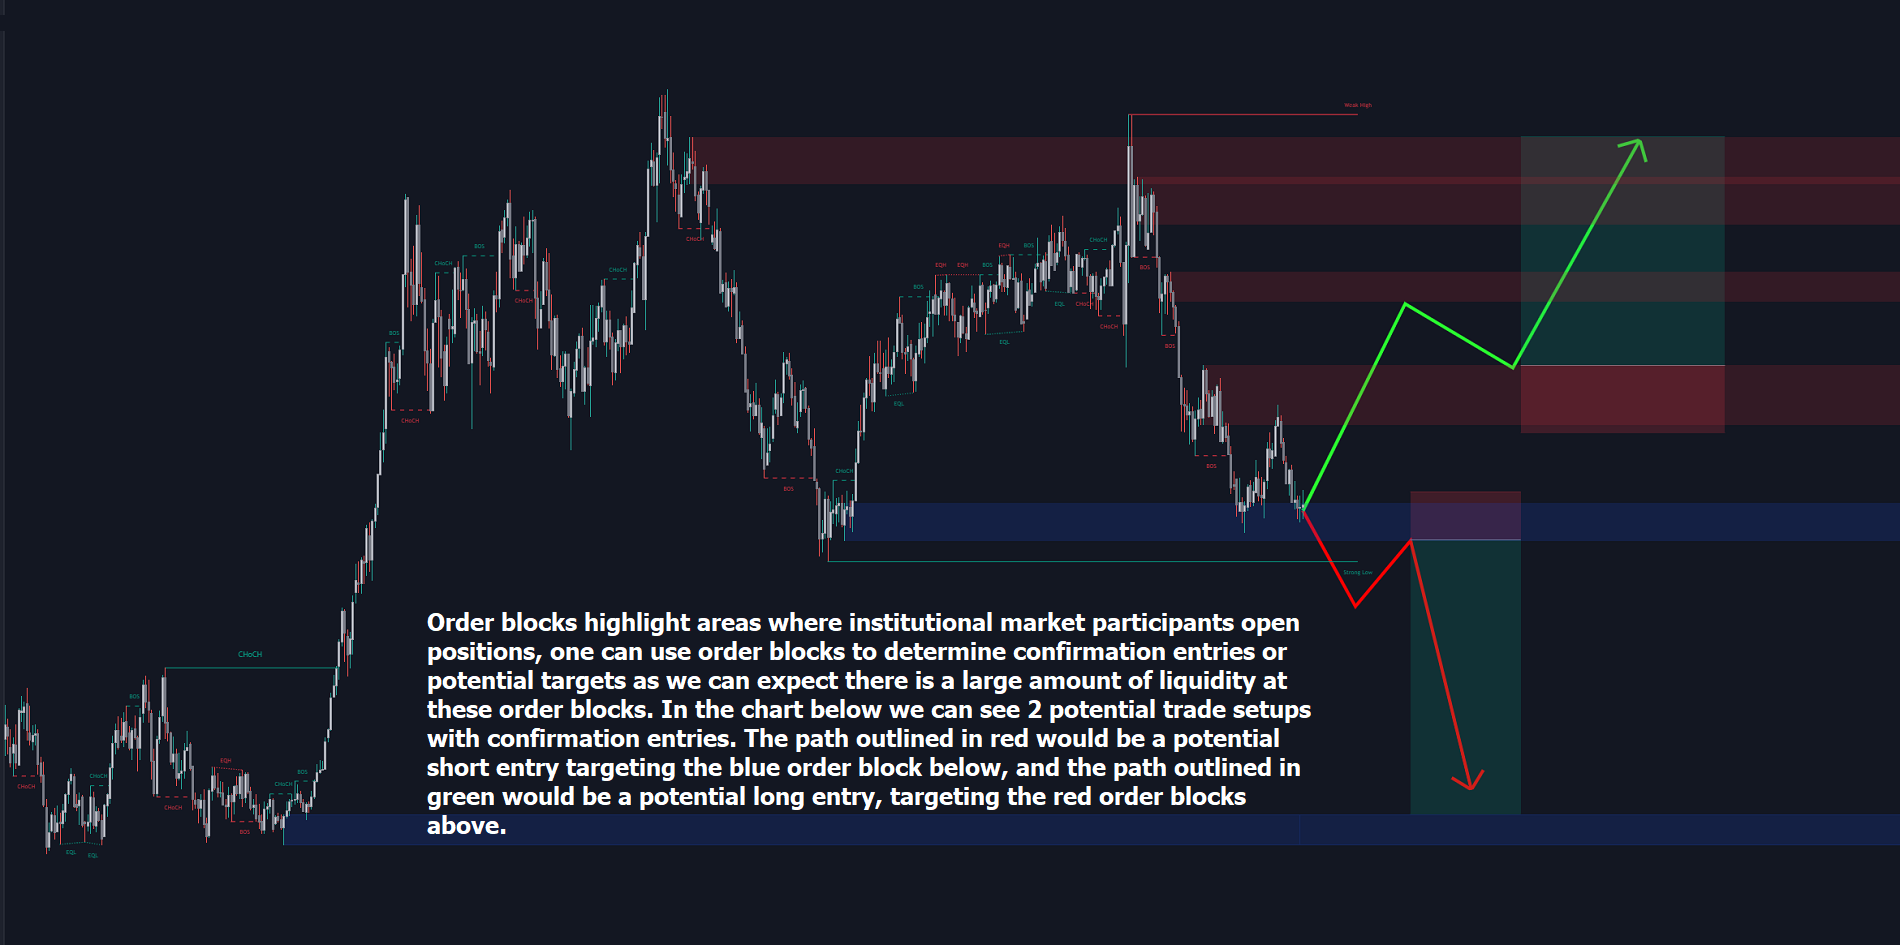
"Smart Money Concepts" (SMC) ist ein relativ neuer, aber dennoch weit verbreiteter Begriff unter Preisaktionshändlern, die eine genauere Navigation durch die Liquidität und das Auffinden optimaler Punkte von Interesse im Markt anstreben. Der Versuch, herauszufinden, wo institutionelle Marktteilnehmer Aufträge platziert haben (Liquidität auf der Kauf- oder Verkaufsseite), kann ein sehr sinnvoller Ansatz sein, um auf der Grundlage der Preisentwicklung praktischere Ein- und Ausstiegspunkte zu finden.
Der Indikator enthält Warnungen für das Vorhandensein von Swing-Strukturen und viele andere relevante Bedingungen.
Funktionen
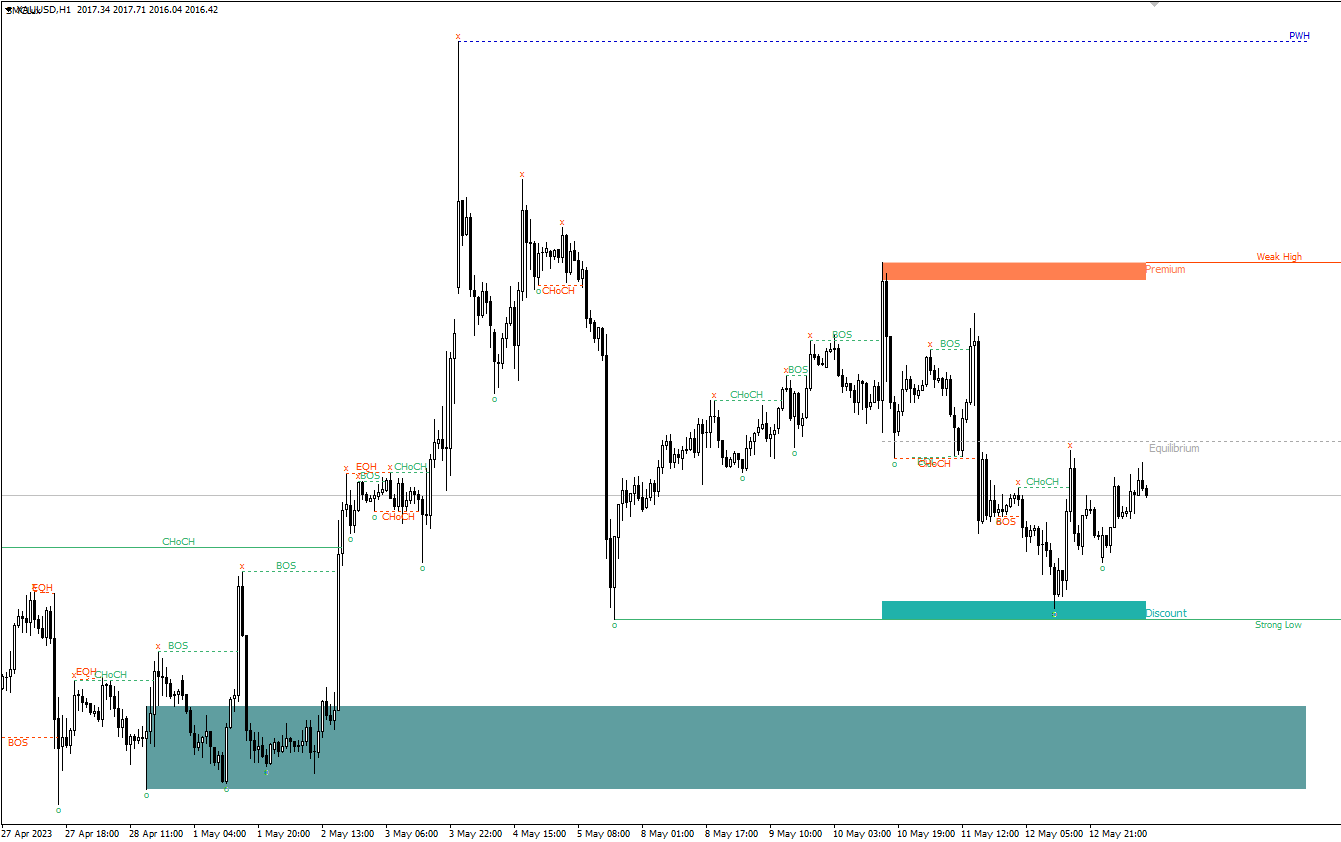
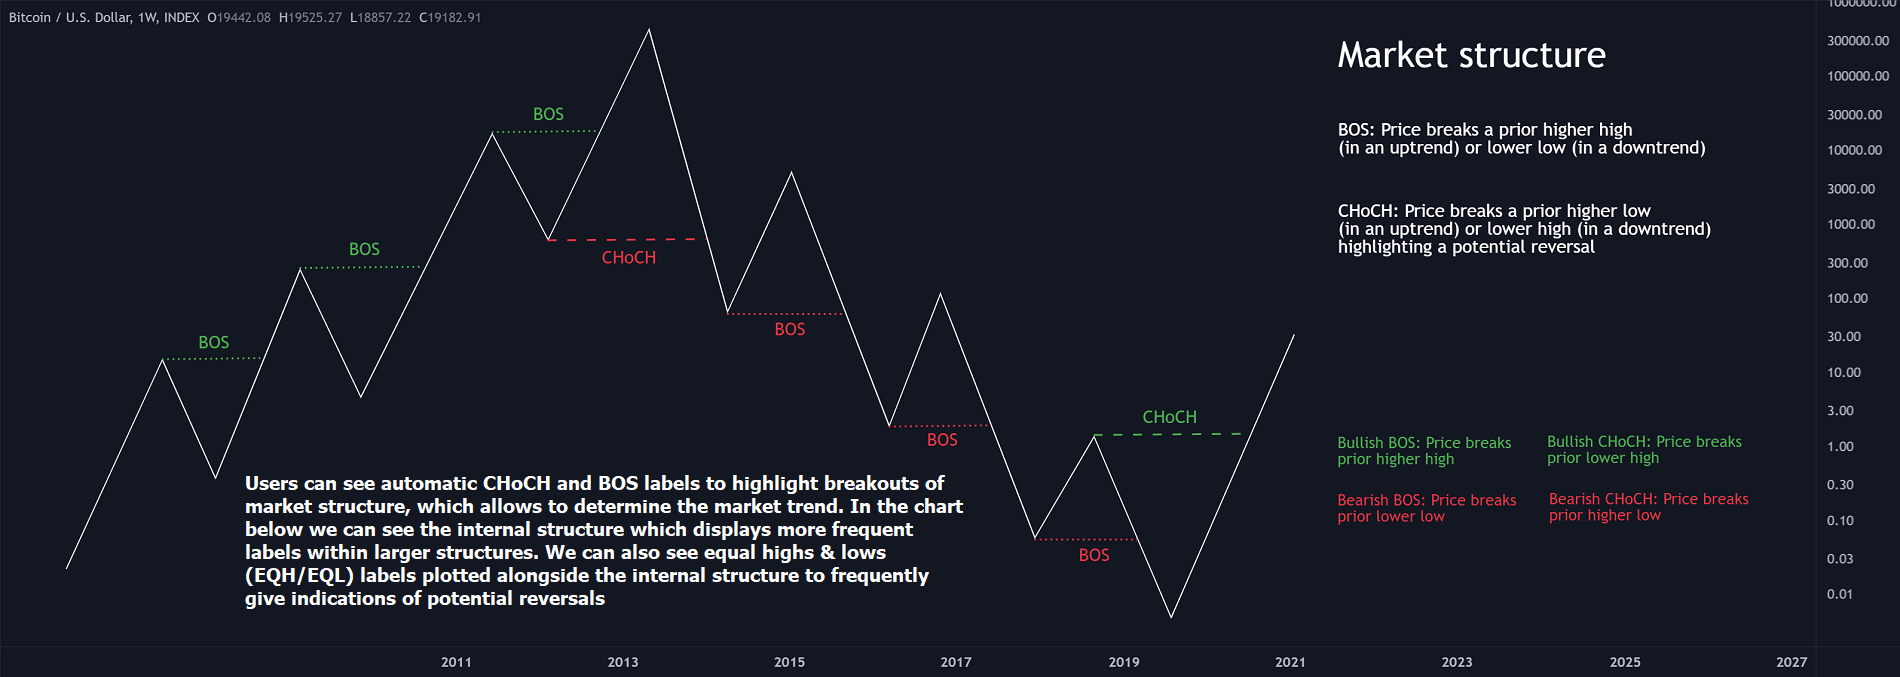
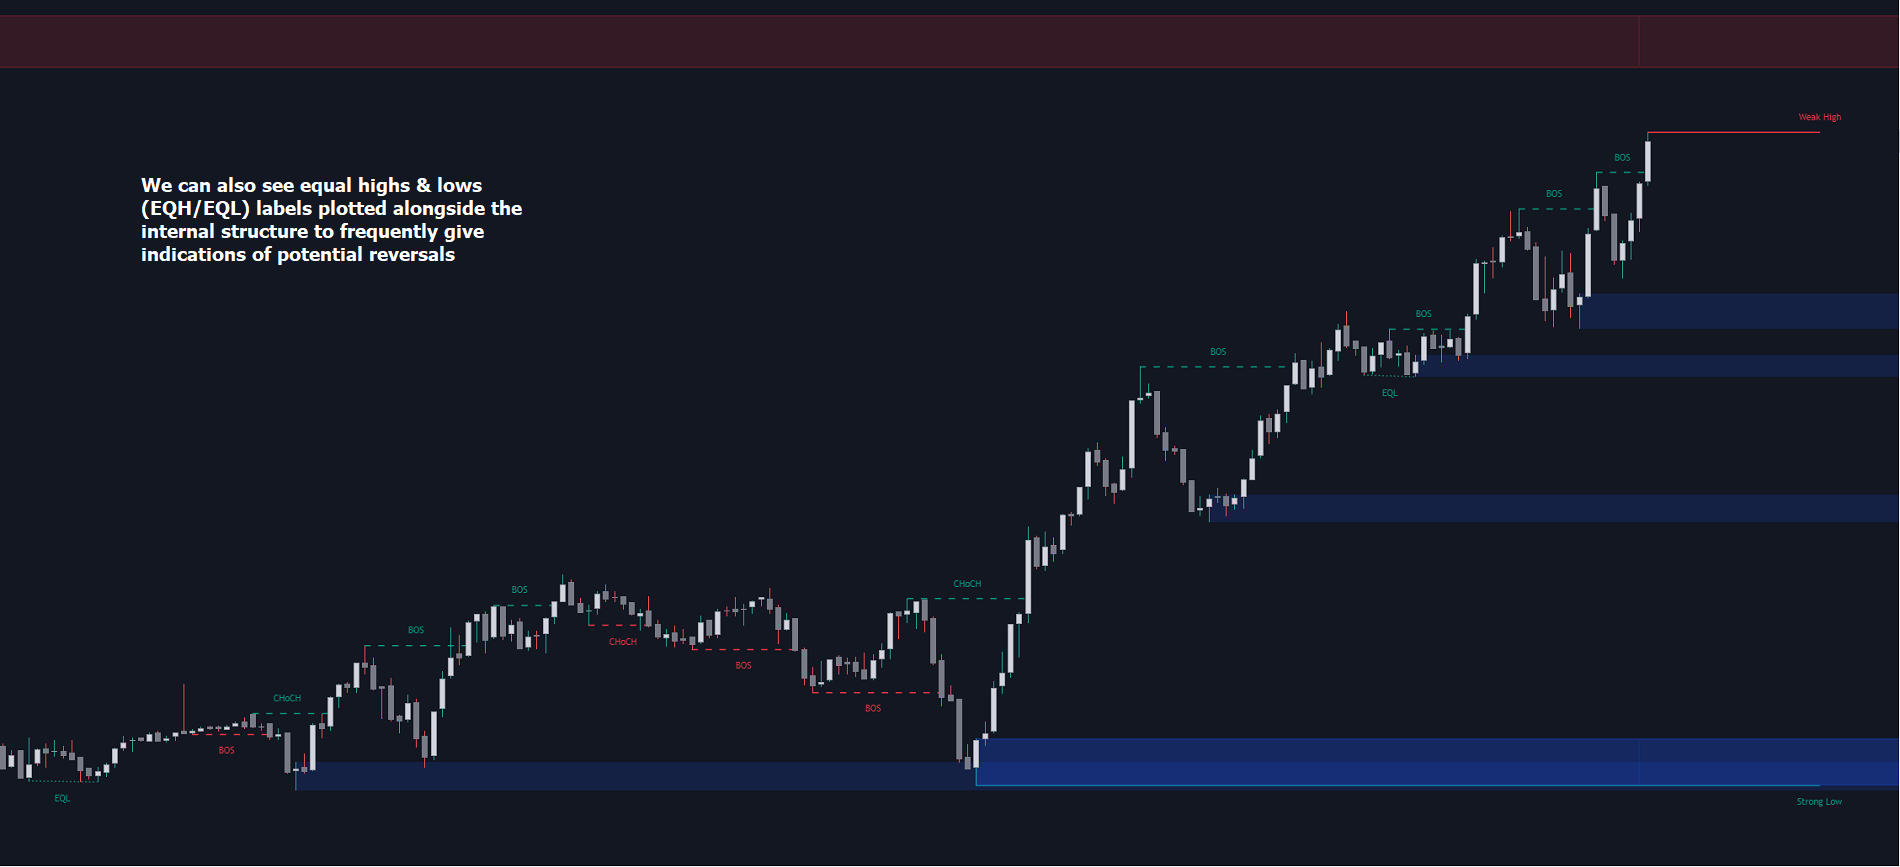
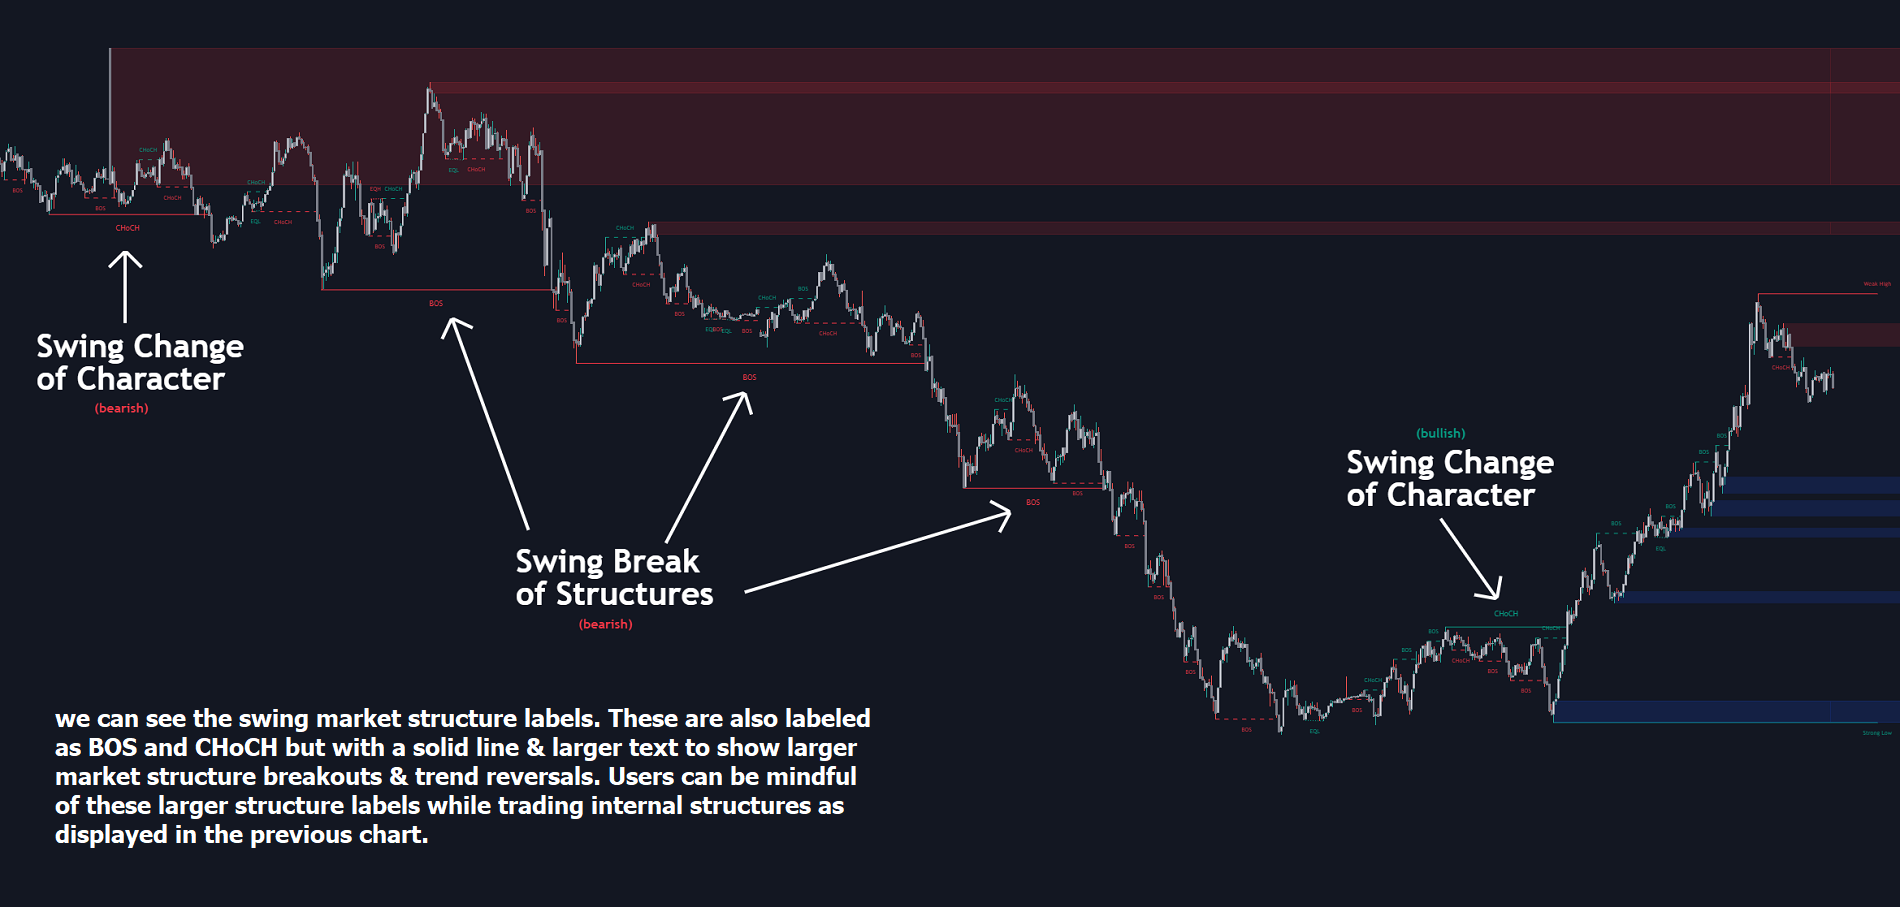
- Vollständige Kennzeichnung von internen und Swing-Marktstrukturen in Echtzeit
- Bruch der Struktur (BOS)
- Änderung des Charakters (CHoCH)
- Orderblöcke (bullish & bearish)
- Gleiche Hochs und Tiefs
- Fair Value Gap-Erkennung
- Frühere Hochs & Tiefs
- Premium- und Discount-Zonen als Bereich
- Optionen zur Gestaltung des Indikators, um diese Konzepte einfacher darzustellen
- Modus: Ermöglicht dem Benutzer die Auswahl zwischen Historisch (Standard) und Aktuell, wobei nur die jüngsten Daten im Diagramm angezeigt werden.
- Stil: Ermöglicht es dem Benutzer, für den gesamten Indikator ein anderes Styling zwischen Farbig (Standard) und Einfarbig zu wählen.
- Interne Struktur: Zeigt die Bezeichnungen der internen Struktur und die gestrichelten Linien zu ihrer Darstellung an. (BOS & CHoCH).
- Zusammenfluss-Filter: Filtert nicht signifikante Ausbrüche der internen Struktur.
- Swing-Struktur: Zeigt die Swing-Strukturbezeichnungen und durchgezogene Linien auf dem Chart an (größere BOS- und CHoCH-Bezeichnungen).
- Schwingungspunkte: Zeigt die Kennzeichnungen der Swing-Punkte auf dem Chart an, z. B. HH, HL, LH, LL.
- Interne Orderblöcke: Aktiviert Interne Orderblöcke und ermöglicht dem Benutzer auszuwählen, wie viele der letzten Internen Orderblöcke im Chart angezeigt werden.
- Swing-Order-Blöcke: Aktiviert Swing Order Blocks und ermöglicht es dem Benutzer auszuwählen, wie viele der letzten Swing Order Blocks auf dem Chart angezeigt werden.
- Gleiche Hochs und Tiefs: Zeigt EQH/EQL-Etiketten im Chart an, um gleiche Hochs und Tiefs zu erkennen.
- Balken-Bestätigung: Ermöglicht es dem Benutzer auszuwählen, wie viele Bars benötigt werden, um ein EQH/EQL-Symbol im Chart zu bestätigen.
- Fair Value Lücken: Zeigt Kästchen zur Hervorhebung von Ungleichgewichtsbereichen auf dem Chart an.
- Automatischer Schwellenwert: Filtert nicht signifikante Fair Value Gaps heraus.
- Zeitrahmen: Ermöglicht dem Benutzer die Auswahl des Zeitrahmens für die Fair Value Gap-Erkennung.
- FVG erweitern: Ermöglicht es dem Benutzer auszuwählen, um wie viele Balken die Fair Value Gap-Boxen auf dem Diagramm erweitert werden sollen.
- Highs & Lows MTF: Ermöglicht es dem Benutzer, frühere Höchst- und Tiefstwerte aus dem täglichen, wöchentlichen und monatlichen Zeitrahmen als signifikante Niveaus anzuzeigen.
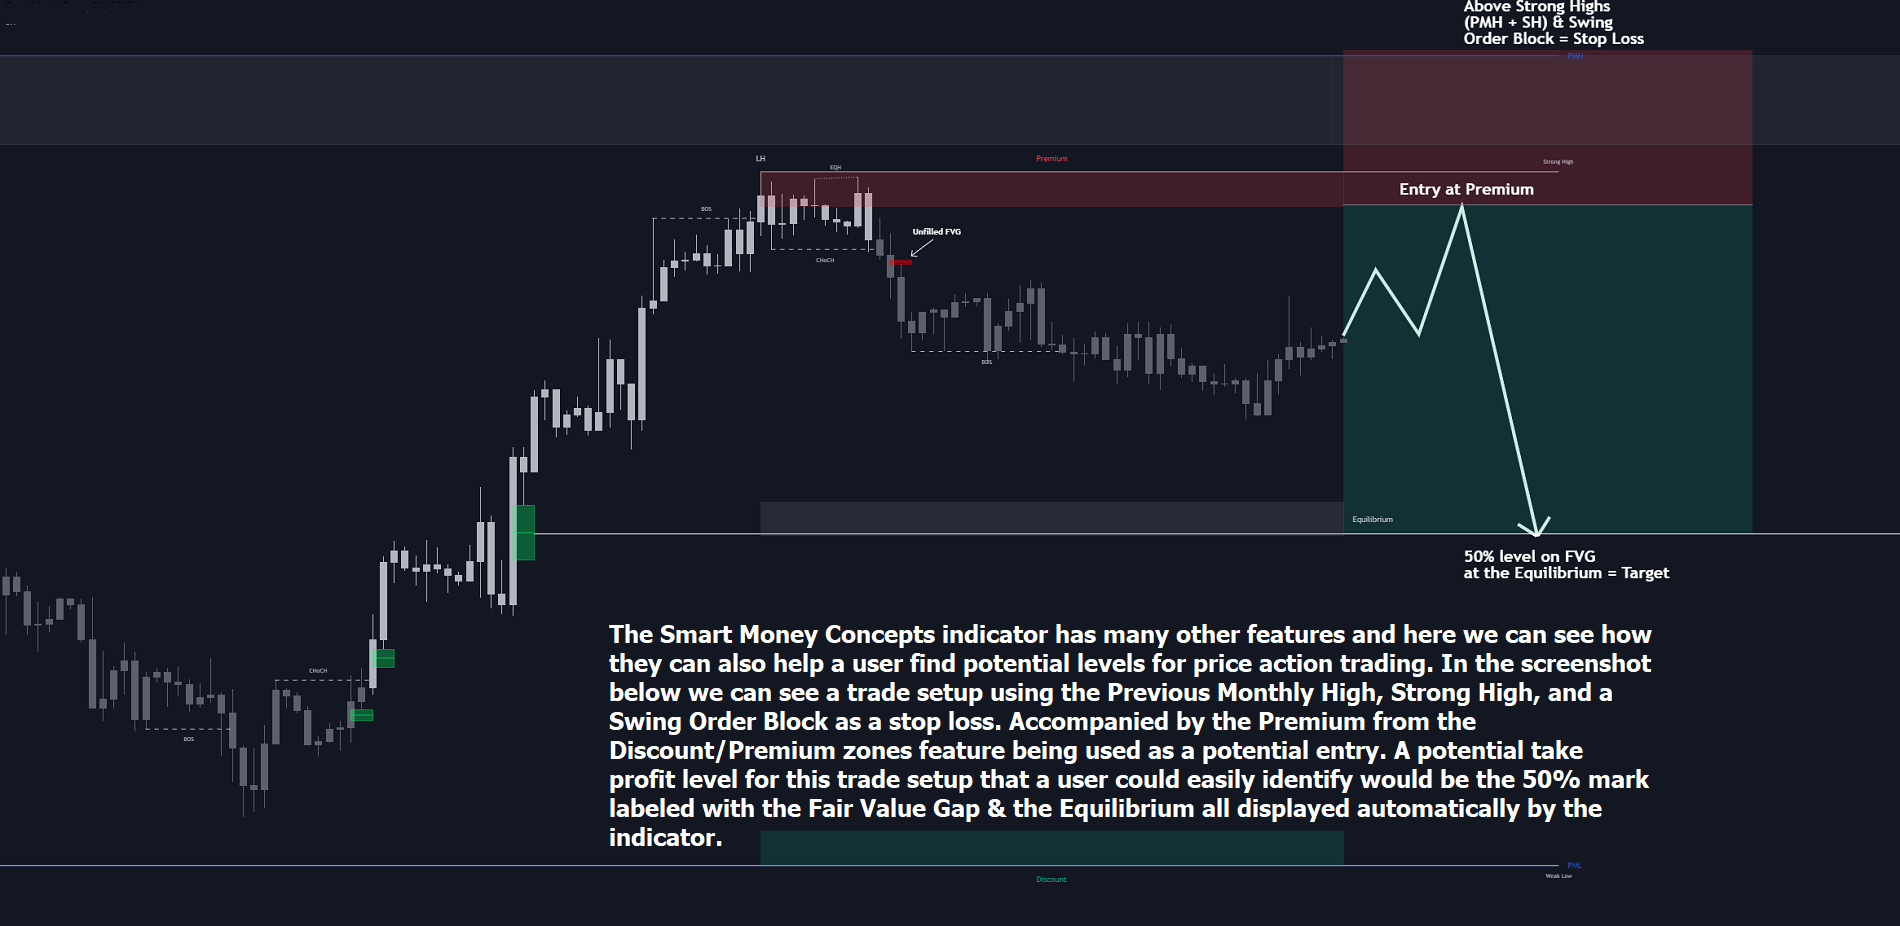
- Premium/Discount-Zonen: Ermöglicht dem Benutzer die Anzeige von Premium-, Discount- und Equilibrium-Zonen auf dem Diagramm.
Verwendung (siehe Bilder)
SchlussfolgerungDieser Indikator hebt alle relevanten Komponenten des Smart-Money-Konzepts hervor, das eine sehr nützliche Interpretation der Marktstruktur, der Liquidität und, einfacher ausgedrückt, der Preisaktion sein kann. Der Begriff wurde vor allem in der Forex-Gemeinschaft und durch ICT geprägt und populär gemacht, während er sich seinen Weg in die Analyse vieler Händler bahnte. Diese Konzepte, mit oder ohne diesen Indikator, garantieren einem Händler nicht, dass er mit institutioneller oder "bankenmäßiger" Liquidität handelt, es gibt keine unterstützenden Daten bezüglich der Gültigkeit dieser Lehren.
Good implementation of the Lux method. Is there a possibility to turn on and off alerts (push, email, MT4)? Please add this feature. [edit: notification options implemented a day later, thanks!]