SV Divergence All with confirm
- Indikatoren
-
Minh Truong Pham
 Hello, my name is Pham and I am a programmer and trader! At here, I create amazing forex indicators and expert advisors for Metatrader.
I will try:
+ Provide best tools base on my 5 years experience as a trader and 10 years as a programmer. - Version: 1.2
- Aktualisiert: 9 März 2023
- Aktivierungen: 5
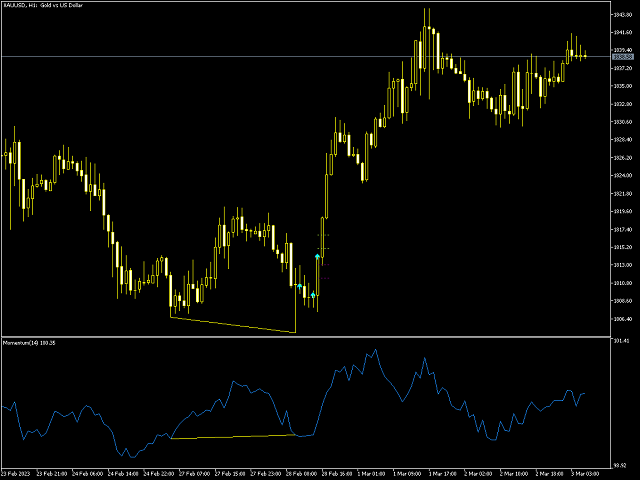
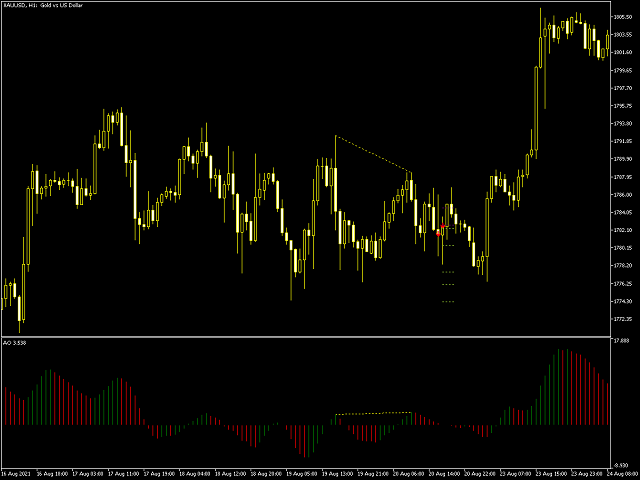
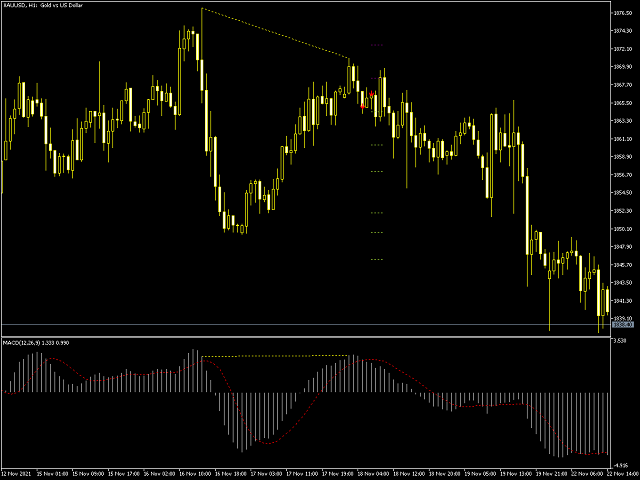
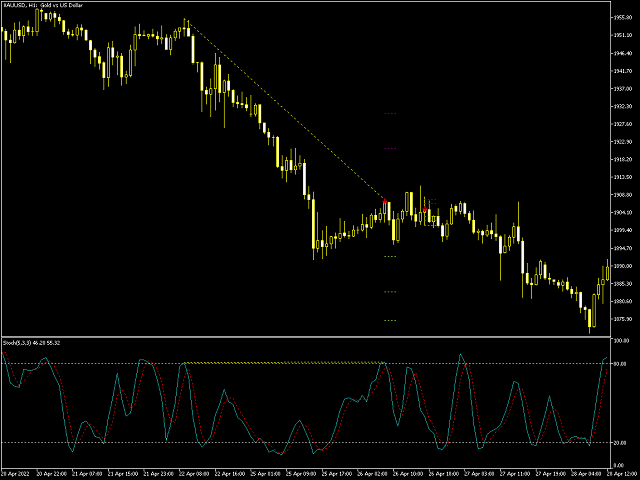
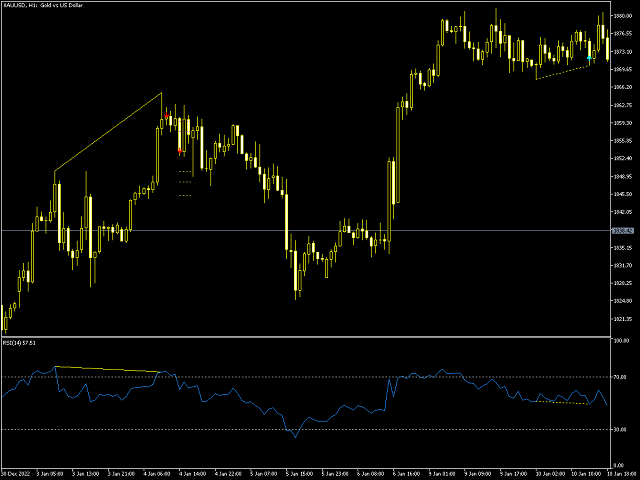
Detect Divergenz (klassisch, versteckt) Preis und alle Oszillator-Indikator gehören: RSI, CCI, MACD, OSMA, Stochastic, Momentum, Awesome Oscillator (AO), Accelerator Oscillator (AC), Williams Percent Range (WPR), Relative Vigor Index (RVI), Rate of Change (ROC). Bestätigen Sie die Umkehrung mit dochianischen Kanälen, um die Signalqualität zu verbessern.
Von einer Divergenz spricht man, wenn sich der Kurs eines Vermögenswerts in die entgegengesetzte Richtung eines technischen Indikators (z. B. eines Oszillators) oder entgegengesetzt zu anderen Daten bewegt. Eine Divergenz weist darauf hin, dass sich der aktuelle Preistrend abschwächt, und kann in einigen Fällen zu einer Richtungsänderung des Preises führen. Bei der Bestimmung der Divergenzgibt es einige Regeln :
+ Der Preis muss an den definierten Punkten der Divergenz einen Extrempunkt erreichen. Der Extrempunkt kann HH, LL für klassische Divergenz und LH, LH für versteckte Divergenz sein.
+ Die Steigung des Preises und des Oszillators müssen in entgegengesetzter Richtung verlaufen.
Dieser Indikator scannt Divergenz und Konvergenz sowohl in der versteckten als auch in der klassischen Phase von Preis und gemeinsamen Oszillator. Sie können einen der Oszillatoren in den Einstellungen des Indikators auswählen . Wenn eine Divergenz auftritt, wird der Indikator den Benutzer warnen. Im Bereich von 10 (Einstellung) Kerzen nach Divergenz passieren, wenn der Preis von Dochian Kanal bestätigen, wird Indikator Signal kaufen oder verkaufen und noti an den Benutzer auslösen. Auf diese Weise, kaufen oder verkaufen Signal bekam beste Genauigkeit!
Einige Vorteile:
- Einfach zu handeln
- Findet regelmäßige und versteckte Divergenzen
- Unterstützt viele bekannte Oszillatoren
- Implementiert Handelssignale basierend auf Ausbrüchen
- Zeigt geeignete Stop-Loss- und Take-Profit-Levels an
- Konfigurierbare Oszillator-Parameter
- Anpassbare Farben und Größen
- Filterbereich von Divergenzen bis hin zu Preisumkehrbestätigungen
- Es implementiert Benachrichtigungen in vielerlei Hinsicht: MT5 Terminator, MT5 Mobile App, Alert, Telegram
Um eine breite Marktperspektive zu bieten, kann der Indikator viele Male im gleichen Chart mit verschiedenen Oszillatoren geladen werden, ohne dass es zu Störungen kommt. Der Indikator unterstützt die folgenden Oszillatoren:
- RSI
- CCI
- MACD
- OSMA
- Stochastik
- Momentum
- Awesome Oszillator
- Accelerator Oszillator
- Williams Percent Range
- Relativer Vigor-Index
- Rate der Veränderung
Hinweis:
Dieser Indikator wird überhaupt nicht neu gezeichnet. Das Divergenzsignal wird bei seinem ersten Auftreten gezeichnet. Wenn sich der Preis in der gleichen oder der nächsten Kerze ändert, ändert sich der Divergenzpunkt oder verschwindet, aber der Indikator malt das Signal nicht neu (Auslösung beim ersten Mal).
Der Benutzer kann viele Indikatoren im gleichen Chart laden. Jeder von ihnen kümmert sich um eine Art von Oszillator.
Eingabe-Parameter
- Amplitude: Zick-Zack-Periode, um Divergenzen zu finden
- Oszillator - Wählen Sie den Oszillator, der in das Diagramm geladen werden soll.
- Ausbruchsperiode - Ausbruchsperiode in Takten für die Handelssignale.
- Divergenztypen - Aktivieren oder deaktivieren Sie die Divergenztypen: versteckt, regelmäßig oder beides.
- Maximale Anzahl von Balken ab einer Divergenz zur Bestätigung.
- Indikatoreinstellungen - Gewünschte Indikatoreinstellungen für alle beteiligten Oszillatoren.
- RSI-Zeitraum
- CCI-Zeitraum
- WPR-Zeitraum
- Momentum-Zeitraum
- Stochastik-Perioden
- MACD-Einstellungen
- RVI-Zeitraum
- ROC-Zeitraum
- Zeichnungseinstellungen - Wählen Sie Farben und Liniengrößen für die Divergenzen.
- Alarme - Aktivieren oder deaktivieren Sie Alarme auf verschiedene Weise.