Bulls and Bears Power MT5
- Indikatoren
-
Diego Arribas Lopez
 You've been burned before. That's why you're reading this.
You bought an EA with a perfect backtest. It collapsed in two weeks live. You tried another one — same story. Maybe you've done this five times already. You're not stupid. You were just shopping in a market full of smoke. - Version: 1.0
- Aktivierungen: 5
Bullen und Bären Macht
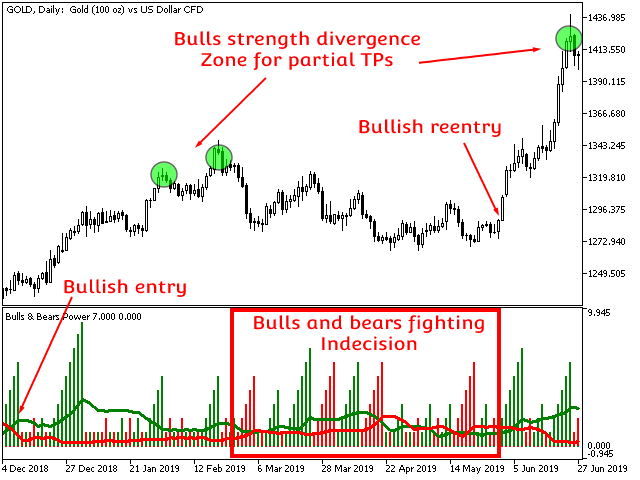
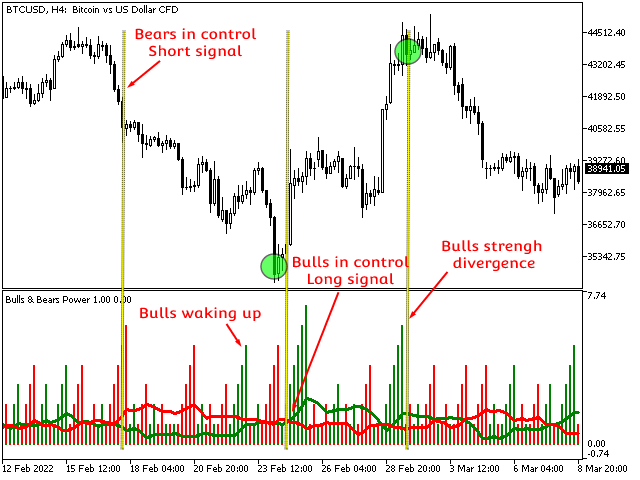
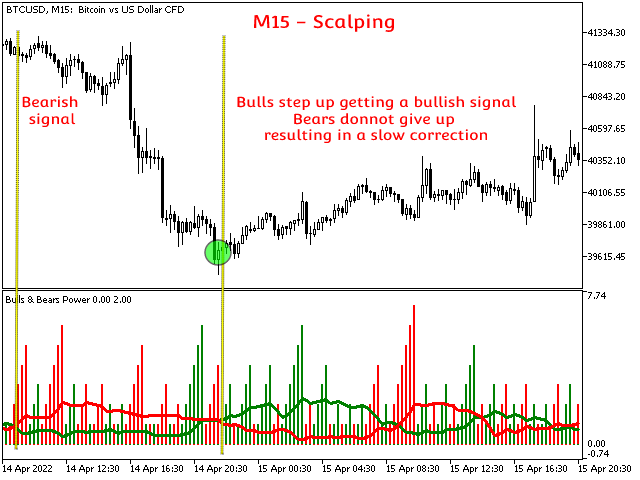
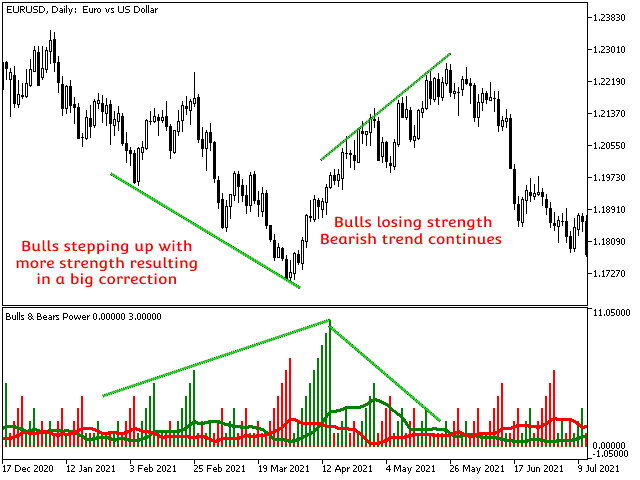
Bulls and Bears Power ist ein Indikator, der deutlich aufzeigt, ob Bullen oder Bären den Markt derzeit kontrollieren. Eine Kursbewegung, die mit einer hohen Bullen-Kontrolle auf dem Markt beginnt, kann den Beginn einer neuen Trendbewegung anzeigen. Die relative Indikatorstärke zwischen den Preisspitzen zeigt auch an, ob die Bewegung an Stärke verliert und eine signifikante Korrektur oder eine Trendumkehr vorhersagen könnte. Der Bulls and Bears Power Indikator bietet eine klare und vereinfachte Sicht auf die aktuelle Marktsituation. Darüber hinaus werden die Ergebnisse des Algorithmus mit Hilfe des einfachen gleitenden Durchschnitts und seiner Standardabweichung gefiltert, um Einstiegspunkte vorzuschlagen, die die nächste expansive Kursbewegung vorwegnehmen.
Die Divergenzen zwischen dem Preis und dem Indikator, seinen gleitenden Durchschnitten und seiner Standardabweichung ermöglichen es dem Benutzer auch, wesentliche Informationen zu extrahieren, um Ihr Trading auf eine Trendfortsetzung oder -umkehr einzustellen.
Einige der Eigenschaften des Indikators sind die folgenden
- Zeitersparnis
- Keine Verzögerung
- Klare und vereinfachte Darstellung der wesentlichen Informationen
- Funktioniert bei allen Paaren (Kryptowährungen, Devisen, Aktien, Indizes, Rohstoffe...)
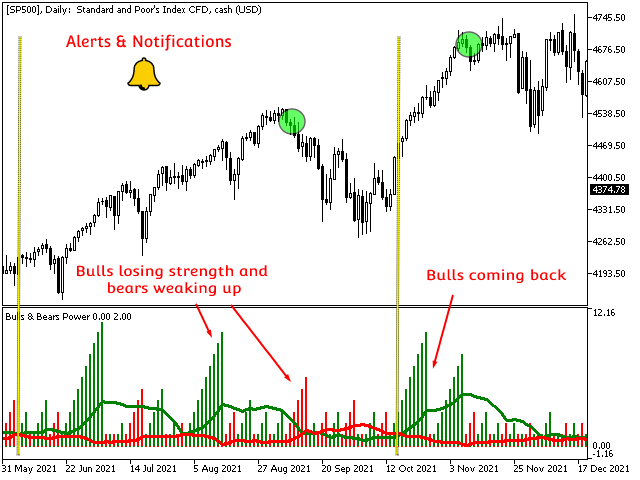
- Zeigt an, wenn Bullen oder Bären an Stärke verlieren oder wiedergewinnen, um eine Fortsetzung oder Umkehrung der Bewegungen vorherzusehen
- Ausgeklügeltes System für Alarme und Benachrichtigungen
Eingabeparameter
Einstellungen
- MA Zeitraum [>1]: MA-Periode für den SMA, der die im Algorithmus berechneten Werte analysiert
- St Dev Zeitraum [>1]: Standardabweichungszeitraum für die Analyse der im Algorithmus berechneten Werte
- St Dev Multiplikator: Multiplikator der Standard abweichung
- Algorithmus glätten: Glättet den Algorithmus, um besser feststellen zu können, ob Bullen oder Bären die Kontrolle haben
Visualisierung
- MAs/Standardabweichung anzeigen: Blendet die MA und St Deviation im Indikatorfenster ein oder aus
Benachrichtigungen
- MA-Warnungen aktivieren: Aktiviert Alarme, die auf den MAs der Algorithmusergebnisse basieren
- Standardabweichungs-Warnungen aktivieren: Aktiviert Alarme auf der Grundlage der St Dev Ergebnisse des Algorithmus
- Benachrichtigungen aktivieren: Aktiviert Mobiltelefon-Benachrichtigungen
Autor