All MT5 TimeFrames Stochastic
- Indikatoren
- Version: 5.9
- Aktualisiert: 18 November 2021
- Aktivierungen: 5

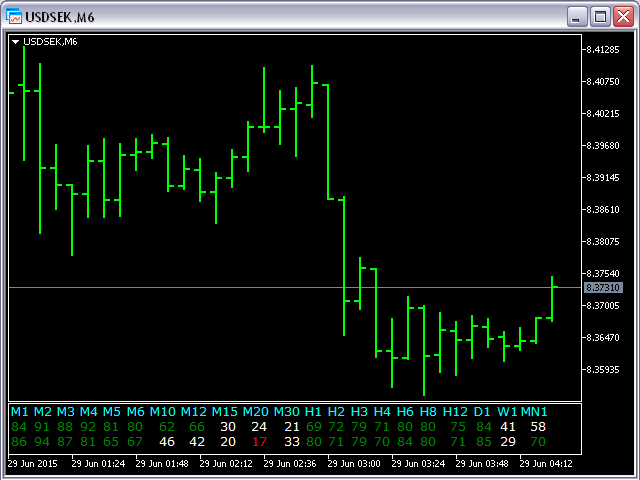
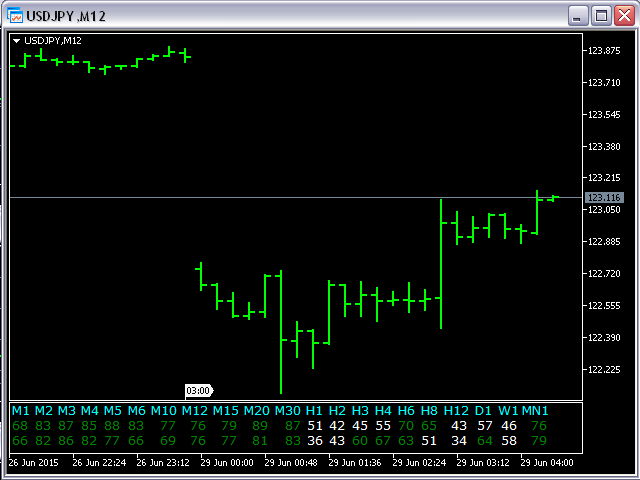
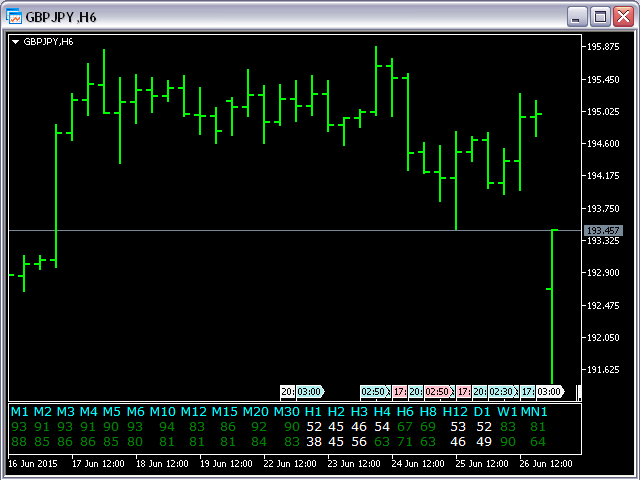
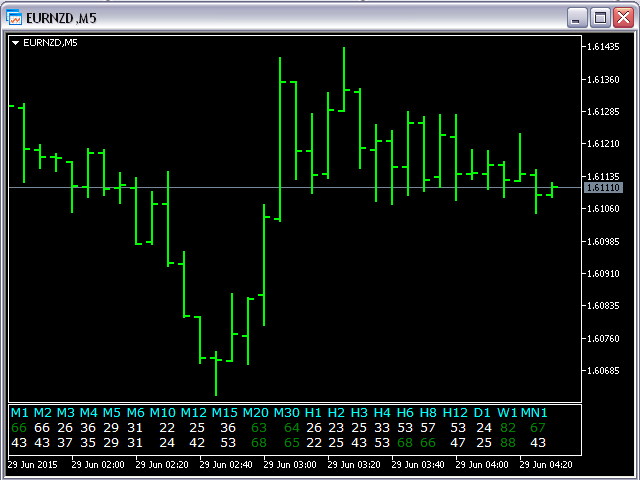
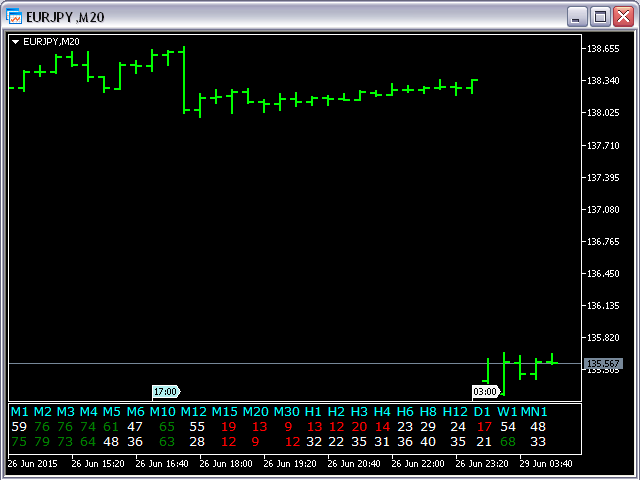
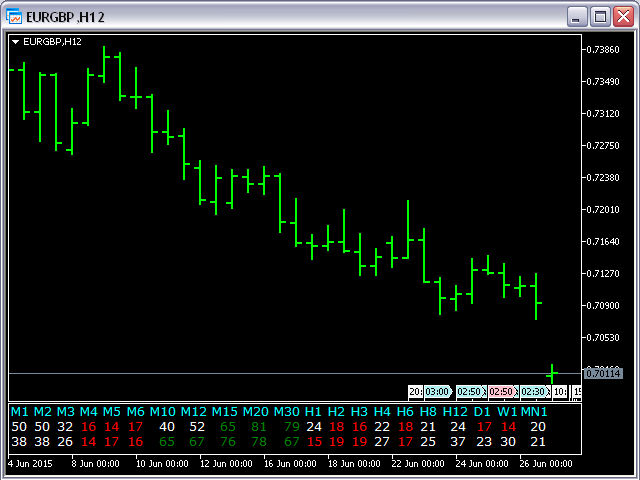
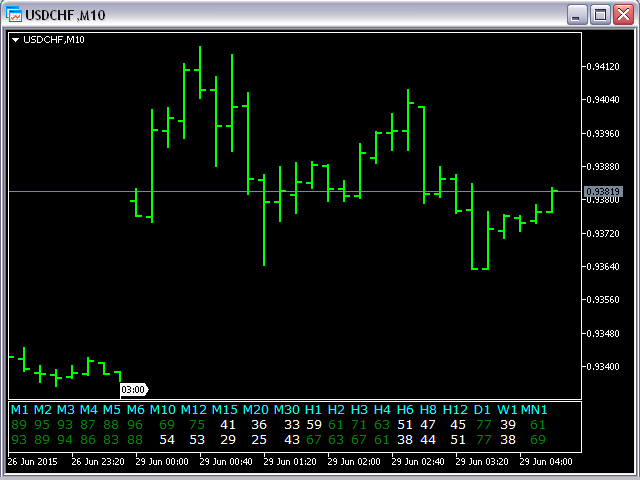
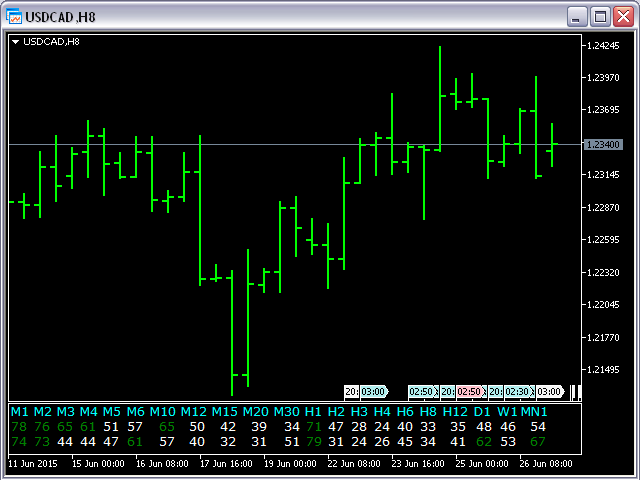
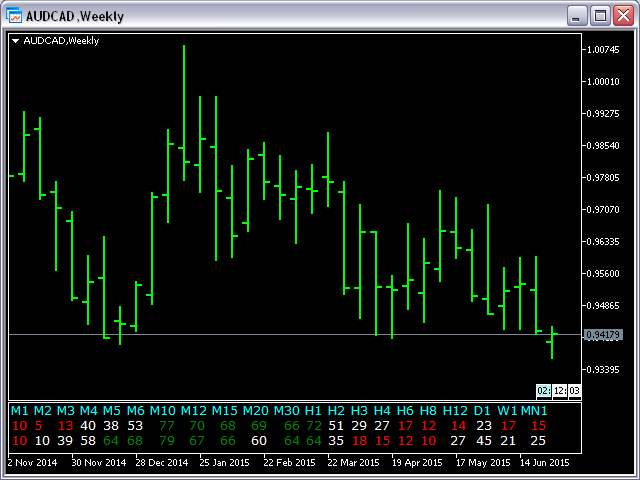
Dieser Indikator basiert auf dem klassischen Stochastik-Indikator und wird für diejenigen hilfreich sein, die nicht nur eine visuelle, sondern auch eine digitale Darstellung des Indikators lieben und zu nutzen wissen. Alle MT5 TimeFrames Stochastik-Indikator zeigt Werte von jedem Zeitrahmen:
- M1, M2, M3, M4, M5, M6, M10, M12, M15, M20, M30, H1, H2, H3, H4, H6, H8, H12, D1, W1, UND MN1.
Sie können die wichtigsten Eingabeparameter für jeden Indikator für jede TF ändern.
Die erste Datenzeile stellt die Hauptberechnungen der Stochastik dar.
Die zweite Datenzeile stellt die Signalberechnungen der Stochastik dar.
Beispiel für M1
- sTF1____ = "M1";
- K_Periode1 = 5;
- D_Periode1 = 3;
- S_Periode1 = 3;
- Methode1 = MODE_SMA;
- iPrice1 = STO_LOWHIGH;
Eingabeparameter
- OverboughtLevel = 80; - Überkauftes Niveau (alle TFs) für Stochastic
- OversoldLevel = 20; - Überverkauftes Niveau (alle TFs) für Stochastic
- aColor = clrAqua; - Farbe für TFs Beschriftungen
- wColor = clrWhite; - Farbe für die digitalen Stochastikwerte
Anmerkung:
- Wenn Sie das Währungspaar für den geöffneten Chart ändern, müssen Sie einige Sekunden (nächster Tick) auf die Neuberechnung warten.
- Bevor Sie diesen Indikator verwenden, müssen Sie alle Charts (alle TFs) für die aktuellen Währungspaare öffnen.