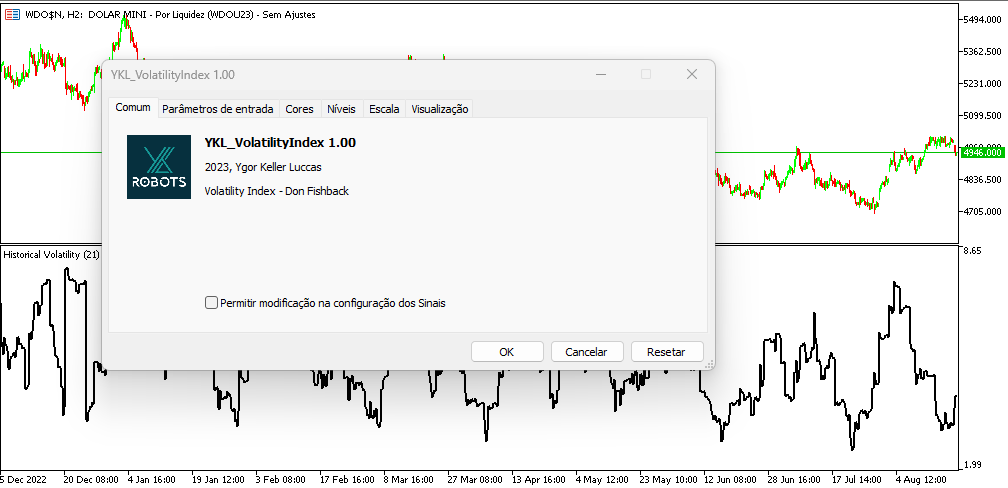
YKL Historical Volatility
- Indikatoren
- Version: 1.0

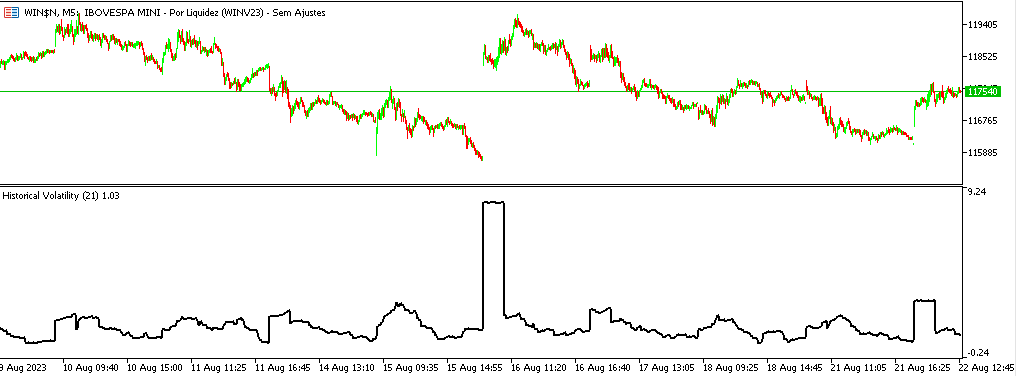
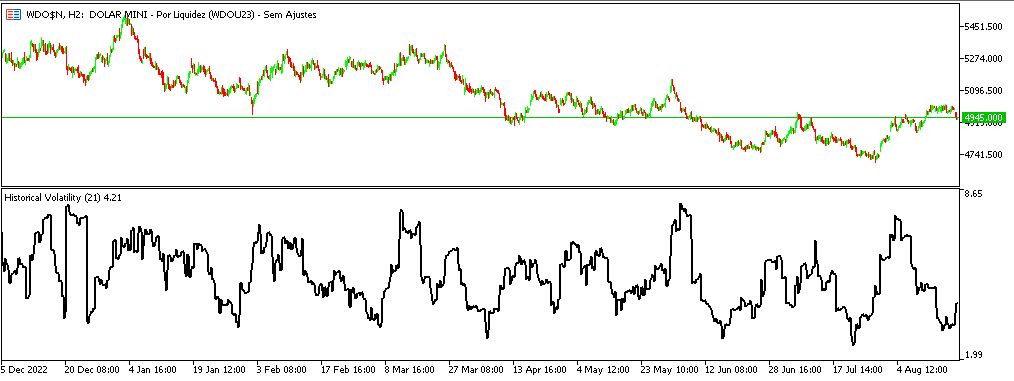
Historischer Volatilitätsindikator
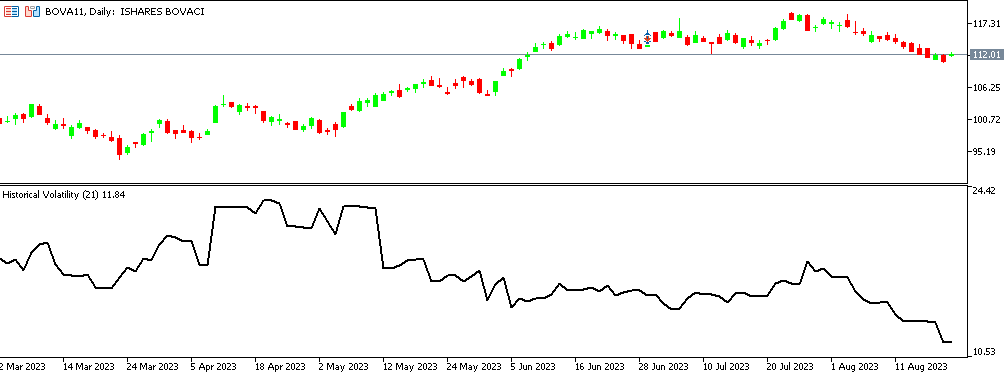
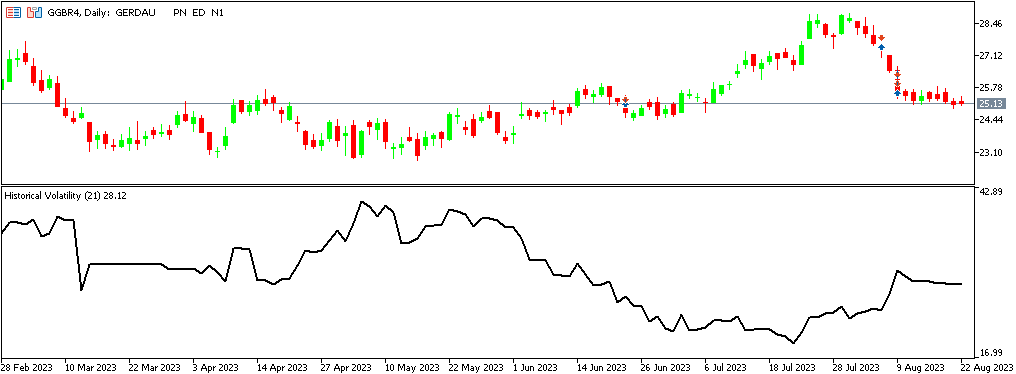
Der Indikator ist ein Oszillator, der die historische Volatilität eines Vermögenswerts abbildet, die durch die folgenden Formeln dargestellt wird:
Historische Volatilität = Quadratwurzel der durchschnittlichen quadratischen Differenzen * Annualisierungsfaktor.
Durchschnittliche quadrierte Differenzen = Summe aller täglichen Renditedifferenzen / Gesamtzahl der Differenzen.
Tägliche Rendite = (aktueller Kurs - vorheriger Kurs) / vorheriger Kurs.
In diesem Indikator verwenden wir die Schlusskurse jedes Balkens und berechnen die arithmetischen Mittelwerte.
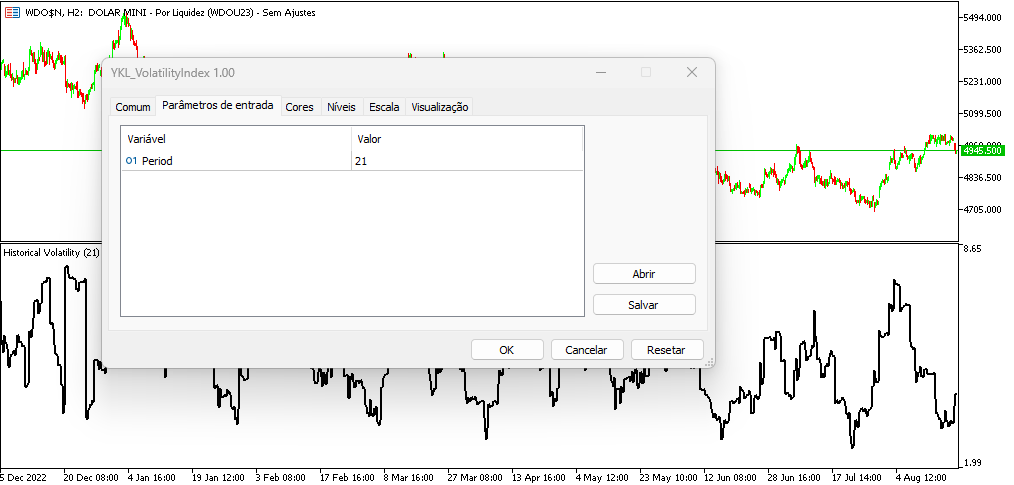
Eingaben für den Indikator:
- Periode: Anzahl der Perioden zur Berechnung der Volatilität.
Zusammenfassung des Indikatorpuffers:
- Puffer 1 - Annualisierte historische Volatilität
Dieser Indikator funktioniert für jeden Vermögenswert, egal ob es sich um Terminkontrakte oder Aktien handelt.