YKL Regressao Linear
- Indikatoren
- Version: 1.20

Linearer Regressionsindikator - Asset-Paar
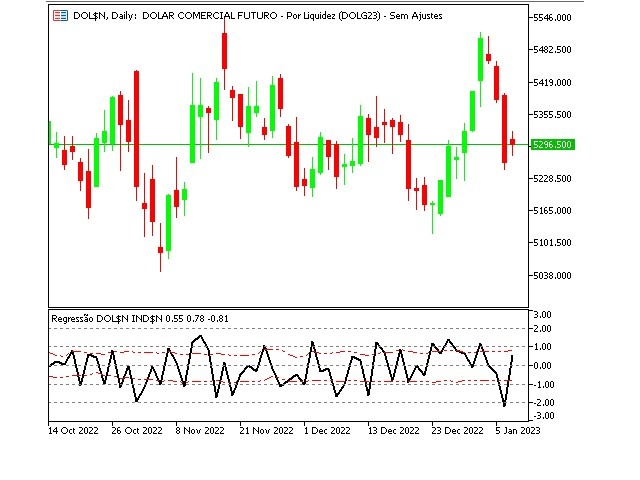
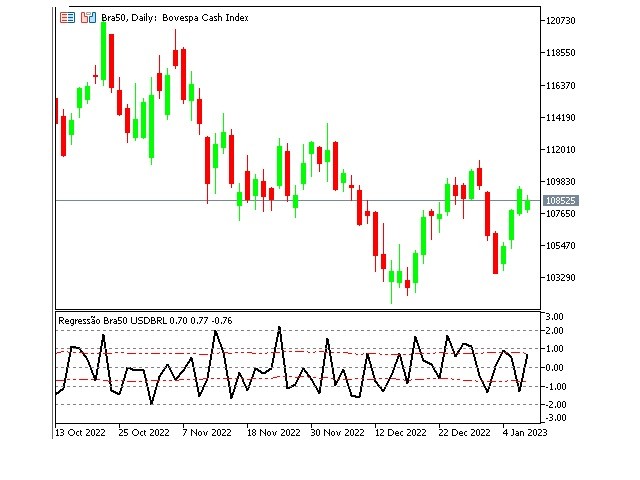
Der Indikator ist ein Oszillator, der das Residuum darstellt, das sich aus der linearen Regression zwischen den beiden Vermögenswerten ergibt, die als Eingabe für den Indikator eingegeben wurden, dargestellt durch die Formel:
Y = aX + b + R
Dabei ist Y der Wert des abhängigen Vermögenswerts, X ist der Wert des unabhängigen Vermögenswerts, a ist die Steigung der Linie zwischen den beiden Vermögenswerten, b ist der Schnittpunkt der Linie und R ist der Restwert.
Das Residuum gibt den Anteil der Variabilität von Y an, den das angepasste Modell nicht erklären kann. Die Residuen können mit der folgenden Formel berechnet werden:
Residuum = Y-Yˆ
Dabei ist Y der tatsächliche Wert und Y^ der Wert, der durch das Modell auf der Grundlage der Kointegration zwischen den beiden Vermögenswerten berechnet wird.
Indikator-Eingaben:
- Abhängiges Symbol: Abhängiger Vermögenswert (Y)
- Unabhängiges Symbol: Unabhängiger Vermögenswert (X)
- Regressionsbalken: Anzahl der Tage, an denen eine lineare Regression zwischen den beiden Vermögenswerten durchgeführt werden kann
Der Indikator ist für die Anlagepaare WINFUT und WDOFUT an der brasilianischen Börse B3 optimiert. Der Indikator wird immer auf dem Tageschart dargestellt, unabhängig von der Auswahl des Zeitrahmens durch den Benutzer. Der Indikator wird immer auf dem Chart des abhängigen Vermögenswerts dargestellt.