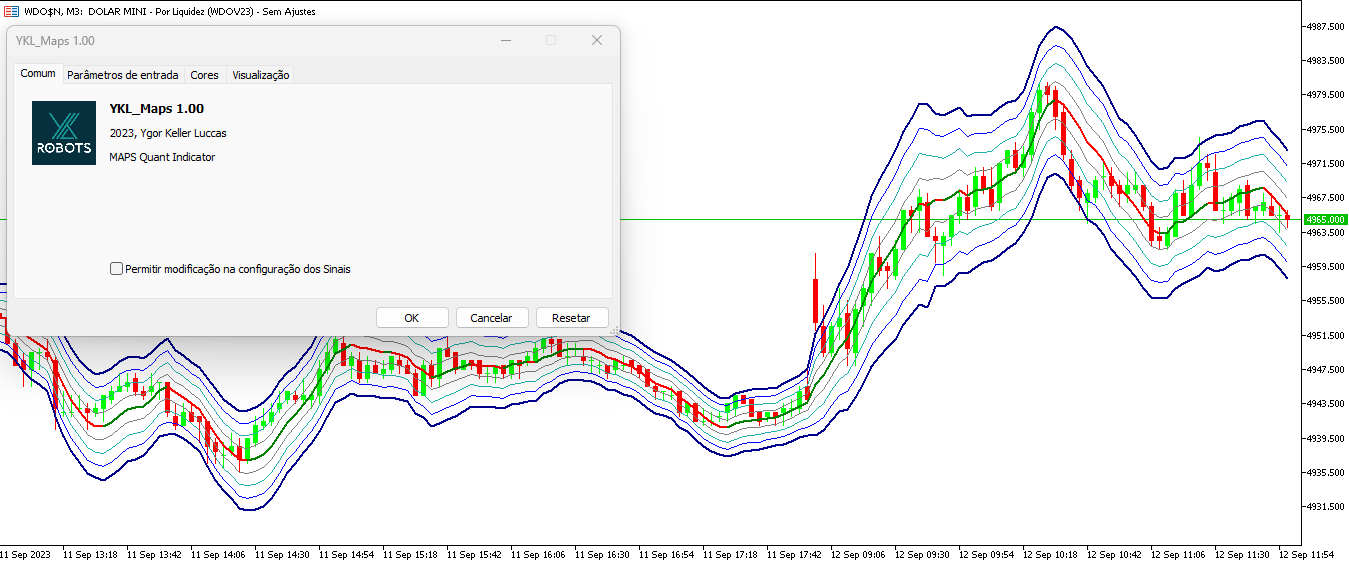
YKL Maps
- Indikatoren
- Version: 1.0

MAPS-Indikator
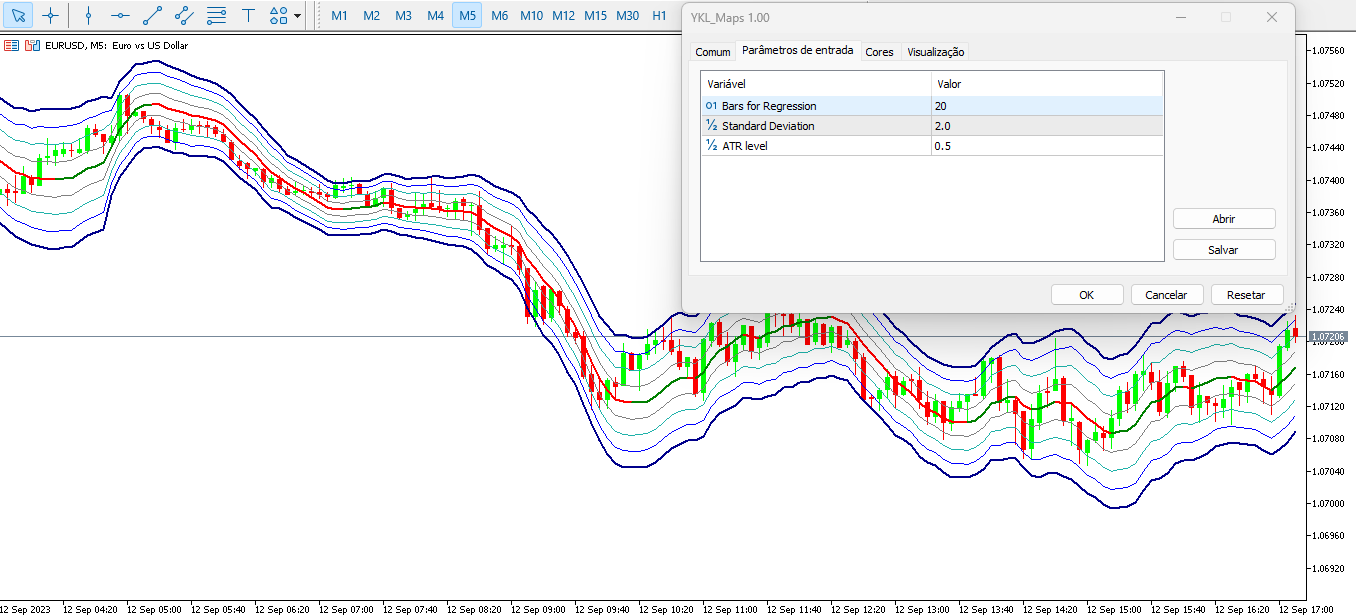
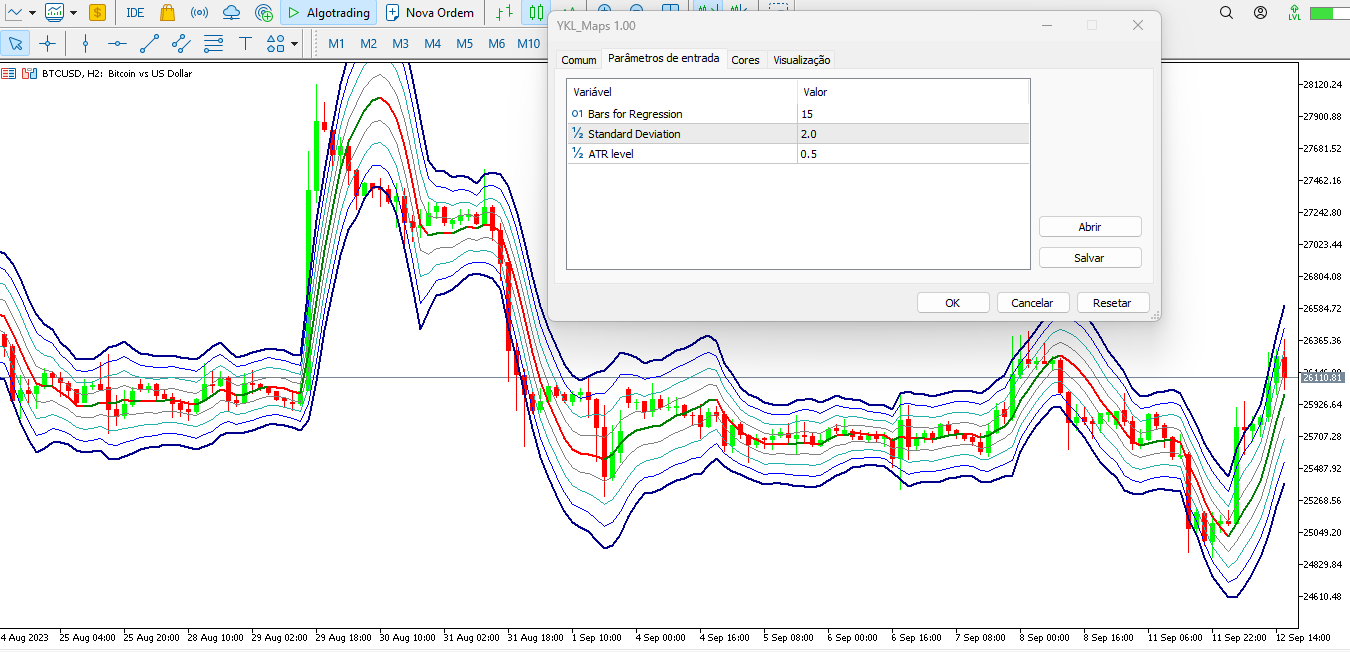
Der MAPS-Indikator ist ein Oszillator, der die Ertragskurve einer Regression zweiten Grades zu den Schlusskursen des Vermögenswerts im Diagramm abbildet. Die Ertragskurve ist die Mittellinie des MAPS-Indikators und stellt den Bereich des Preisgleichgewichts zwischen Käufern und Verkäufern dar.
Die Indikatorplots sind:
- Mittlere Linie - C0 - ihre Farbe variiert je nach Markttrend, grün für einen Aufwärtstrend und rot für einen Abwärtstrend;
- Obere Linien: S1, S2, S3 und S4, wobei S4 am weitesten von der Mitte entfernt ist;
- Untere Linien: I1, I2, I3 und I4, wobei I4 am weitesten von der Mitte entfernt ist.
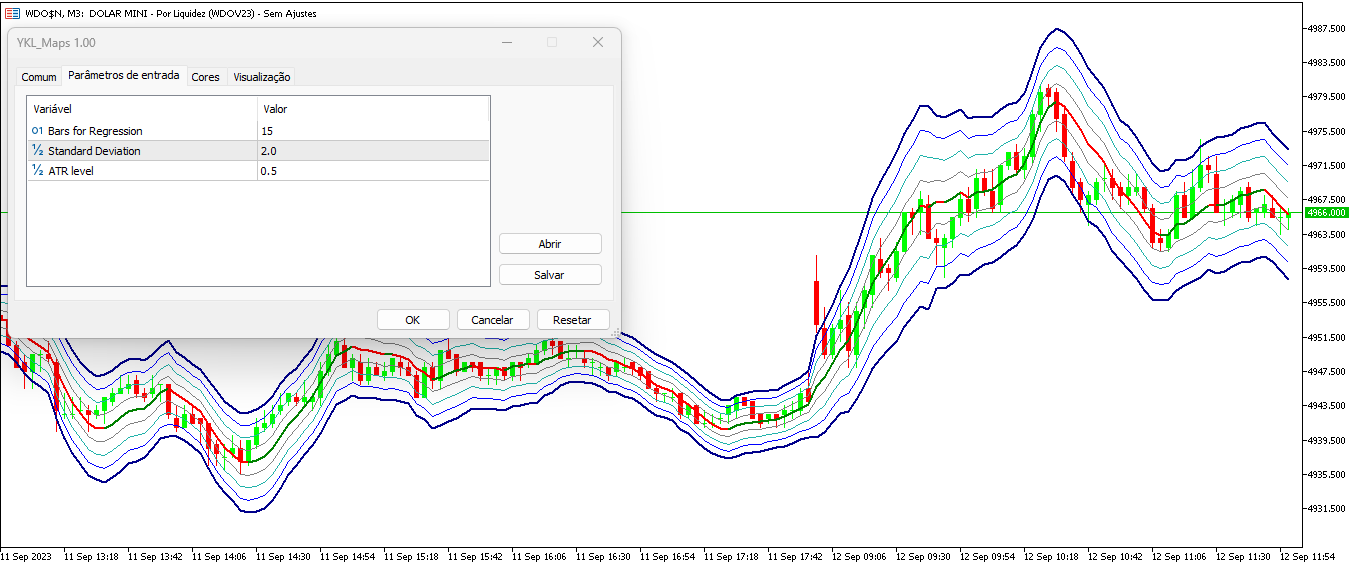
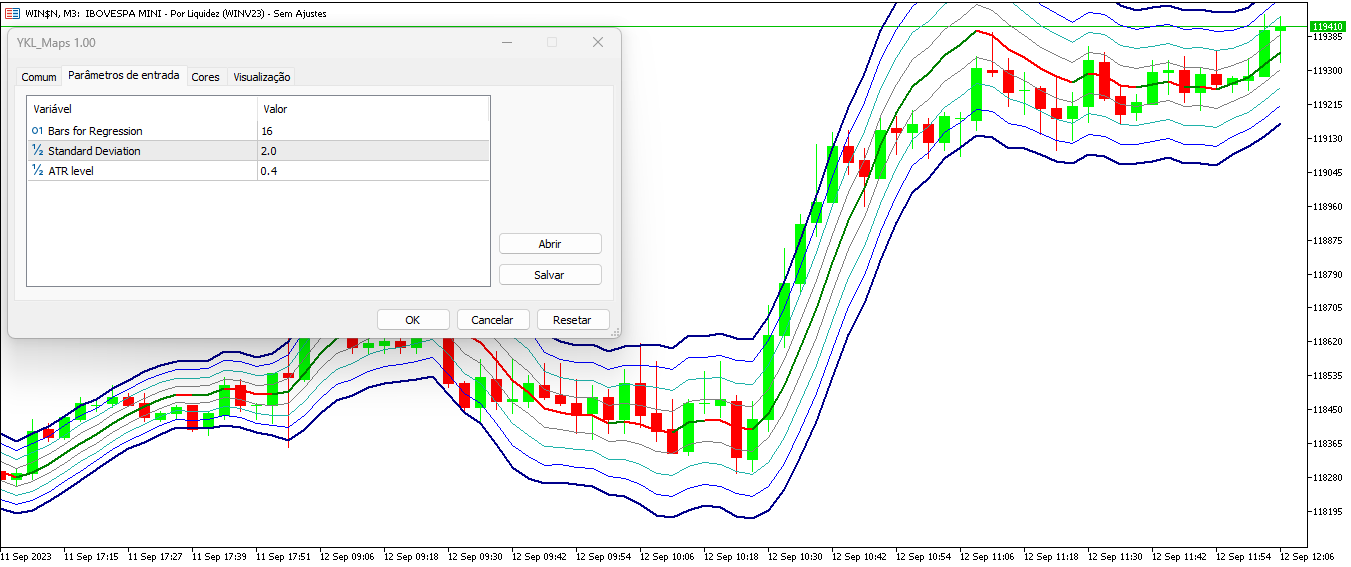
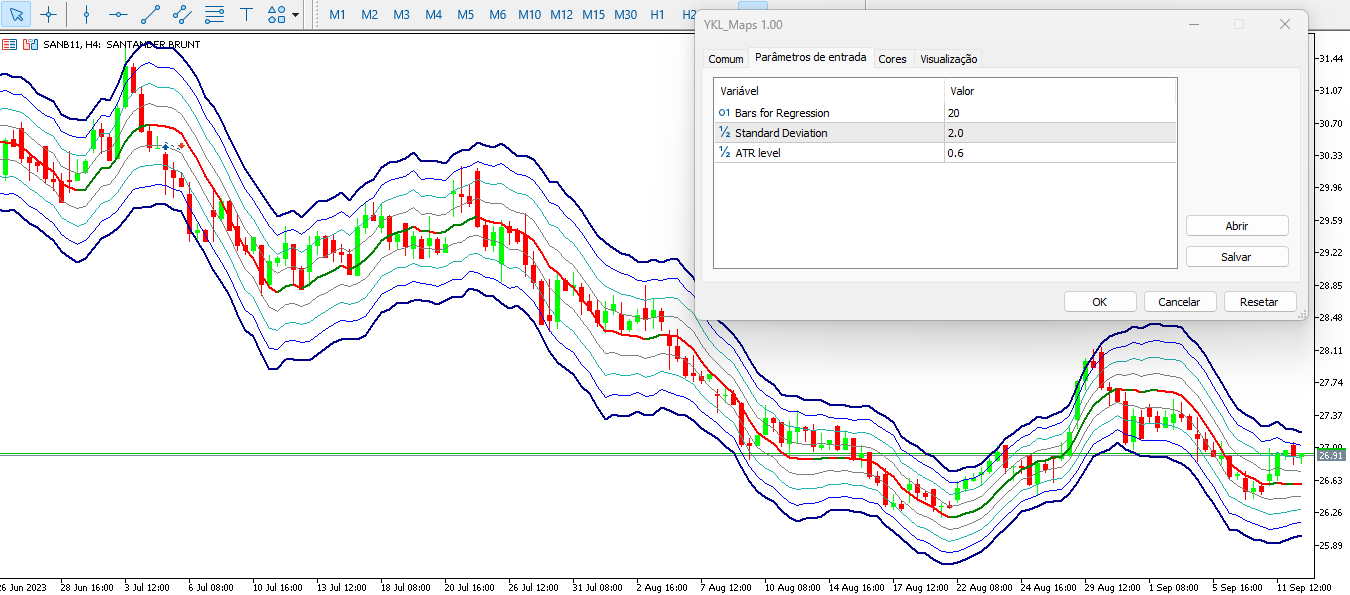
Eingaben der Indikatoren:
- Regressionsbalken: Anzahl der Balken für die durchzuführende Regression zweiten Grades.
- Standardabweichung: die Abweichung, die bei den Berechnungen der Regression zweiten Grades berücksichtigt wird.
- ATR-Niveau: die Größe jeder Ebene (Diagrammlinie) im MAPS-Indikator. Je höher das ATR-Niveau ist, desto größer ist der Abstand zwischen den Indikatorlinien. Eine ATR-Stufe von 0,5 gilt als ausgeglichene Stufe, so dass eine Gesamtzahl von 4 Linien nach unten oder oben einen Wert von 2 Standardabweichungen von der Mittellinie ergibt.
Zusammenfassung aller Indikatorpuffer:
- Puffer 0 - Oberste Zeile 1 (S1)
- Puffer 1 - Oberste Zeile 2 (S2)
- Puffer 2 - Oberste Zeile 3 (S3 )
- Puffer 3 - Obere Zeile 4 (S4)
- Puffer 4 - Untere Zeile 1 (I1)
- Puffer 5 - Untere Reihe 2 (I2)
- Puffer 6 - Untere Reihe 3 (I3)
- Puffer 7 - Untere Reihe 4 (I4)
- Puffer 8 - Mittellinie (C0)
- Puffer 9 - Puffer für die Einfärbung der Mittellinie
Der Indikator ist für die Anlagepaare WINFUT und WDOFUT an der brasilianischen Börse B3 optimiert, funktioniert aber für alle Anlagen, einschließlich Devisen.

GOOD!!!