Elder Market Thermometer
- Indikatoren
-
Financial Trading Seminars Inc.
 Dr. Alexander Elder
Dr. Alexander Elder is a professional trader based in New York City. He is the author of 11 books, including Trading for a Living (1996) and - Version: 2.0
- Aktualisiert: 18 November 2021
- Aktivierungen: 5
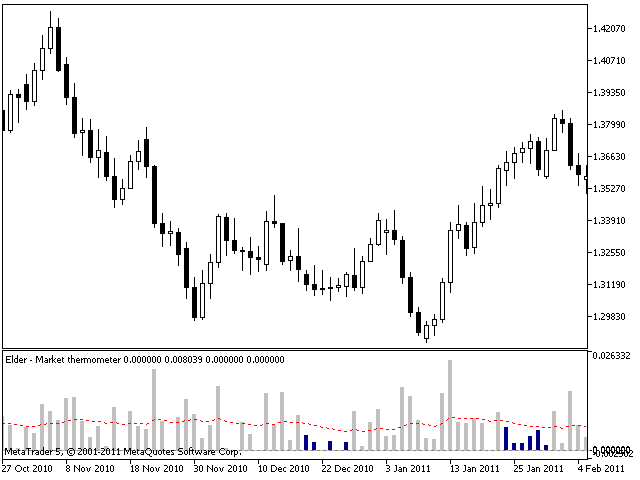
Das Marktthermometer, das im Buch "Come into my Trading Room" beschrieben wird, misst den Grad der Volatilität, der sich in größeren oder kleineren Schwankungen innerhalb eines Tages widerspiegelt. Wenn die Markttemperatur über ihren Durchschnitt hinausgeht oder für eine Reihe von Tagen unter ihrem Durchschnitt bleibt, gibt es Handelssignale, wie im Buch beschrieben.
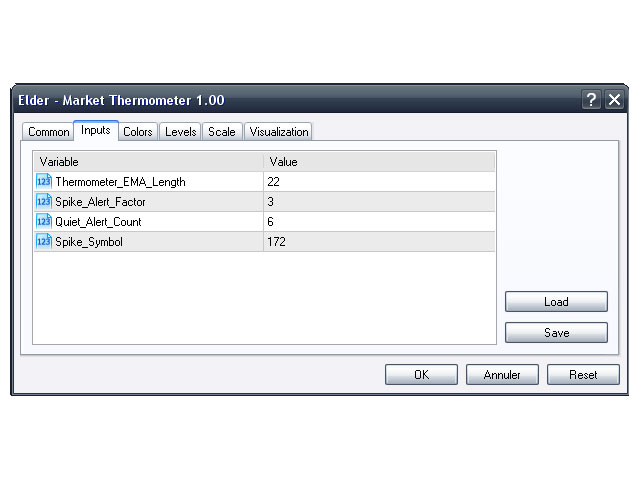
Parameter:
- Thermometer_EMA_Length (22) - Die Länge des gleitenden Durchschnitts der Markttemperatur. Der Standardwert 22, die durchschnittliche Anzahl von Handelstagen in einem Monat.
- Spike_Alert_Factor (3) - Wenn die Temperatur ihren EMA um diesen Faktor überschreitet, erscheint ein visueller Hinweis auf dem Chart.
- Quiet_Alert_Count (6) - Wenn die Temperatur für diese Anzahl von Handelstagen unter ihrem EMA bleibt, erscheint ein visueller Hinweis auf dem Chart.
- Spike_Symbol (6) - Symbol, das zur Anzeige von Spikes angezeigt wird.