Elder Chandelier Short Exit
- Indikatoren
-
Financial Trading Seminars Inc.
 Dr. Alexander Elder
Dr. Alexander Elder is a professional trader based in New York City. He is the author of 11 books, including Trading for a Living (1996) and - Version: 2.0
- Aktualisiert: 17 November 2021
- Aktivierungen: 5
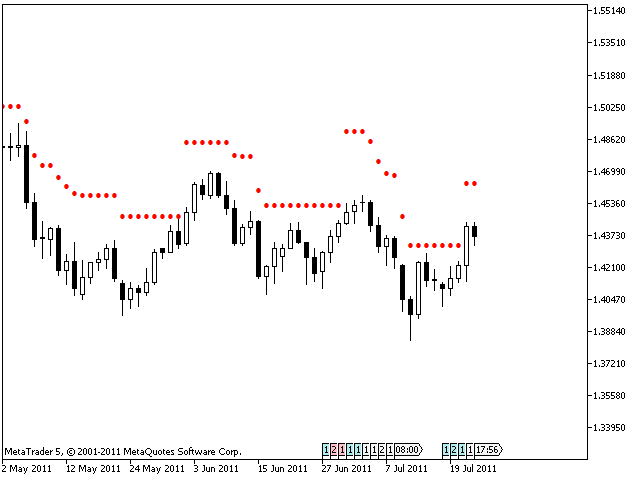
Der von Charles LeBeau eingeführte Chandelier Exit wird im Buch "Come into My Trading Room" beschrieben.
Er berechnet jeden Stopp für eine Short-Position in einem Abwärtstrend vom niedrigsten Punkt aus, der während dieses Abwärtstrends erreicht wurde. Der Chandelier Exit verwendet ein Vielfaches der Average True Range (ATR) und addiert es zum tiefsten Stand seit dem Einstieg in den Handel. Es wird immer dann ein neuer Handel eröffnet, wenn der vorherige Handel ausgestoppt wird.
Chandelier Stops unterscheiden sich von traditionellen Stops dadurch, dass sie sich auch gegen Sie bewegen können, wenn der Ankerpunkt gleich bleibt, aber die ATR aufgrund der Volatilität steigt. Ein konservativerer Ansatz besteht darin, jede Änderung eines Stopps zu ignorieren, die Ihr Risiko erhöht.
Parameter:
- Faktor (3) - Dies ist der Faktor, mit dem die ATR bei der Berechnung des Chandeliers multipliziert wird. Sie können Brüche verwenden - es muss sich nicht um eine ganze Zahl handeln;
- ATR_Days (22) - Anzahl der Tage für die Berechnung der ATR;
- Wingding_Symbol (159) - Symbol, das angezeigt werden soll.