SmartMA
- Indikatoren
-
Jinsong Zhang
 MT5 Articles List - Traders' Blogs: https://www.mql5.com/en/blogs/post/90
 - Version: 1.1
- Aktualisiert: 19 November 2021
- Aktivierungen: 5
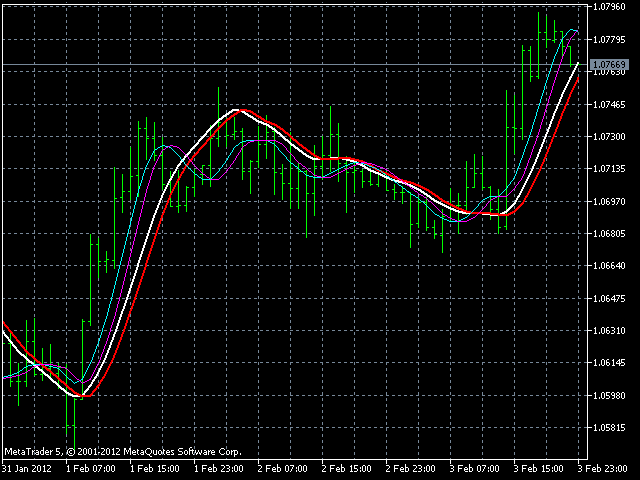
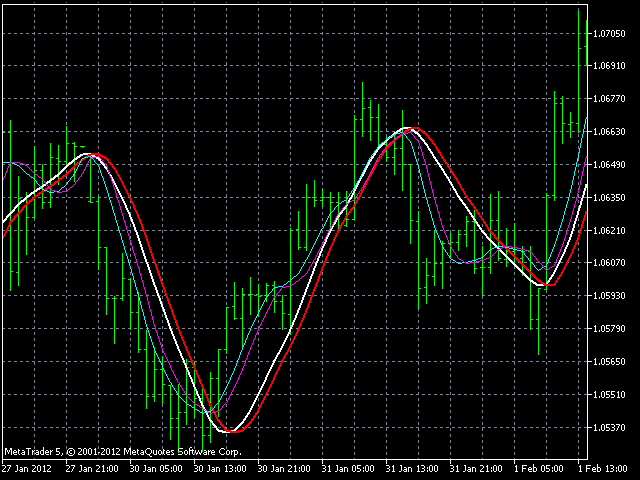
Dies ist ein Trendindikator, wie Sie hier sehen können.
Wenn die weiße Linie oberhalb der roten Linie liegt, bedeutet dies einen Bullenmarkt.
Umgekehrt ist die weiße Linie unterhalb der roten Linie ein Bärenmarkt.
Dieser Index eignet sich für den langfristigen Handel und ist für die meisten Handelsarten geeignet.
--------------------------------------------------------------------------------------------