
Ticks RSI
- Indikatoren
- Version: 1.12
- Aktualisiert: 18 November 2021
- Aktivierungen: 5

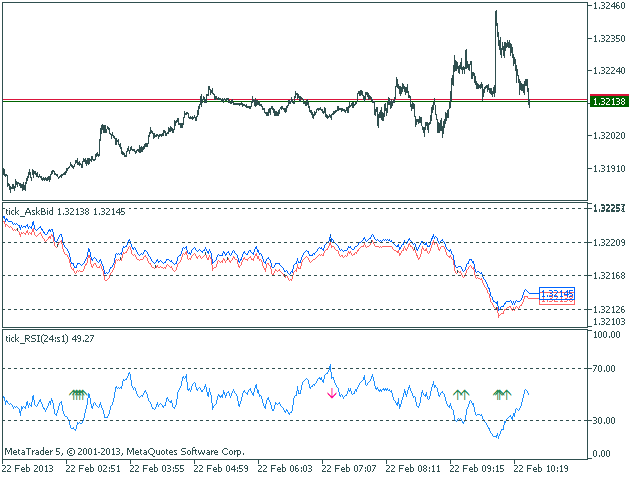
Der Relative-Stärke-Index-Indikator wird in einem Tick-Chart gezeichnet.
Nach dem Start warten Sie, bis genügend Ticks vorhanden sind.
Parameter:
- RSI Periode - Periode der Mittelwertbildung.
- overbuying level - überkauftes Niveau.
- überverkauftes Niveau - überverkauftes Niveau.
- Berechnete Balken - Anzahl der Balken auf dem Chart für die Berechnung des Indikators.
Die folgenden Parameter sind für die Einstellung der Gewichtung der RSI-Signale (von 0 bis 100) bestimmt. Ihre Beschreibung finden Sie im Abschnitt Signale des Oszillators Relative Strength Index der MQL5-Referenz.
- Der Oszillator hat eine bestimmte Richtung.
- Rückwärtsbewegung hinter dem Niveau des überkauften/überverkauften Niveaus.
- Fehlgeschlagener Swing.
- Divergenz zwischen dem Oszillator und dem Preis.
- Doppelte Divergenz des Oszillators und des Preises.
- Kopf/Schulter.
Pufferindizes: 0 - RSI_LINE, 1 - SIGNAL_UP, 2 - SIGNAL_DOWN, 3 - BID, 4 - ASK.


One has to install from inside market window tab in terminal. works fine then