Volume Weighted MACD
- Indikatoren
-
eSoftrade
 eSoftrade
Financial Tools
eSoftrade is a French company developping indicators and expert advisors for MetaTrader 4 and MetaTrader 5.
We worked together with Dr. Elder to provide you tools for those platforms. We are also available for custom programming. - Version: 2.0
- Aktualisiert: 15 Februar 2022
- Aktivierungen: 5
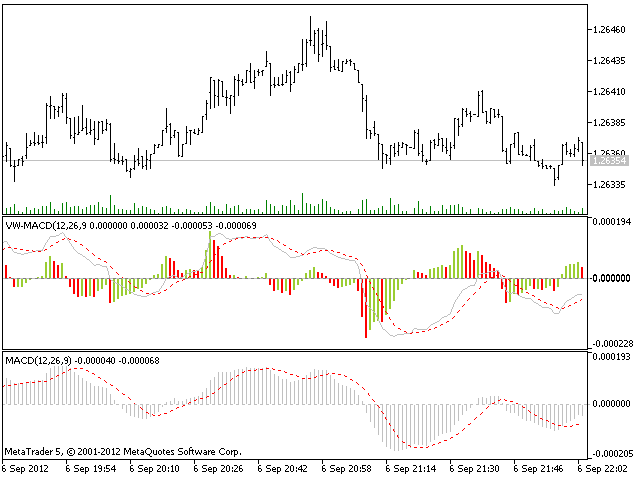
Volumengewichteter MACD
Der volumengewichtete MACD (VW-MACD) wurde von Buff Dormeier erstellt und in seinem Buch Investieren mit Volumenanalyse beschrieben. Er repräsentiert die Konvergenz und Divergenz volumengewichteter Preistrends.
Durch die Einbeziehung des Volumens ist der VW-MACD im Allgemeinen reaktionsschneller und zuverlässiger als der traditionelle MACD.
Was ist MACD (Moving Average Convergence Divergence)?
Moving Average Convergence Divergence wurde 1979 von Gerald Appel entwickelt. Der Standard-MACD stellt die Differenz zwischen einem kurzfristigen exponentiellen Durchschnitt und einem langfristigen exponentiellen Durchschnitt dar. Wenn die Differenz (die MACD-Linie) positiv ist und steigt, deutet dies auf einen Aufwärtstrend der Preise hin. Wenn die MACD-Linie negativ ist, deutet dies auf einen Abwärtstrend der Preise hin.
Ein glatter exponentieller Durchschnitt dieser Differenz wird berechnet, um die MACD-Signallinie zu bilden. Wenn die MACD-Linie über der MACD-Signallinie liegt, zeigt dies, dass die Dynamik des MACD steigt. Ebenso sinkt das Momentum des MACD, wenn der MACD unter der MACD-Signallinie liegt. Diese Differenz zwischen der MACD-Linie und der MACD-Signallinie wird häufig als Histogramm gezeichnet, um die Spanne zwischen den beiden Linien hervorzuheben.
Was ist der Unterschied zwischen MACD und VW-MACD?
Der volumengewichtete MACD ersetzt die beiden exponentiell gleitenden Durchschnitte, um die MACD-Differenz durch die beiden entsprechenden volumengewichteten gleitenden Durchschnitte zu berechnen. Somit stellt der VW-MACD einen volumengewichteten kurzfristigen Trend dem volumengewichteten längerfristigen Trend gegenüber.
Die Signallinie wird als exponentiell gleitender Durchschnitt belassen, da die VW-MACD-Linie bereits volumengewichtet ist.
Volumengewichteter MACD für MetaTrader 5
Der VW-MACD-Indikator für MetaTrader 5 zeigt 4 Ausgänge:
- MACD-Linie als graue durchgezogene Linie;
- Signallinie als gestrichelte rote Linie;
- Aufwärts MACD-Histogramm als grüner Balken;
- Down-MACD-Histogramm als roter Balken.
Das VW-MACD-Histogramm wird um einen Faktor verstärkt, um alle Änderungen besser sichtbar zu machen.