Elder SafeZone Short Entries
- Indikatoren
-
Financial Trading Seminars Inc.
 Dr. Alexander Elder
Dr. Alexander Elder is a professional trader based in New York City. He is the author of 11 books, including Trading for a Living (1996) and - Version: 2.0
- Aktualisiert: 17 November 2021
- Aktivierungen: 5
Eine der wichtigsten Regeln beim Handel lautet: Ziehen Sie Ihre Stopps nie so nach, dass sich Ihr Risiko erhöht. Unsere Stopp-Sequenz zeigt die automatische Verschärfung der Stopps. Sie erscheinen als eine Reihe von Punkten mit abnehmendem Risiko, bis der Handel schließlich gestoppt wird.
Das Problem besteht darin, dass Sie den Stopp möglicherweise zu eng setzen, wenn Sie an einem anderen Punkt als dem Anfangspunkt der Sequenz einsteigen. Stop-Entry-Diagramme zeigen Ihnen den Anfangswert für den Stop für jeden Balken. Sie können sie verwenden, wenn Sie einen Handel eingehen, und den Wert jeden Tag verringern, bis Sie schließlich einen Stopp erreichen.
Die Einstiegsindikatoren haben genau die gleichen Parameter wie die Stop-Sequenzen.
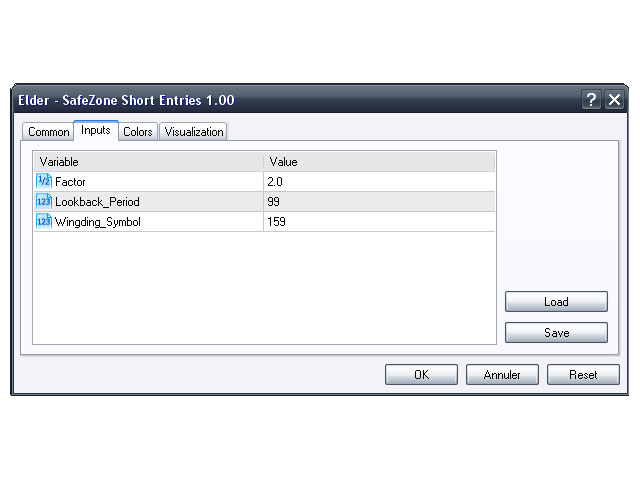
Parameter
- Faktor (3) - Dies ist der Faktor, mit dem das von SafeZone berechnete durchschnittliche Rauschniveau multipliziert wird.
- Lookback_Period (99) - Die Anzahl der Bars, die SafeZone bei der Berechnung eines durchschnittlichen Marktrauschens zurückblickt.
- Wingding_Symbol (159) - Anzuzeigendes Symbol.