DWMACD
- Indikatoren
- Version: 1.1
- Aktualisiert: 23 November 2021
- Aktivierungen: 5
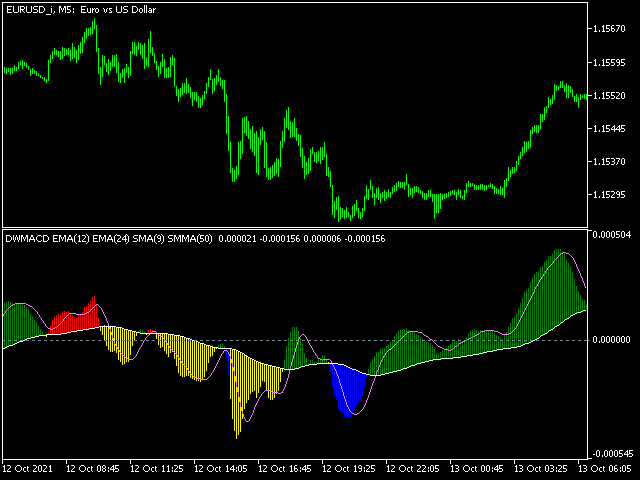
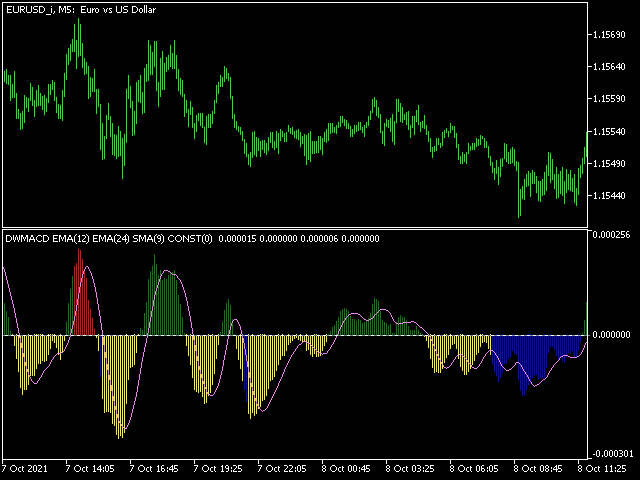
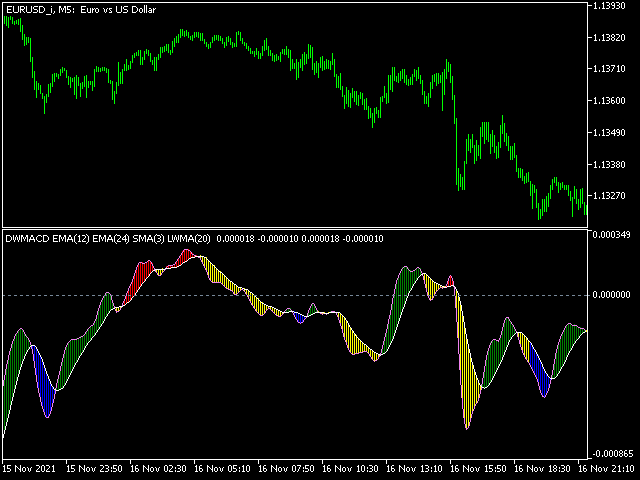
DWMACD - Divergenzwelle MACD. Der Indikator zeigt Divergenzen an, indem er die Farbe des MACD-Histogramms ändert. Der Indikator ist einfach zu bedienen und zu konfigurieren.
Für die Berechnung können eine Signallinie oder die Werte des Standard-MACD-Histogramms verwendet werden. Sie können die Berechnung über den Parameter UsedLine ändern. Es ist ratsam, eine Signallinie für die Berechnung zu verwenden, wenn das Histogramm häufig die Richtung ändert und kleine Werte aufweist, die eine Art Flat bilden. Um die Histogrammwerte zu glätten, setzen Sie die Signallinie auf UsedLine und eine kleine Periode (2-5). Mit zunehmender Periode hinkt der Indikator dem Kurs hinterher (das gilt für jeden Indikator).
Der Indikator wird zum aktuellen Kurs (Schlusskurs) berechnet.
Sie können Ihre eigenen gleitenden Durchschnittswerte in den Einstellungen verwenden. Es ist möglich, 4 Standardtypen von gleitenden Durchschnitten zu verwenden (SMA, EMA, LWMA, SMMA). Außerdem wird der Typ CONST eingeführt - eine gerade Linie (konstanter Wert). Bei der Verwendung von CONST wird der Wert aus der Periode der angegebenen Linie genommen. Sie können CONST nicht verwenden, um den MACD selbst zu erstellen. Kann nur beim Zeichnen einer Terminatorlinie verwendet werden. Die Begrenzungslinie teilt das Histogramm in einen oberen und einen unteren Teil. Beim Standard-MACD ist dies die Nulllinie. Wenn Sie Standardwerte mit einem Nullterminator verwenden möchten, verwenden Sie CONST für die Terminatorlinie mit einer Periode von 0. In diesem Indikator kann der Terminator ein gleitender Durchschnitt sein, der aus der im Parameter UsedLine angegebenen Basislinie berechnet wird. Dementsprechend wird die Divergenz als die Differenz der Abweichung benachbarter unidirektionaler Spitzen von der Terminatorlinie berechnet.
Die Signale dieses Indikators sind Divergenzsignale. Dies ist nicht unbedingt eine Umkehrung, aber auf jeden Fall eine Abschwächung des Trends. Unter anderen positiven Bedingungen lohnt es sich, mit diesem Indikator in den Markt einzusteigen, wenn die Terminator-Linie von einer Divergenzwelle durchbrochen wird und ein langer Trend zu erwarten ist. Es ist auch möglich, dass die sich abzeichnende Divergenz nicht gerechtfertigt ist und der Kurs sich weiter bewegt. Auf dem Histogramm sieht dies wie die Farbe der Divergenz aus, die durch die Farbe einer einfachen Bewegung ersetzt wird. In diesem Fall setzt sich die Kursbewegung (in der Regel) mindestens eine weitere Welle fort.
Die Farben der Divergenz entsprechen der Intuition: blau - auf der Suche nach Käufen, rot - Verkäufe.
Hinweis: Die nächste Divergenz hebt die vorherige auf!
Meiner Meinung nach zeigt der Indikator die besten Ergebnisse mit den Standardeinstellungen, aber Sie können auch Parameter finden, die für Sie besser geeignet sind.
Ich wünsche Ihnen viel Erfolg beim Handel!