Ticks Bears
- Indikatoren
- Version: 1.12
- Aktualisiert: 18 November 2021
- Aktivierungen: 5

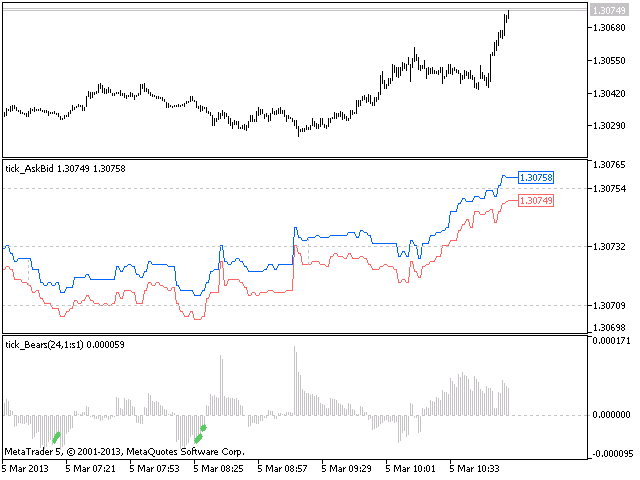
Der Bears Power-Indikator wird mit einem Tick-Chart gezeichnet.
Nach dem Start warten Sie, bis genügend Ticks vorhanden sind.
Parameter:
- Periode - Periode der Mittelwertbildung.
- Anzahl der Ticks zur Bestimmung von Hoch/Tief - Anzahl der einzelnen Ticks zur Bestimmung von Hoch/Tief.
- Berechneter Balken - Anzahl der Balken für die Berechnung des Indikators.
Die folgenden Parameter sind für die Einstellung der Gewichtung der Signale von Bears Power bestimmt (von 0 bis 100). Ihre Beschreibung finden Sie im Abschnitt Signale des Bears Power Oszillators der MQL5 Referenz.
- Umkehrung des Oszillators in die gewünschte Richtung.
- Divergenz des Oszillators und des Preises.
Pufferindizes: 0 - Bären, 3 - SIGNALWERT