Elder MACD XOver
- Indikatoren
-
Financial Trading Seminars Inc.
 Dr. Alexander Elder
Dr. Alexander Elder is a professional trader based in New York City. He is the author of 11 books, including Trading for a Living (1996) and - Version: 2.0
- Aktualisiert: 17 November 2021
- Aktivierungen: 5
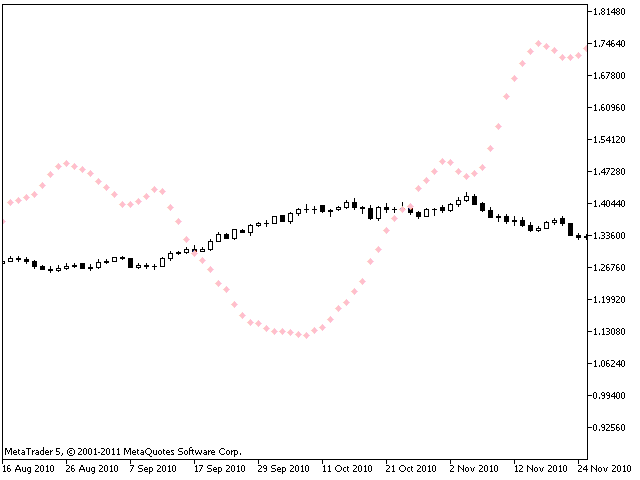
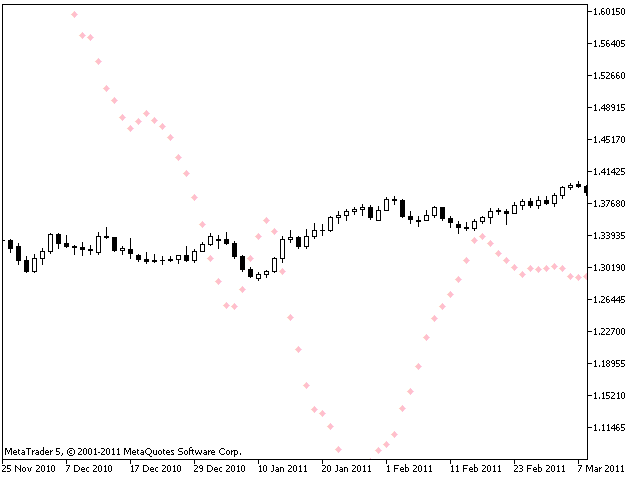
Der MACD XOver-Indikator wurde von John Bruns entwickelt, um den Preispunkt vorherzusagen, an dem das MACD-Histogramm die Richtung seiner Steigung umkehren wird.
Der Indikator wird einen Tag in die Zukunft gezeichnet, so dass Sie, wenn Ihre Strategie vom MACD-Histogramm abhängt, dessen Umkehrpunkt für morgen (oder den nächsten Balken in einem beliebigen Zeitrahmen) vorhersagen können. Wenn der morgige Schlusskurs über dem Wert dieses Indikators liegt, wird das MACD-Histogramm nach oben ticken. Wenn der morgige Schlusskurs unter dem Wert dieses Indikators liegt, wird das MACD-Histogramm nach unten tendieren. Dies ist besonders nützlich auf den Charts der längeren Zeitrahmen und bei der Verwendung des Impulssystems, dessen Farbe zum Teil von der Neigung des MACD-Histogramms abhängt.
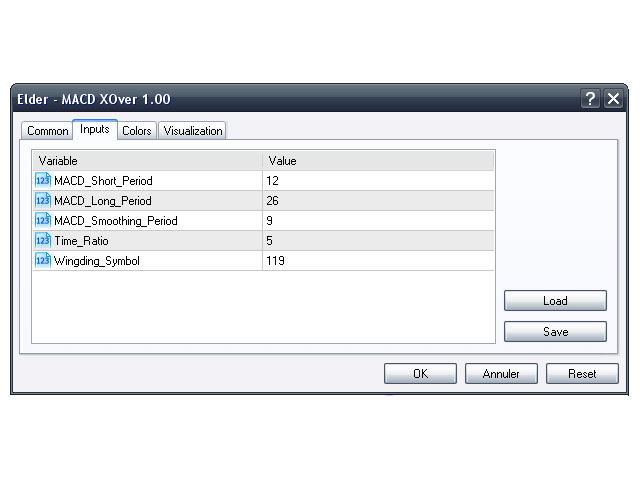
Verwenden Sie die gleichen Werte wie der MACD Combo, den Sie vorwegnehmen möchten. Wenn Sie die Standardwerte verwenden, akzeptieren Sie die unten stehenden Werte.
Parameter:
- MACD_Short_Period(12) - Der kurze EMA für die MACD-Berechnung;
- MACD_Long_Period (26) - Der lange EMA für die MACD-Berechnung;
- MACD_Smoothing_Period (9) - Der Glättungswert für die Signallinie;
- Time_Ratio (1) - Der Standardwert ist hier auf 5 (wöchentlich) eingestellt;
- Wingding_Symbol (159) - Symbol, das angezeigt werden soll.