RCCMA Custom Moving Average for RCC
- Indikatoren
-
Yutaka Okamoto
 I specialize in developing high-quality indicators for both MT5 and MT4 platforms.
With a strong background in programming and a keen eye for market analysis,
I strive to create innovative and effective tools that help traders make informed decisions and achieve success in their trading journey. - Version: 1.1
- Aktualisiert: 28 April 2023
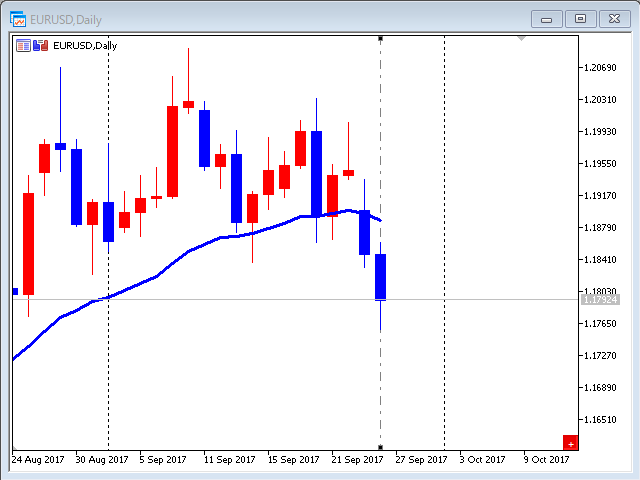
RCCMA ist ein allgemeiner gleitender Durchschnittsindikator, der mit ReviewCandleChart funktioniert.
Das Original ist "Custom Moving Average", bereitgestellt von MetaQuotes Software Corp. Basierend auf diesem Quellcode, habe ich ReviewCandleChart angepasst.
Vorteile
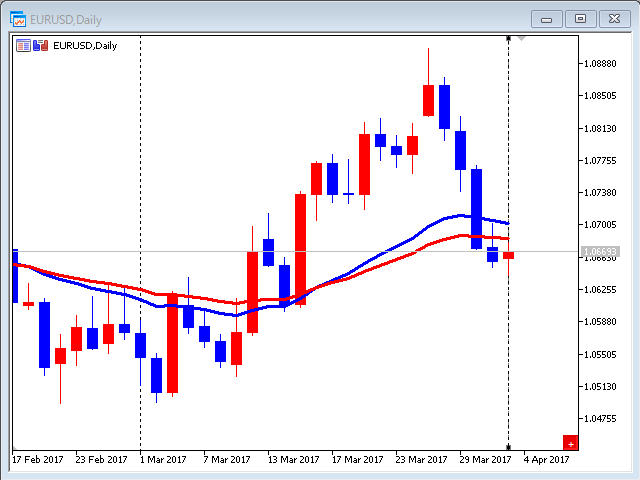
- Wenn ReviewCandleChart eingeschaltet ist, wird rechts von der vertikalen Referenzlinie keine Linie angezeigt.
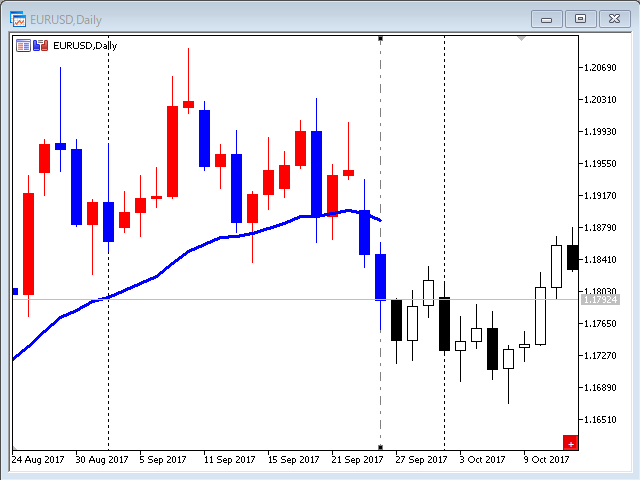
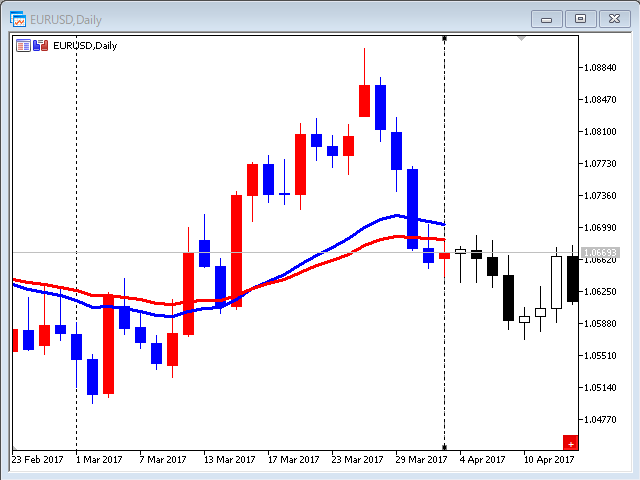
- Wenn ReviewCandleChart eingeschaltet ist und Sie eine Taste wie "Z" oder "X" drücken, wird die MA gezeichnet.
- Wenn ReviewCandleChart ausgeschaltet ist, wird die gleiche Zeichnung wie beim ursprünglichen "Custom Moving Average" erstellt.
Tipps für die Verwendung
Das Produkt hat sich in Verbindung mit dem ReviewCandleChart als effizient erwiesen.
Parameter des Indikators
- Zeitraum - [13]
- Verschiebung - [0]
- Methode - [Geglättet]
- Einfach
- Exponential
- Geglättet
- Linear gewichtet
Entwickler
Yutaka Okamoto, professioneller Programmierer.


Der Benutzer hat keinen Kommentar hinterlassen