
Pin Bar
- Indikatoren
- Version: 1.31
- Aktualisiert: 16 Juni 2019
- Aktivierungen: 7

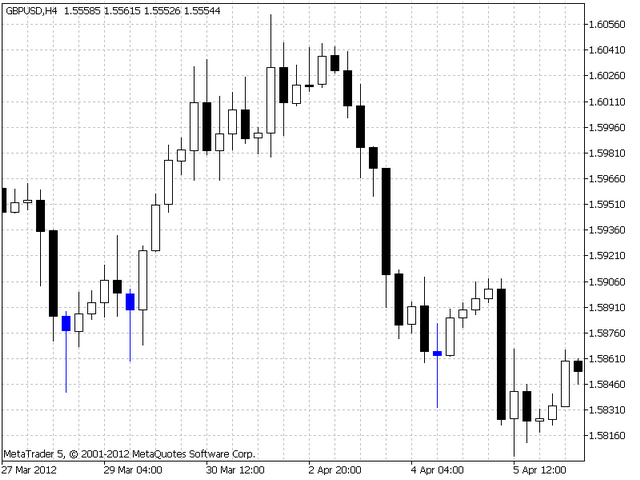
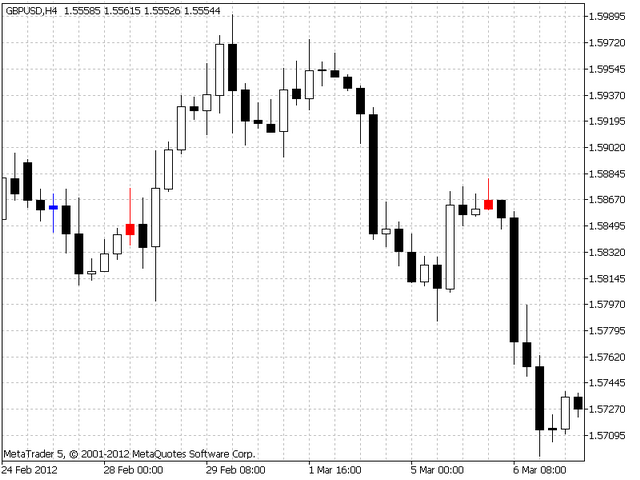
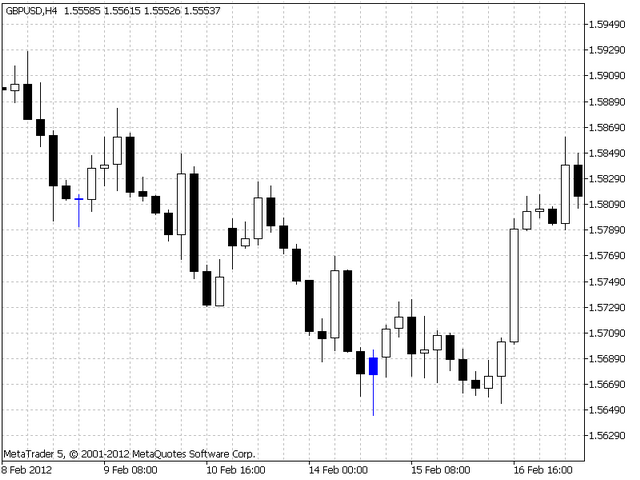
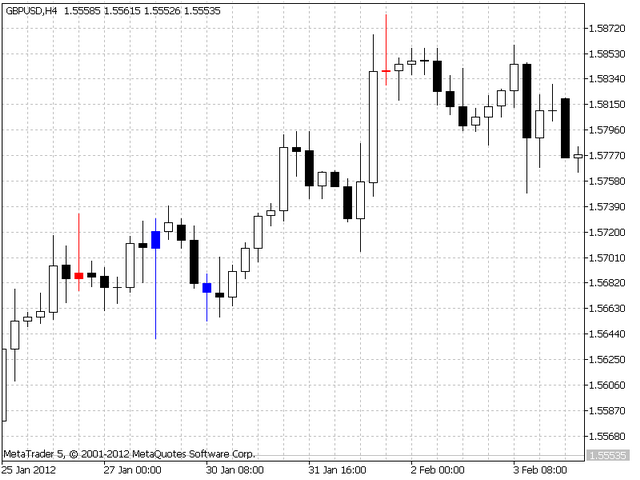
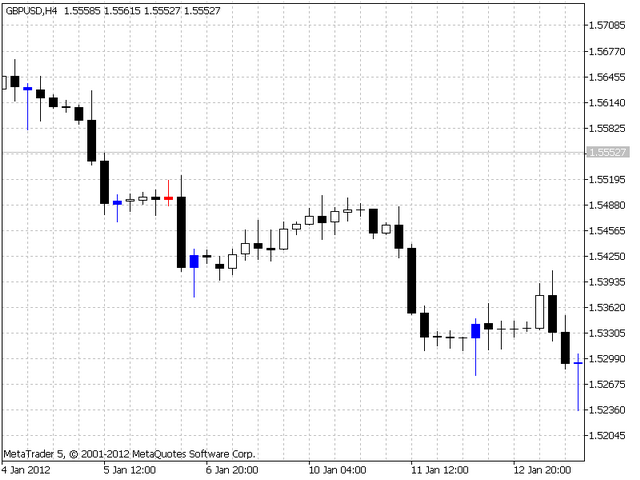
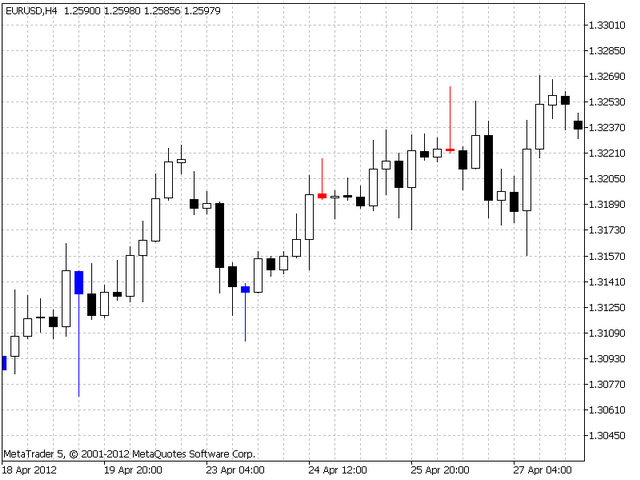
Dieser Indikator zeigt das Pin-Bar-Kerzenmuster auf dem Chart an.
Die bärischen Pin Bars haben eine rote Farbe, die bullischen Pin Bars haben eine blaue Farbe. Der Indikator zeigt einen Alarm an, wenn sich ein Pin Bar Candlestick-Muster bildet.
Es wird empfohlen, ihn auf den Zeitrahmen H1 und höher zu verwenden.
Der beste Zeitpunkt (starkes Signal) ist, wenn sich der Pin Bar in der Nähe des Unterstützungs-/Widerstandsniveaus bildet.


Very good indicator. Thank you