TTMM Time To Make Money
- Indikatoren
- Version: 1.1
- Aktualisiert: 28 November 2021
- Aktivierungen: 5

TTMM - "Time To Make Money" - Zeit, in der Trader an den Börsen Geld verdienen
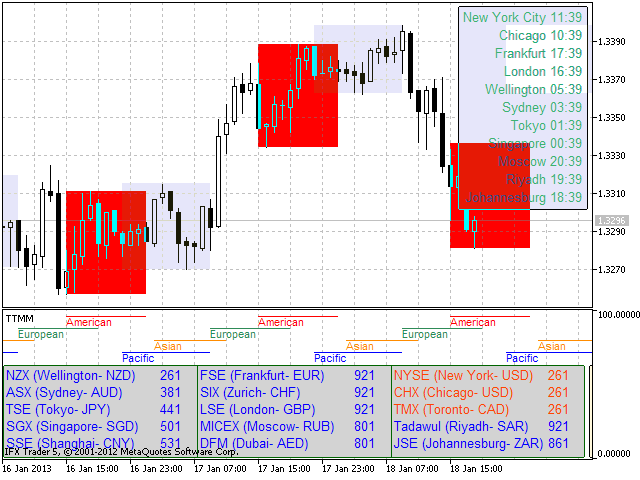
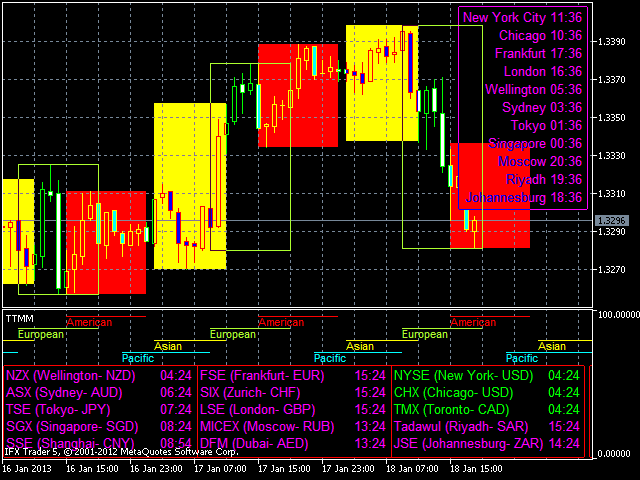
Der Indikator ТТММ Handelssitzungen zeigt die folgenden Informationen an:
- Handelssitzungen: Amerikanisch, europäisch, asiatisch und pazifisch. (Hinweis: Die Sitzungen werden nur für die letzten fünf Tage und den aktuellen Tag angezeigt. Die Anzahl der Tage kann sich je nach den Feiertagen ändern - sie werden in den Terminals nicht angezeigt. Die Sitzungen werden auch nicht am Samstag und Sonntag angezeigt).
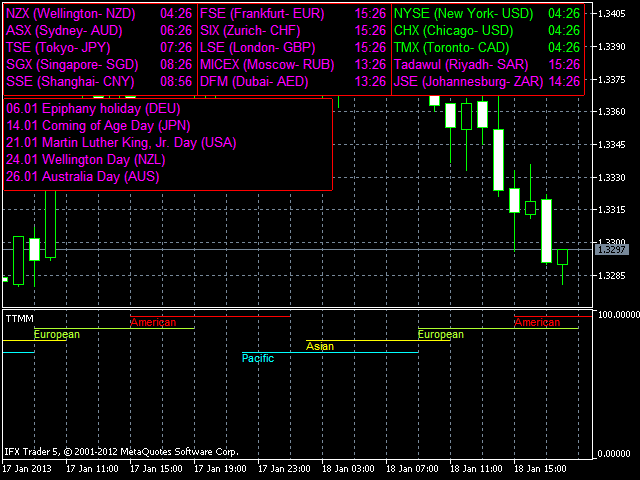
- Die Haupthandelszeiten der Börsen (Zeit vor Beginn oder Ende), wie z.B.: NZX - Wellington ASX - Sydney, TSE - Tokio, SGX - Singapur, SSE - Shanghai, MICEX - Moskau, DFM - Dubai, Tadawul - Riyadh JSE - Johannesburg, FSE - Frankfurt, SIX - Zürich LSE - London, NYSE - New York, TMX - Toronto, CHX - Chicago.
- Einige der kommenden Feiertage in den USA (USA), dem Vereinigten Königreich (GBR), Deutschland (DEU), Japan (JPN), Australien (AUS), Kanada (CAN Of), Neuseeland (NZL) und China (CHN). Die Daten werden im folgenden Format angezeigt: Tag. Monat - Feiertag (Land).
- Zeit in Städten: New York, Chicago, Frankfurt, London, Wellington, Sydney, Tokio, Singapur, Moskau, Riyadh und Johannesburg. Hinweis: Im Strategy Tester werden Handelssitzungen nicht oder fehlerhaft angezeigt. Bei Problemen mit der Anzeige im Indikator, drücken Sie "R" Taste auf der Tastatur auf dem Chart aktiv ist, startet der Indikator neu.
Parameter des Indikators
- Datenaktualisierungsrate (sec) - Aktualisierungszeit der technischen Daten für die Berechnung (<60 wird empfohlen);
- Zeichenmodus für Börse und Feiertag - Ort für die Anzeige von Informationen über die Börsen und Feiertage (Hauptfenster und Unterfenster);
- Farbe der amerikanischen Sitzung - die Farbe der amerikanischen Sitzung;
- Farbe der europäischen Sitzung - die Farbe der europäischen Sitzung;
- Farbe der asiatischen Sitzung - die Farbe der asiatischen Sitzung;
- Farbe der pazifischen Sitzung - die Farbe der pazifischen Sitzung;
- Die Hintergrundfarbe des ersten Fensters - die Farbe des Fensters, das die Handelszeiten der Börsen anzeigt;
- Die Rahmenfarbe des ersten Fensters - die Farbe des Fensterrahmens, der die Handelszeiten der Börse anzeigt;
- Farbe Börse bei der Arbeit - die Farbe der Börse, die sich gerade in der Haupthandelszeit befindet;
- Farbe Börse im Ruhezustand - die Farbe der Börse, die im Moment nicht zu den Handelszeiten geöffnet ist;
- Typ Uhrmodus Börse - Modus der Zeitanzeige vor Beginn der Haupthandelszeiten der Börsen (hh:mm oder Minuten);
- Die Hintergrundfarbe des zweiten Fensters - die Farbe des Fensters, das die Feiertage anzeigt;
- Farbe des Rahmens des zweiten Fensters - die Farbe des Rahmens des Fensters, das die Feiertage anzeigt;
- Farbe der Feiertage - die Farbe der Feiertage;
- Weltzeit anzeigen - ob die Weltzeit angezeigt werden soll (Zeit in den unter Punkt 4 aufgeführten Städten);
- Die Hintergrundfarbe der Weltzeit - die Farbe des Hintergrunds der Weltzeit;
- Die Rahmenfarbe der Weltzeit - die Farbe des Fensterrahmens der Weltzeit;
- Die Farbe der Weltzeit - die Farbe der Weltzeit;
- Zeichnen der Quadrate der Sitzungen - ob die Sitzungen mit Quadraten auf dem Hauptfenster des Diagramms gezeichnet werden sollen;
- Drawing background squares American session - zum Einfärben der Quadrate der amerikanischen Sitzung;
- Drawing background squares European session - zum Einfärben der Quadrate der europäischen Sitzung; Drawing background squares European session - zum Einfärben der Quadrate der europäischen Sitzung;
- Hintergrundquadrate asiatische Sitzung zeichnen - Quadrate der asiatischen Sitzung einfärben;
- Zeichnen von Hintergrundquadraten der pazifischen Sitzung - zu den Farbquadraten der pazifischen Sitzung;
- Farbquadrat der amerikanischen Sitzung - die Farbe der Quadrate der amerikanischen Sitzung;
- Farbquadrat der europäischen Sitzung - die Farbe der Quadrate der europäischen Sitzung;
- Farbquadrat der asiatischen Sitzung - die Farbe der Quadrate der asiatischen Sitzung;
- Farbquadrat der Pazifiksitzung - die Farbe der Quadrate der Pazifiksitzung.