Ticks Stochastic
- Indikatoren
- Version: 1.12
- Aktualisiert: 18 November 2021
- Aktivierungen: 5

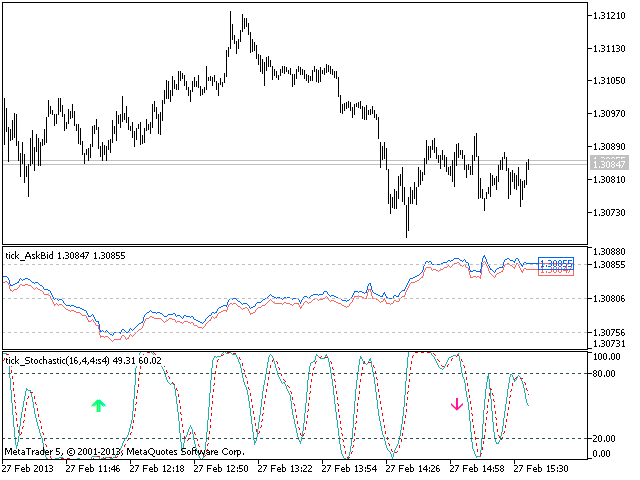
Der Stochastik-Oszillator wird auf dem Tick-Preis-Chart eingezeichnet.
Warten Sie nach dem Starten, bis genügend Ticks vorhanden sind.
Parameter:- K-Periode - Anzahl der einzelnen Perioden, die für die Berechnung des stochastischen Oszillators verwendet werden;
- D-Periode - Anzahl der einzelnen Perioden, die für die Berechnung der Linie des gleitenden Durchschnitts %K verwendet werden;
- Verlangsamung - Periode der Verlangsamung von %K;
- Berechneter Balken - Anzahl der Balken im Diagramm für die Berechnung des Indikators.
Die folgenden Parameter sind für die Einstellung der Gewichtung der Signale des stochastischen Oszillators bestimmt (0 - 100). Ihre Beschreibung finden Sie in der MQL5-Referenz im Abschnitt Signale des Oszillators Stochastik.
- Der Oszillator hat die gewünschte Richtung.
- Umkehrung des Oszillators in die gewünschte Richtung.
- Kreuzung von Haupt- und Signallinie.
- Divergenz von Oszillator und Preis.
- Doppelte Divergenz des Oszillators und des Preises.
Pufferindizes: 0 - MACD_LINE, 1 - SIGNALLINE, 2 - SIGNAL_UP, 3 - SIGNAL_DOWN.