Up Down v6
- Indikatoren
- Version: 16.0
- Aktualisiert: 6 Februar 2026
- Aktivierungen: 5
Im Demomodus wird das Datum verwendet, um zu arbeiten.
In Version 13 wurde die Welle hinzugefügt.13.1 Histogramm und Triggerlinie können geändert werden.
Welle kann 200-500 eingestellt werden. kann verschiedene Signale auf Welle 200 haben
in der Version 14 wird das EMA verwendet, so dass man auch die Signale des Mountly-Charts sehen kann.
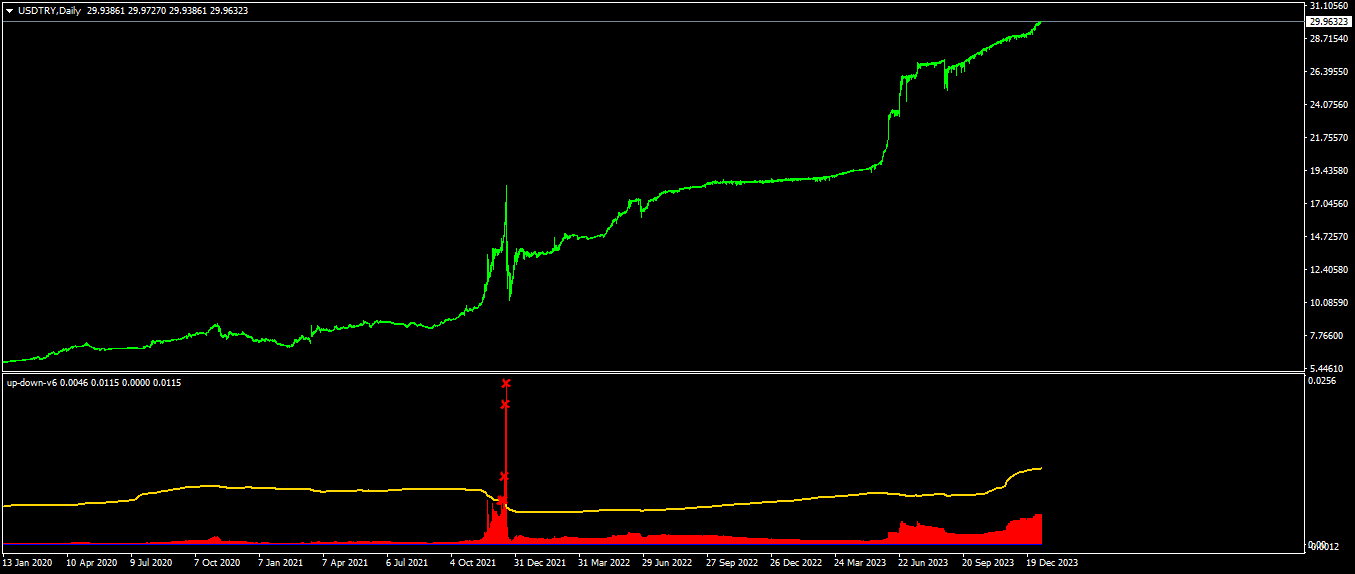
Up-Down-Indikator ist kein repaint und arbeitet alle Paare und alle Zeitrahmen Charts.
Es ist auch geeignet 1 m Charts für alle Paare.
und halten lange Weg zum Signal.
gibt nicht zu viele Signale.
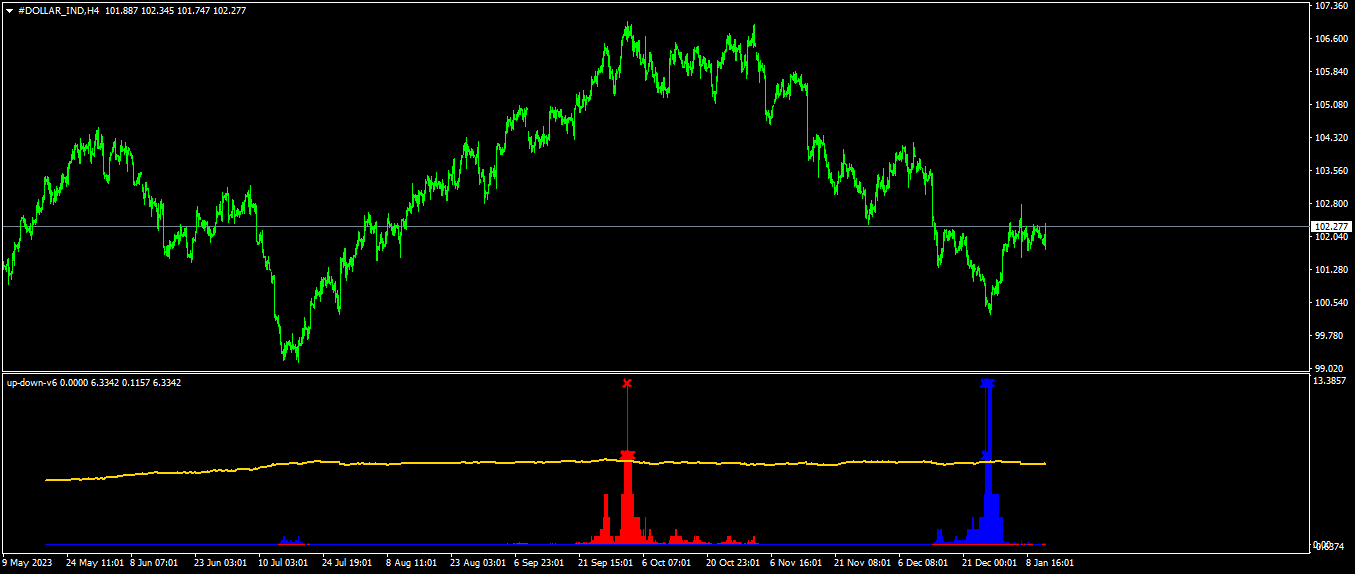
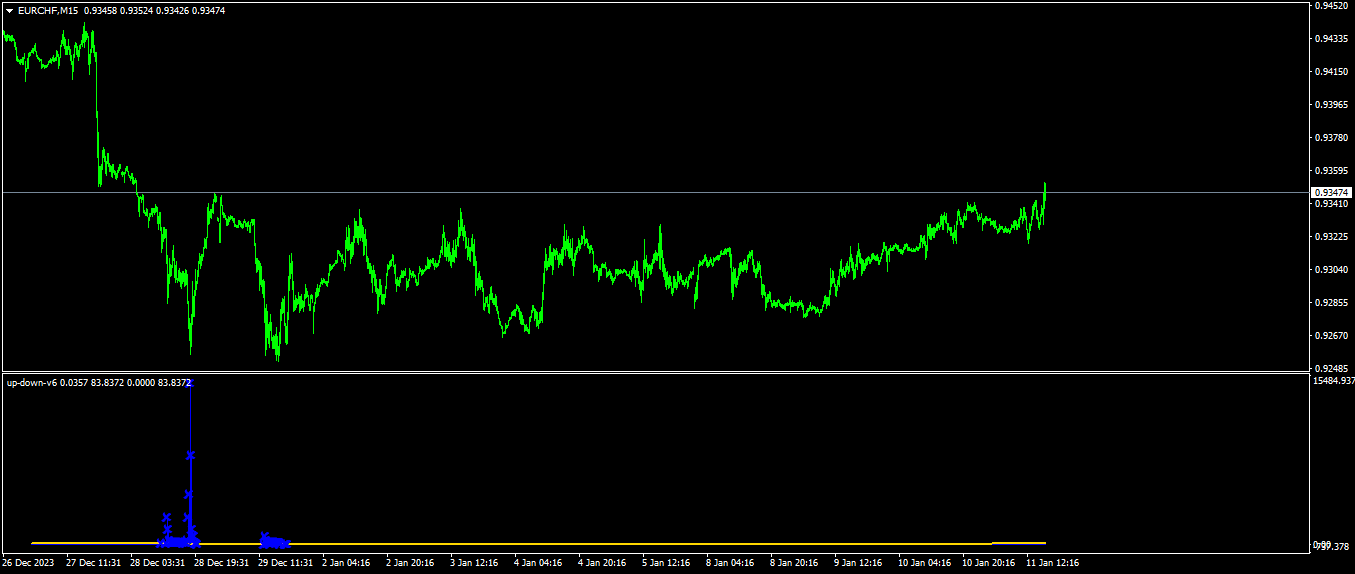
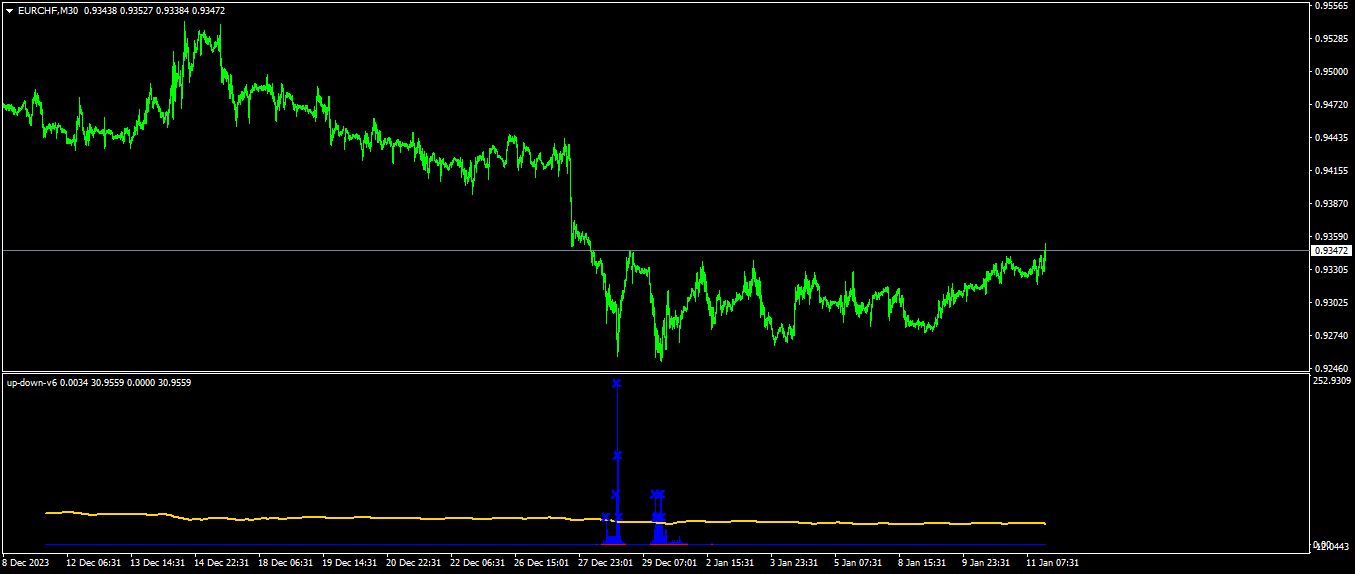
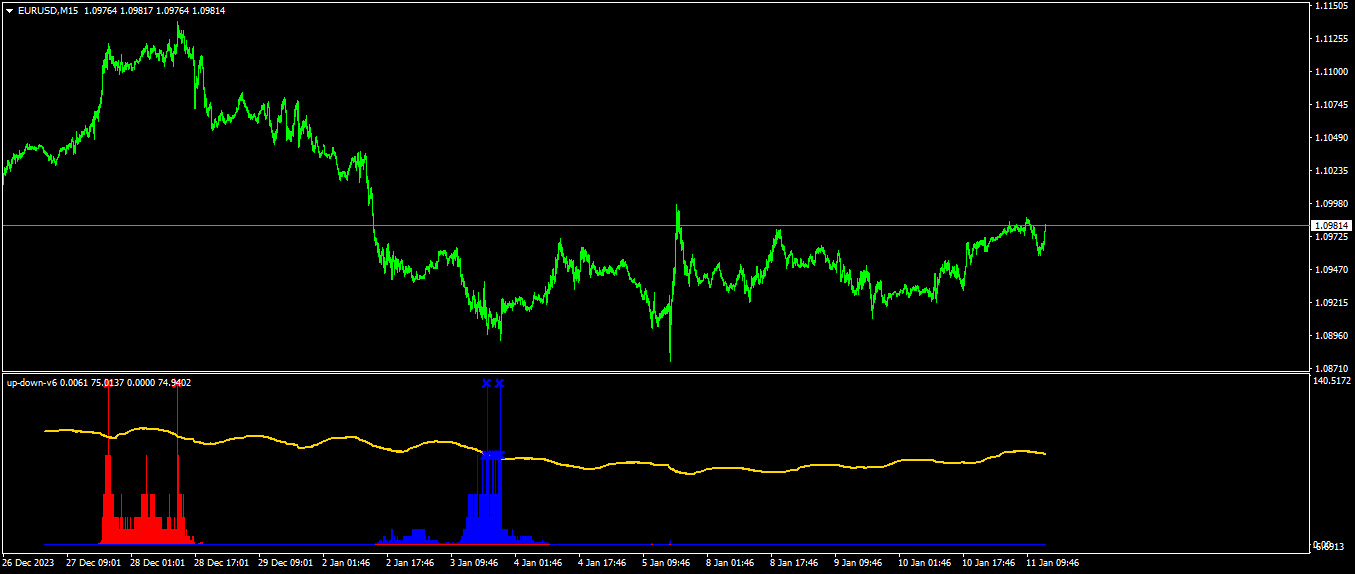
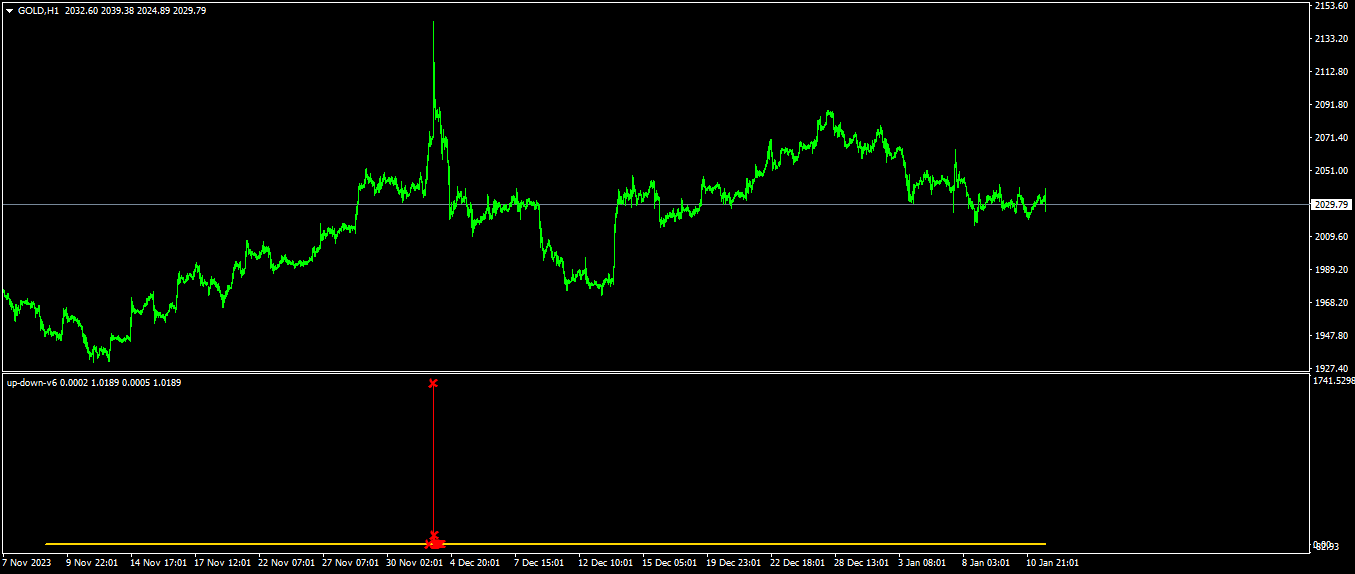
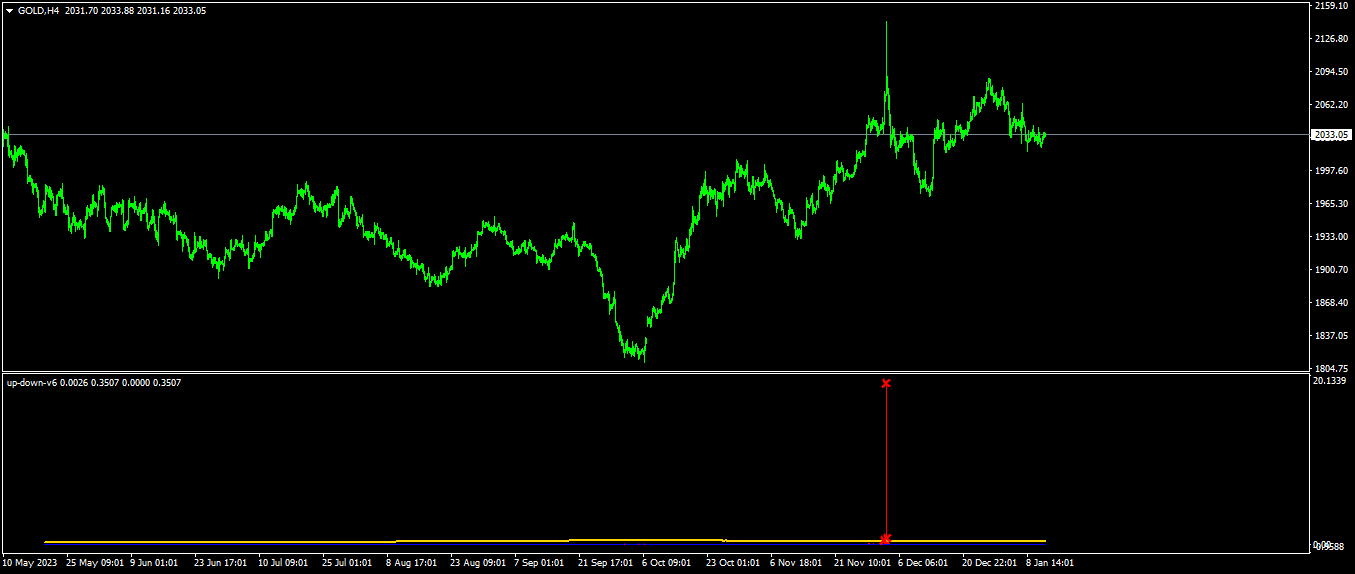
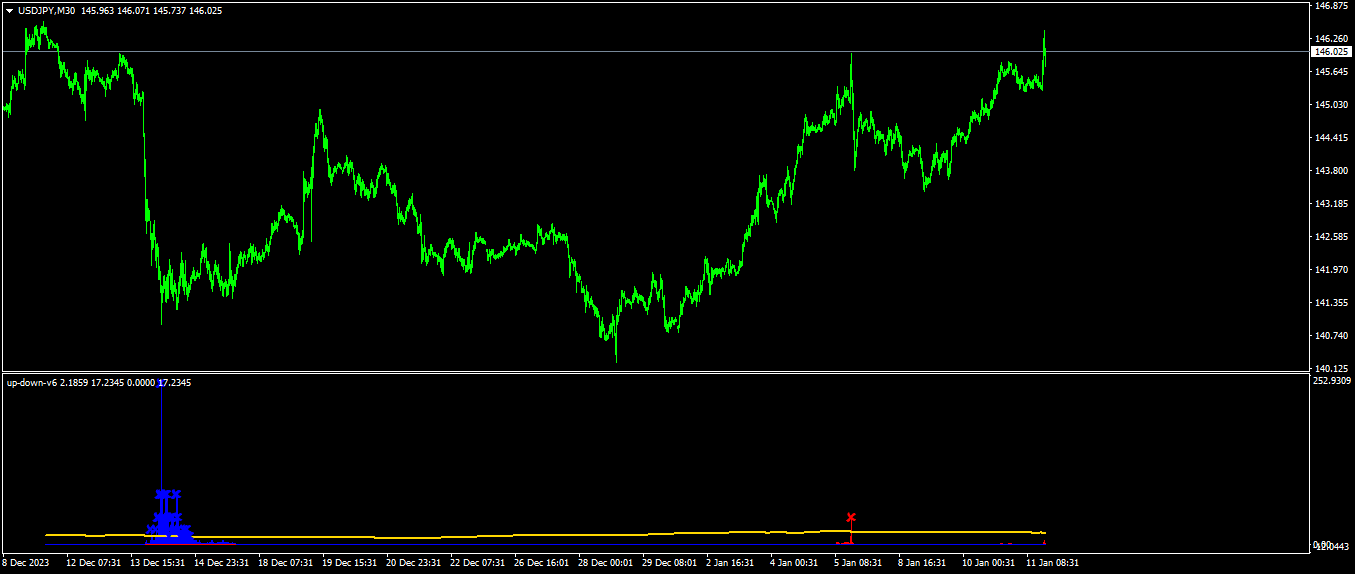
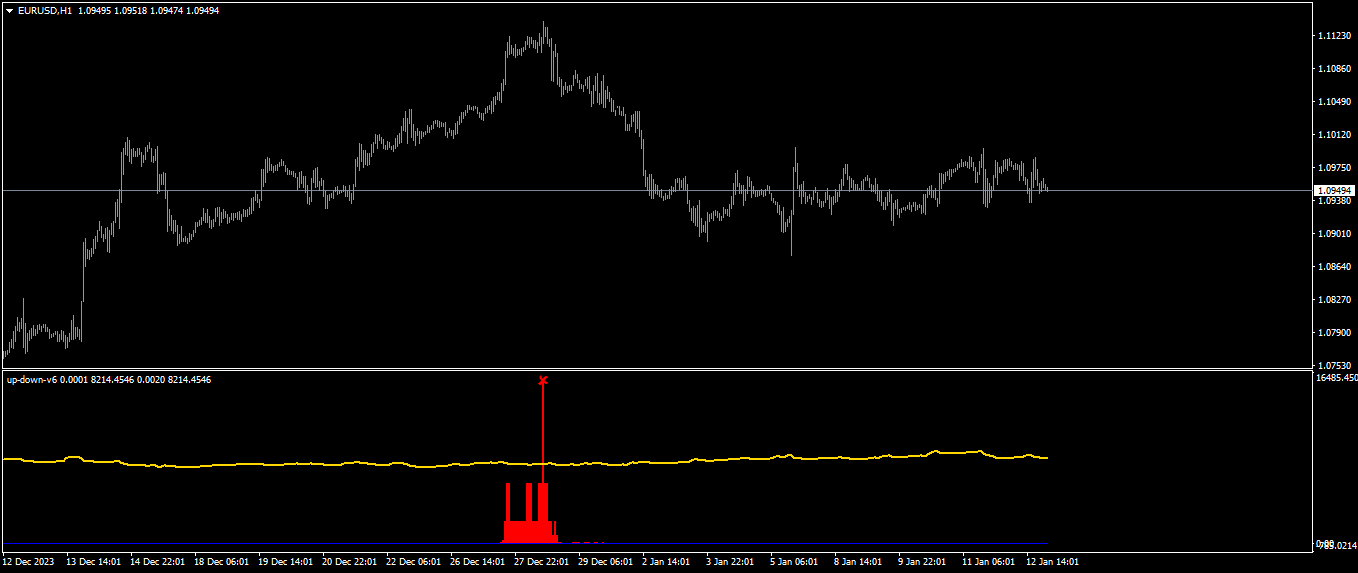
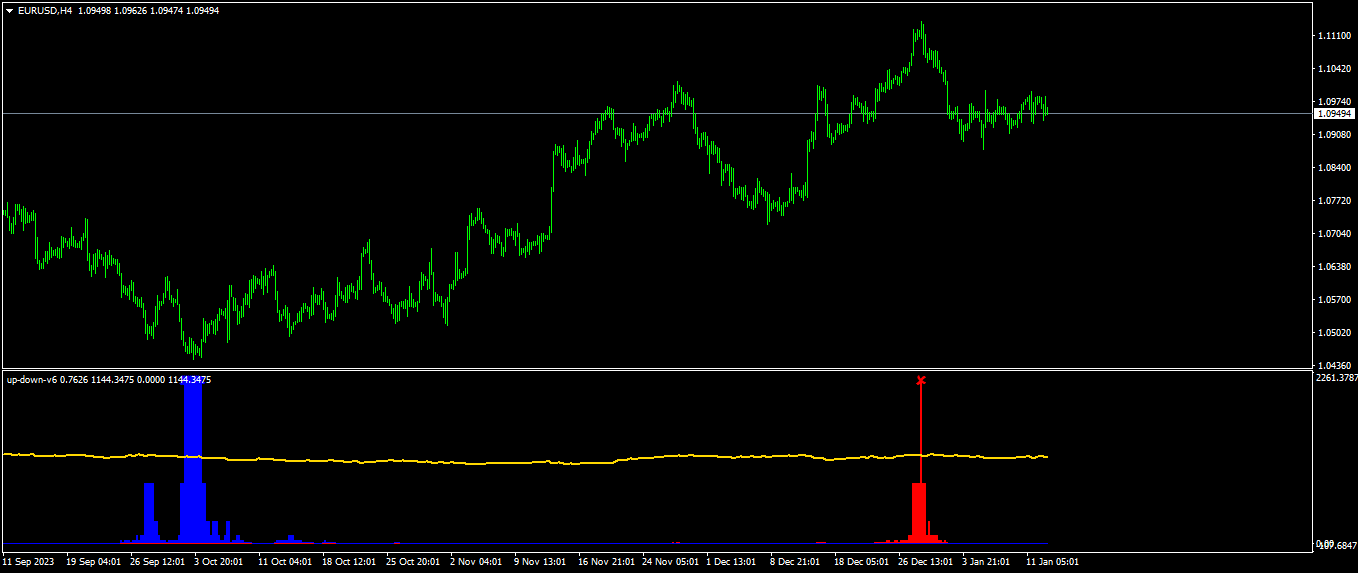
Wenn das rote Histogramm die Triggerlinie kreuzt, ist das ein Aufwärtssignal und der Preis wird wahrscheinlich fallen.
wenn blaue Histogramm Kreuz Trigger-Linie, die nach unten signal.and Preis wahrscheinlich gehen up.
Wenn die Signale nicht gesehen, drücken Sie + Taste auf dem Terminal.
Ich habe den c-Wert eingestellt. Standardwert ist 2,7.
Sie können auch die Signale mit dem C-Wert erhöhen oder verringern, wie Sie wollen acordig auf dem Chart
Dieser Wert muss je nach dem von Ihnen verwendeten Paar geändert werden.
Setzen Sie den Wert in der täglichen periot oder h4 periot nach oben und unten Plätze gesehen hat.
Danach verwenden Sie den gleichen c-Wert für dieses Paar.
Sie werden manchmal h4 Signal manchmal 15 m.verschiedene Periots sehen.
Wenn das Signal wurde gesehen, jede periot Chart handeln acording zu ihm.
Dieses System ist eine mathematische Art von aproach zu Preisen zu finden, bis, unten Punkte.


Amazing indicator! i tested it for 6 months.You need to monitor this indicator well enough to understand how it works. Thanks Guner Koca!
Highly recommended!