MACD Divergence Full
- Indikatoren
-
Mihails Babuskins
 Senior developer for financial markets.
Contact me: Forex.terminology@outlook.com
🔵 Telegram group link: https://t.me/CommunityAndChat - Version: 1.5
- Aktualisiert: 8 Januar 2025
- Aktivierungen: 19
- Kontaktieren Sie mich nach der Bezahlung, damit ich Ihnen das Benutzerhandbuch als PDF-Datei zusenden kann.
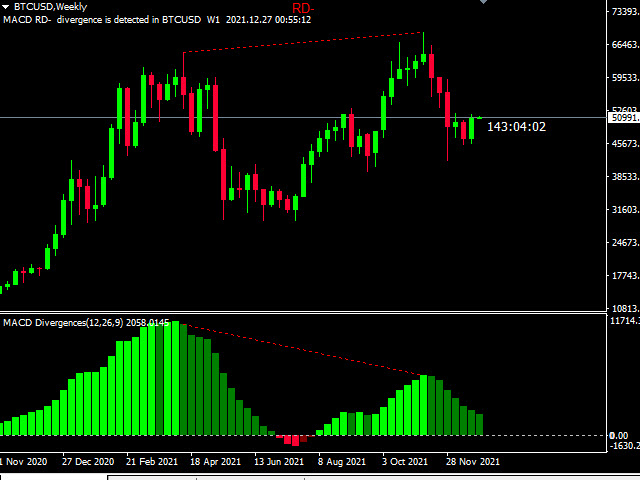
Indikator zur Erkennung von Divergenzen mit einem speziellen Algorithmus.
Aber es ist sehr schwierig, Gelegenheiten für den Handel mit den Augen zu finden, und manchmal verlieren wir diese Gelegenheiten.
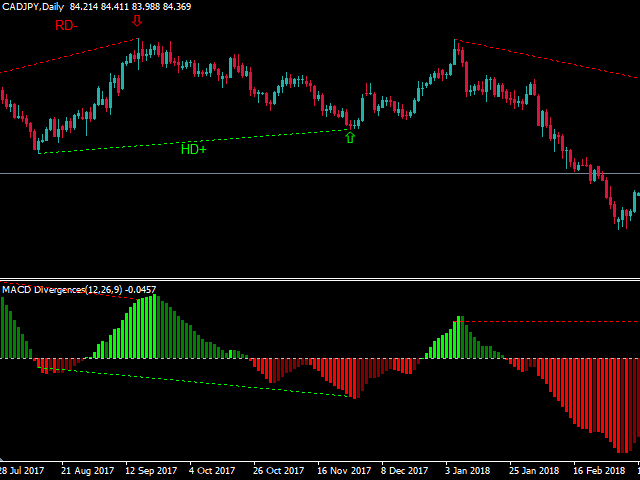
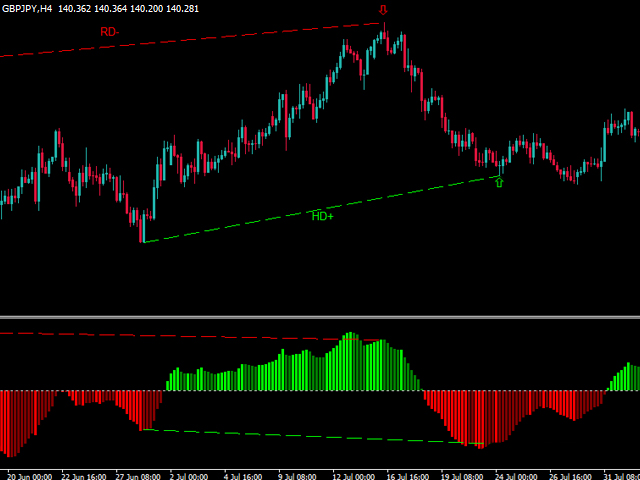
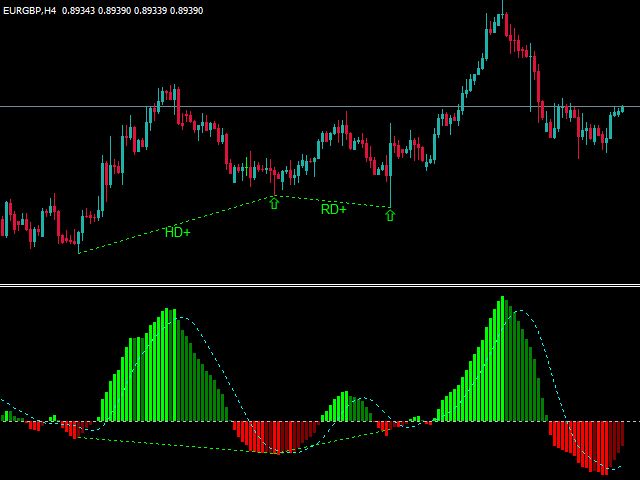
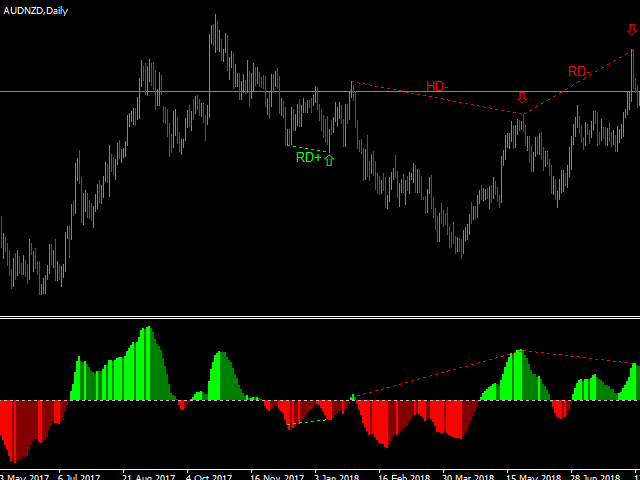
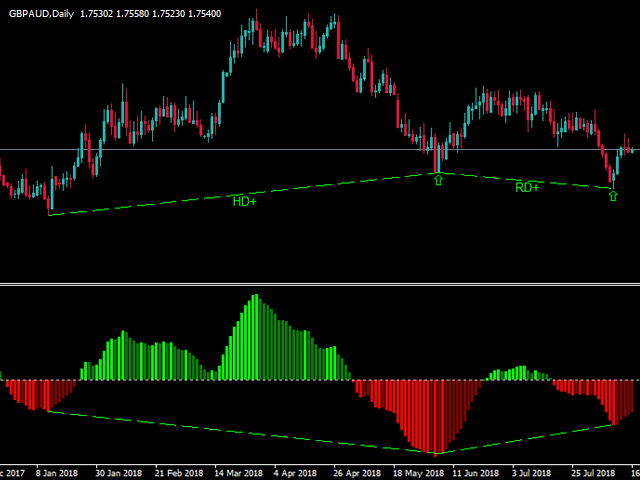
Der Indikator findet alle regelmäßigen und versteckten Divergenzen. (RD & HD)
Er verwendet eine fortschrittliche Methode zur Bestimmung von Divergenzen.
Dieser Indikator ist sehr funktionell und kann das Ergebnis Ihres Handels erheblich verbessern.
Es handelt sich um einen Multi-Time-Frame-Indikator (unter M15 wird er nicht empfohlen).
Sie können die Farben nach Belieben ändern.
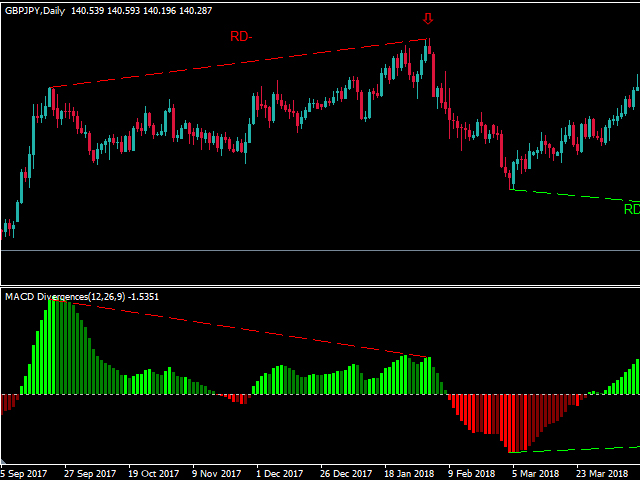
Erkennungsmethode:
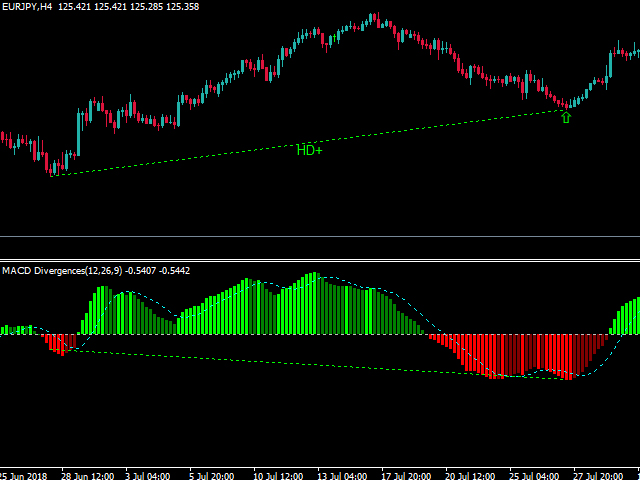
Der Indikator erkennt Preis-Pivots und überprüft den entsprechenden Wert der Pivots des MACD-Indikators (12,26,9).
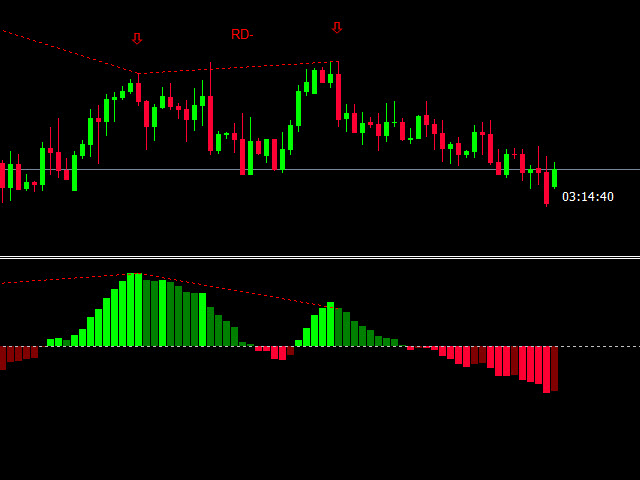
Wenn eine Divergenz festgestellt wird (Preisbewegung und Oszillator in die entgegengesetzte Richtung), wird sie durch Linien im Chart und im Oszillator dargestellt.
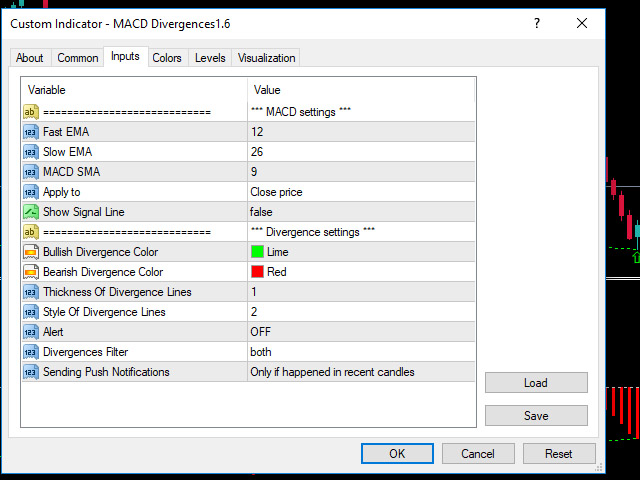
Parameter des Indikators
- MACD-Einstellungen:
- Schneller EMA
- Langsamer EMA
- MACD SMA
- Anwenden auf
- Signallinie anzeigen
- Divergenz Einstellungen:
- Bullische Divergenz Farbe
- Farbe der bärischen Divergenz
- Dicke der Divergenzlinien
- Stil der Divergenz-Linien
- Warnung (Sie können die Warnung aktivieren oder deaktivieren)
- Divergenz-Filter (Sie können wählen, ob reguläre oder versteckte Divergenzen oder beides angezeigt werden sollen)
- Senden von Push-Benachrichtigungen (der Benutzer kann wählen, ob Push-Benachrichtigungen gesendet werden sollen oder nicht)
Wie testet man den MACD Divergences Indikator?
Wenn Sie den Indikator testen möchten, laden Sie die Demoversion herunter , die kostenlos ist und für EURAUD voll funktionsfähig ist.


It's a great indicator which so far has been very accurate. Again, support from the author is amazing. This diserves 5*****