All in one smart Smc indicator Ict mmxm

Features List 1:

  • FVG->iFVG
  • Order Block
  • High Transaction Line (Personal strategy)
  • Premium Discount
  • 50% and 61%
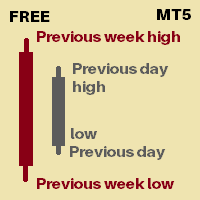
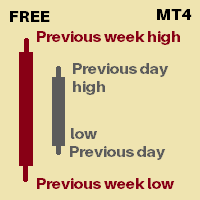
  • Previous day high low
  • Previous week high low
  • Candle end countdown

Feature List 2 : (Implemented based on feedback from community groups)

  • trend identification
  • Hide FVG, Order Block, Large Transaction line below 50% equilibrium.
  • Hide all/Individual texts/features

FUTURE Feature List (Will be implemented only if at least 5 people request for it.)

  • Asia, London, NY lq zones
  • Alerts for features price touch
  • Multi-timeframe
  • Textbox that saves your notes
  • Your requests/Your entry techniques(Private jobs can also be fulfilled). 


Always open to feedback and criticism if it helps me provide more value.


Thank you :)

Empfohlene Produkte
The indicator plays sound alerts when the price reaches certain levels, specified by trader. You only need to draw a trendline and then press the alert button in the panel. The texts of the notification you determine. Notification via a smartphone or email address is possible. Note for "Free Demo" : MetaTrader 4 does not support displaying an alert window or playing sounds in the strategy tester, only in live or demo accounts. How it works Draw a trendline Click the "Alert" button (Trendline m
The indicator allows you to trade binary options. The recommended time frame is М1 and the expiration time is 1,2,3 minutes. The indicator suitable for auto and manual trading. A possible signal is specified as a arrows above/under a candle. You should wait until the candle closes! Arrows are not re-painted Trade sessions: TOKYO section (Half-end) Currency pairs: USD/JPY Working time frame: M1 Expiration time: 1,2,3 minutes. The indicator also shows good results when using the martingale strateg
FREE
Profile Map
Dmitriy Sapegin
5 (11)
Market Profile helps the trader to identify the behavior if major market players and define zones of their interest. The key feature is the clear graphical display of the range of price action, in which 70% of the trades were performed. Understanding of the location of volume accumulation areas can help traders increase the probability of success. The tool can be used as an independent system as well as in combination with other indicators and trading systems. this indicator is designed to suit
Blahtech Market Profile
Blahtech Limited
4.53 (15)
Was: $249  Now: $149   Market Profile defines a number of day types that can help the trader to determine market behaviour. A key feature is the Value Area, representing the range of price action where 70% of trading took place. Understanding the Value Area can give traders valuable insight into market direction and establish the higher odds trade. It is an excellent addition to any system you may be using. Blahtech Limited presents their Market Profile indicator for the MetaTrader community. In
Trend Zones
Augustine Kamatu
Introducing Trend Zones: Your Ultimate Tool for Precise Market Entry and Exit Points. Trend Zones is a revolutionary MetaTrader 4 indicator designed to provide traders with clear buy and sell zones based on trend reversals and price action. Built upon advanced algorithms and non-repainting technology, this indicator offers unparalleled accuracy in identifying optimal entry and exit points in the forex market. Key Features: 1. Non-Repainting Signals: Trend Zones delivers non-repainting signals,
Volume Compair
Thiago Pereira Pinho
Professional Cumulative Delta & Volume Median Indicator Track   real buying/selling pressure   with this powerful volume analysis tool. The   Volume Compare Indicator   combines   Cumulative Delta   and   Volume Medians   to help you identify institutional activity, imbalances, and potential reversals. Key Features:   Cumulative Delta Histogram   – Visualizes net buying vs. selling volume in real-time.   Buy/Sell Volume Medians   – Horizontal lines showing average buy & sell volume lev
VWAP Indicator MT4
Kyra Nickaline Watson-gordon
5 (1)
Description : VWAP (Volume-Weighted Average Price) is the ratio of the value traded to total volume traded over a particular time horizon. It is a measure of the average price at which pair is traded over the trading horizon. Read More. All Symbols and All Timeframes are supported. Indicator Inputs :     VWAP Mode : Mode of VWAP Calculation. Options can be selected : Single,Session,Daily,Weekly,Monthly     Volumes : Real Volumes,Tick Volumes     Price Type : Used price for calculating.
Simply The Best Pro
Szymon Palczynski
5 (1)
This indicator displays the histogram and arrows on chart. When Simple The Best Pro are placed on a chart, they identify the trend.  The color of may be blue or red. The blue color stands for upside moves and the red color stands for downside trends. The indicator offers to set Stop Loss (SL) and  Take Profit (TP)  setting. The default value is ATR. Indicator has automatic optimization. The STB is a unique indicator that shows the tendency (button Bars) of a particular signals. The STB tells us
Last 50 Pips
Martin Alejandro Bamonte
Der Indikator Last 50 Pips ist dafür ausgelegt, Kauf- und Verkaufsmöglichkeiten basierend auf dem jüngsten Preisverhalten schnell zu identifizieren. Er misst die Preisänderungen in den letzten Kerzen, um Momente, in denen der Preis möglicherweise die Richtung ändert, in Gelb hervorzuheben. Kaufsignal: Sie sollten eine KAUF -Position eröffnen, wenn der Indikator von ROT auf GELB wechselt, was auf einen Wechsel von einem Abwärtstrend zu einem Aufwärtstrend hinweist. Bitte sehen Sie sich die Bilde
Pinbar Pattern Scanner: Your Ultimate Forex Trading Tool The Pinbar Pattern Scanner is a cutting-edge, non-repainting, non-lagging price action tool designed for both novice and expert traders. With its unique ability to scan across 9 timeframes, this tool alerts you of potential price rejections in any forex symbol, all from a single chart. Key Features: Versatility: Originally developed for forex, it's also suitable for binary options for those well-versed in price action. Customizable: Tai
Der Indikator erstellt aktuelle Notierungen, die mit historischen verglichen werden können, und auf dieser Grundlage eine Preisbewegungsprognose erstellen. Der Indikator verfügt über ein Textfeld zur schnellen Navigation zum gewünschten Datum. Optionen: Symbol - Auswahl des Symbols, das der Indikator anzeigen soll; SymbolPeriod - Auswahl des Zeitraums, aus dem der Indikator Daten aufnimmt; IndicatorColor - Indikatorfarbe; HorisontalShift - Verschiebung der vom Indikator gezeichneten Kurse u
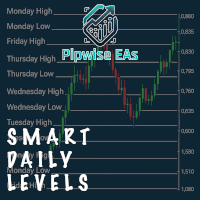
Smart Daily Levels – Extended Highs & Lows from Past Days Never lose sight of market structure again. Smart Daily Levels automatically draws horizontal lines at the high and low of each day — and extends them forever to the right side of your chart. Perfect for traders who use: • Support & resistance • Breakout traps • Liquidity zones • Smart Money / price action strategies Core Features • Daily high & low lines from the past X days (default: 10) • Lines start at each day’s open an
ForexFlipAlert
Adriano De Mello Moura
FOREX FLIP ALERT   - Show where the price will reverse with more than 95% probability. This information will help every trader to effectively open trades. The indicator on the chart draws arrows in which place and in which direction the price will reverse. The indicator   does not redraw  its arrows and shows price reversals for medium and long distances. This means that after the arrow appears, the price will go in the indicated direction for many points. Benefits of the indicator: Gives sign
BoxChart MT4
Evgeny Shevtsov
4.4 (5)
The market is unfair if only because 10% of participants manage 90% of funds. An ordinary trader has slim changes to stand against these "vultures". This problem can be solved. You just need to be among these 10%, learn to predict their intentions and move with them. Volume is the only preemptive factor that faultlessly works on any timeframe and symbol. First, the volume appears and is accumulated, and only then the price moves. The price moves from one volume to another. Areas of volume accumu
VR Grid
Vladimir Pastushak
5 (3)
Der VR-Raster-Indikator ist entwickelt , um ein grafisches Raster mit benutzerdefinierten Einstellungen zu erstellen. Im Gegensatz zum Standardgitter wird VR Grid zum Erstellen von kreisförmigen Ebenen verwendet. Je nach Wahl des Benutzers kann der Schritt zwischen den Rundenstufen beliebig sein. Darüber hinaus behält VR Grid im Gegensatz zu anderen Indikatoren und Dienstprogrammen die Position des Rasters bei, selbst wenn sich der Zeitraum ändert oder das Terminal neu gestartet wird. Einstellun
FREE
VWAP Bands WTC
Stefano Cocconi
5 (1)
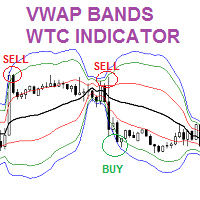
Check My Product Contact me to discover all my services  The VWAP Volume weighted Average Price Bands indicator is similar to the Moving Averages and Bollinger bands. In this indicator, more weight is given to the volume. The indicator provides great insight on support and resistance levels in the chart. Moreover, the indicator shows the fair value of a trading instrument. Thus, enabling forex traders to identify great trading opportunities to BUY LOW and SELL HIGH. Forex traders can combine t
Market Viewer
Matimu Romeo Ngoveni
Market Viewer This utility seeks to assist the trader in identifying potential areas of interest on the price chart. Different components integral to decision making have been automated, allowing the user to engage with perfectly calculated levels. Some components include the weeks initial balance, session Min and Max areas and a round number indicator altogether forming templates providing confidence to the trader. Have a look at the screenshots for a sneak peak into the components. The utility
Blahtech Supply Demand
Blahtech Limited
4.58 (36)
Was: $299  Now: $149   Supply Demand uses previous price action to identify potential imbalances between buyers and sellers. The key is to identify the better odds zones, not just the untouched ones. Blahtech Supply Demand indicator delivers functionality previously unavailable on any trading platform. This 4-in-1 indicator not only highlights the higher probability zones using a multi-criteria strength engine, but also combines it with multi-timeframe trend analysis, previously confirmed swings
Horizontal tick volumes (HTV) Horizontal tick volumes - an easy and convenient indicator of a horizontal market profile in a user-selected time. Produces a visual image of strong trading levels by maximum peaks past volumes and trading direction by color (sell or buy), and also allows you to detect smaller trading levels by differentiating past volumes. In the "Optimal" mode, when displayed on chart periods up to and including "M30", the data of one-minute bars are used, on H1 and H4 - five-minu
SmartSignal Sniper
Ahmed Ismail Muhammad Ismail Al Talhat
SmartSignal Sniper: Dein ultimativer Trading-Partner Entdecke die Kraft präzisen Tradings mit SmartSignal Sniper. Entwickelt, um genaue Kauf- und Verkaufssignale zu liefern, ermöglicht dieses fortschrittliche Tool Tradern aller Erfahrungsstufen, mit Zuversicht und Klarheit durch die Finanzmärkte zu navigieren. Hauptmerkmale: Präzise Genauigkeit: SmartSignal Sniper verwendet fortschrittliche Algorithmen, um genaue Kauf- und Verkaufssignale bereitzustellen und Tradern zu helfen, profitablen Chance
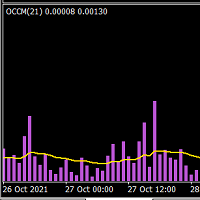
This indicator is suited for who is looking to grasp the present and past market volatility. You can apply this indicator to any instrument, you will be able to understand when the market is moving sideways and when it's pickinp up momentum. The embedded moving average allows you to filter bad trade signals. You can tweak the moving average to reach its maximum potential. As I have highlighted in the screenshot when the moving average is above the histogram the price tends to move sideways crea
Dieser Indikator basiert auf der diskreten Hartley-Transformation. Mit dieser Transformation können Sie verschiedene Ansätze bei der Verarbeitung von Finanzzeitreihen anwenden. Eine Besonderheit dieses Indikators besteht darin, dass sich seine Messwerte nicht auf einen Punkt auf dem Diagramm beziehen, sondern auf alle Punkte des Indikatorzeitraums. Bei der Verarbeitung einer Zeitreihe können Sie mit dem Indikator verschiedene Elemente der Zeitreihe auswählen. Auf diesem Ansatz baut die erste Mö
VolumeProfile
Robert Hess
3.8 (5)
Beschreibung: Das Volumen Profil zeigt detailierte Informationen von historischen trading Aktivitäten in bestimmten Preisbereichen (Markt Profil).  Damit finden Sie die Zonen mit den besten Preisen im Markt und erlangen so einen entscheidenen Vorteil gegenüber anderen Marktteilnehmern. Features: Anpassbares Volume Profil / Markt Profil Zeigt den "fairen" Preisbereich in dem 70% des gesamten Volumens umgesetzt werden Zeigt kritische Zonen mit niedrigem Volumen Zeigt Volume Point of Control (VPOC
Volumenprofil-Indikator für MT4 Erhalten Sie einen Trading-Vorteil mit dem "Volumenprofil"-Indikator für MetaTrader 4 (MT4). Dieses fortschrittliche technische Analysetool ermöglicht es Ihnen, Schlüsselunterstützungs- und Widerstandsniveaus basierend auf dem Handelsvolumen präzise zu identifizieren. Visualisieren Sie mühelos Marktbereiche mit hohem Interesse, in denen das Handelsvolumen am höchsten ist, und nutzen Sie diese Informationen, um fundiertere Handelsentscheidungen zu treffen. Hauptmer
Indicator (includes Volume Profile + Order Blocks) - a revolutionary indicator that combines two of the most powerful concepts of modern technical analysis: volume profiles and institutional players' order blocks. This tool allows you to see what is hidden from most traders and gives you a significant advantage in the market. Key benefits of the indicator: Visualization of "smart money": Clearly shows the areas of concentration of large players, highlighting areas with maximum volume in bright
Forex Volume MT4
KEENBASE SOFTWARE SOLUTIONS
KT Forex Volume zeigt das Kauf- und Verkaufsvolumen eines Währungspaares in Form eines farbigen Histogramms an. Das Volumen setzt sich aus Kauf- und Verkaufstransaktionen eines Vermögenswerts zusammen. Im Devisenmarkt gilt: Wenn das Kaufvolumen größer ist als das Verkaufsvolumen, steigt der Preis des Währungspaares. Wenn das Verkaufsvolumen größer ist als das Kaufvolumen, fällt der Preis des Währungspaares. Funktionen Vermeiden Sie schlechte Trades, indem Sie diese mit Hilfe der Tick-Volumendat
The Time Segmented Volume (TSV) is a technical indicator that measures the volume of a financial instrument within specific time segments. It helps traders identify buying and selling pressure based on volume analysis. The TSV indicator can be used as part of a trading strategy to generate trade signals and confirm market trends. Let's explore how to use the TSV indicator as a trading strategy. To begin, add the TSV indicator to your trading platform. The TSV is typically represented as a line o
Daily Candle Predictor ist ein Indikator, der den Schlusskurs einer Kerze vorhersagt. Der Indikator ist in erster Linie für die Verwendung in D1-Charts gedacht. Dieser Indikator eignet sich sowohl für den traditionellen Devisenhandel als auch für den Handel mit binären Optionen. Der Indikator kann als eigenständiges Handelssystem oder als Ergänzung zu Ihrem bestehenden Handelssystem verwendet werden. Dieser Indikator analysiert die aktuelle Kerze und berechnet bestimmte Stärkefaktoren innerhalb
Dabei handelt es sich um einen indikator für trends, der mittels eines rot-grünen realstranges die änderungen des börsenpreises widerspiegelt, wobei eine änderung der realfarbe auf einen möglicherweise umkehrbaren gang des kurses hindeutet, der bereits auf den markt überhand genommen hat. Die grüne linie zeigt marktkurse an, wenn sie im steigen sind, die rote linie zeigt marktkurse an, wenn sie fallen.
The Chaikin Oscillator is a technical indicator developed by Marc Chaikin that combines price and volume data to measure the accumulation and distribution of a financial instrument. It aims to identify potential buying and selling opportunities in the market. The Chaikin Oscillator is calculated by subtracting a 10-day exponential moving average of the Accumulation Distribution Line (ADL) from a 3-day exponential moving average of the ADL. Here's how to use the Chaikin Oscillator indicator in tr
Käufer dieses Produkts erwarben auch
Trend indicator AI
Ramil Minniakhmetov
5 (44)
Trend Ai Indicator ist ein großartiges Tool, das die Marktanalyse eines Händlers verbessert, indem Trendidentifikation mit umsetzbaren Einstiegspunkten und Umkehrwarnungen kombiniert wird. Dieser Indikator ermöglicht es Benutzern, die Komplexität des Forex-Marktes mit Zuversicht und Präzision zu navigieren Über die primären Signale hinaus identifiziert der Trend Ai-Indikator sekundäre Einstiegspunkte, die bei Pullbacks oder Retracements auftreten, sodass Händler von Preiskorrekturen innerhalb d
M1 Sniper
Oleg Rodin
5 (11)
M1 SNIPER ist ein benutzerfreundliches Handelsindikatorsystem. Es handelt sich um einen Pfeilindikator, der für den M1-Zeitrahmen entwickelt wurde. Der Indikator kann als eigenständiges System für Scalping im M1-Zeitrahmen oder als Teil Ihres bestehenden Handelssystems verwendet werden. Obwohl dieses Handelssystem speziell für den M1-Zeitrahmen entwickelt wurde, kann es auch für andere Zeitrahmen verwendet werden. Ursprünglich habe ich diese Methode für den Handel mit XAUUSD und BTCUSD entwickel
Gann Made Easy
Oleg Rodin
4.82 (138)
Gann Made Easy ist ein professionelles und einfach zu bedienendes Forex-Handelssystem, das auf den besten Handelsprinzipien unter Verwendung der Theorie von Mr. basiert. W.D. Gann. Der Indikator liefert genaue KAUF- und VERKAUFSsignale, einschließlich Stop-Loss- und Take-Profit-Levels. Mit PUSH-Benachrichtigungen können Sie auch unterwegs handeln. Bitte kontaktieren Sie mich nach dem Kauf! Ich werde meine Handelstipps und tolle Bonusindikatoren kostenlos mit Ihnen teilen! Wahrscheinlich haben Si
Scalper Inside PRO
Alexey Minkov
4.7 (69)
An exclusive indicator that utilizes an innovative algorithm to swiftly and accurately determine the market trend. The indicator automatically calculates opening, closing, and profit levels, providing detailed trading statistics. With these features, you can choose the most appropriate trading instrument for the current market conditions. Additionally, you can easily integrate your own arrow indicators into Scalper Inside Pro to quickly evaluate their statistics and profitability. Scalper Inside
Enigmera
Ivan Stefanov
5 (8)
ENIGMERA: Der Kern des Marktes Wichtig: Die MQL5.com-Demo wird im Strategy Tester ausgeführt und spiegelt möglicherweise nicht vollständig die Funktionalität von Enigmera wider. Überprüfen Sie die Beschreibung, Screenshots und das Video für Details. Zögern Sie nicht, mir bei Fragen eine Nachricht zu senden! Der Code des Indikators wurde vollständig neu geschrieben. Version 3.0 fügt neue Funktionen hinzu und behebt Fehler, die seit der Einführung des Indikators aufgetreten sind. Einführung Dies
Dynamic Forex28 Navigator
Bernhard Schweigert
5 (6)
Dynamic Forex28 Navigator – Das Forex-Handelstool der nächsten Generation AKTUELL 49 % RABATT. Dynamic Forex28 Navigator ist die Weiterentwicklung unserer seit langem beliebten Indikatoren und vereint die Leistung von drei in einem: Advanced Currency Strength28 Indicator (695 Bewertungen) + Advanced Currency IMPULSE mit ALERT (520 Bewertungen) + CS28 Combo Signals (Bonus) Details zum Indikator https://www.mql5.com/en/blogs/post/758844 Was bietet der Strength Indicator der nächsten Generation?
Day Trader Master ist ein komplettes Handelssystem für Daytrader. Das System besteht aus zwei Indikatoren. Ein Indikator ist ein Pfeilsignal zum Kaufen und Verkaufen. Es ist die Pfeilanzeige, die Sie erhalten. Den zweiten Indikator stelle ich Ihnen kostenlos zur Verfügung. Der zweite Indikator ist ein Trendindikator, der speziell für die Verwendung in Verbindung mit diesen Pfeilen entwickelt wurde. INDIKATOREN WIEDERHOLEN SICH NICHT UND NICHT ZU SPÄT! Die Verwendung dieses Systems ist sehr einfa
Advanced Supply Demand
Bernhard Schweigert
4.91 (295)
Derzeit 33% Rabatt! Die beste Lösung für jeden Anfänger oder erfahrenen Händler! Dieser Indikator ist ein einzigartiges, qualitativ hochwertiges und erschwingliches Trading-Tool, da wir eine Reihe von proprietären Funktionen und eine neue Formel integriert haben. Mit diesem Update werden Sie in der Lage sein, doppelte Zeitrahmenzonen anzuzeigen. Sie können nicht nur einen höheren TF (Zeitrahmen) anzeigen, sondern sowohl den Chart-TF als auch den höheren TF: SHOWING NESTED ZONES. Alle Supply Dema
TPSpro RFI Levels
Roman Podpora
4.85 (27)
Umkehrzonen - Ebenen / Aktive Zonen eines Hauptakteurs ANLEITUNG RUS   /   ANLEITUNG   ENG   /   Version MT5 JEDER KÄUFER DIESES INDIKATORS       ERHALTEN SIE ZUSÄTZLICH   KOSTENLOS   : 3 Monate Zugang       zu Handelssignalen vom Service       SUPER SIGNALE       — vorgefertigte Einstiegspunkte gemäß dem TPSproSYSTEM-Algorithmus. 3 Monate Zugang       zu Schulungsmaterialien mit regelmäßigen Updates – Eintauchen in die Strategie und berufliches Wachstum. 24/5-Support an Wochentagen und Zugang
Trend Screener
STE S.S.COMPANY
4.79 (95)
Trendindikator, bahnbrechende, einzigartige Lösung für Trendhandel und -filterung mit allen wichtigen Trendfunktionen in einem Tool! Es handelt sich um einen 100 % nicht neu zu malenden Multi-Timeframe- und Multi-Währungs-Indikator, der für alle Symbole/Instrumente verwendet werden kann: Forex, Rohstoffe, Kryptowährungen, Indizes und Aktien. ZEITLICH BEGRENZTES ANGEBOT: Der Support- und Resistance-Screener-Indikator ist für nur 50 $ und lebenslang verfügbar. (Ursprünglicher Preis 250 $) (Angebot
IQ Gold Gann Levels a non-repainting, precision tool designed exclusively for XAUUSD/Gold intraday trading. It uses W.D. Gann’s square root method to plot real-time support and resistance levels, helping traders spot high-probability entries with confidence and clarity. William Delbert Gann (W.D. Gann) was an exceptional market analyst, whose trading technique was based on a complex blend of mathematics, geometry, astrology, and ancient mathematics which proved to be extremely accurate. Download
RelicusRoad Pro
Relicus LLC
4.64 (105)
Wie oft haben Sie schon einen Trading-Indikator mit großartigen Backtests, Nachweisen der Live-Kontoleistung mit fantastischen Zahlen und überall Statistiken gekauft, aber nachdem Sie ihn verwendet haben, sprengen Sie Ihr Konto? Sie sollten einem Signal nicht einfach so vertrauen, Sie müssen wissen, warum es überhaupt erschienen ist, und das ist es, was RelicusRoad Pro am besten kann! Benutzerhandbuch + Strategien + Schulungsvideos + Private Gruppe mit VIP-Zugang + Mobile Version verfügbar Ein
Upper and Lower Reversal – System zur frühzeitigen Vorhersage von Umkehrmomenten. Ermöglicht Ihnen, Preiswendepunkte an den Grenzen der oberen und unteren Preisbewegungskanäle zu finden. Der Indikator wird niemals seine Farbe ändern oder die Position der Signalpfeile ändern. Rote Pfeile sind ein Kaufsignal, blaue Pfeile sind ein Verkaufssignal. Passt sich allen Zeitrahmen und Handelsinstrumenten an Der Indikator wird nicht neu gezeichnet, er funktioniert nur, wenn die Kerze schließt. Es gibt v
Easy Breakout
Mohamed Hassan
4.69 (13)
Summer Sale: 50% OFF!!! $44 instead of $88! Promotion is valid until 22 August 2025!  After your purchase, feel free to contact me for more details on how to receive a bonus indicator called VFI, which pairs perfectly with Easy Breakout for enhanced confluence!   Easy Breakout is a powerful price action trading system built on one of the most popular and widely trusted strategies among traders: the Breakout strategy ! This indicator delivers crystal-clear Buy and Sell signals based on breako
TREND HARMONY MT4 –  Multi Timeframe Trend and Phase and Pullback Level Visualizer indicator for Metatrader4 The TREND HARMONY indicator automates deep trend analysis and generates visualizations for you. Take control of your trades by eliminating uncertainty! Revolutionize your trading experience with precision and insight through the TREND HARMONY Multi Timeframe Trend Indicator – your ultimate MT4 trend visualization indicator. Are you tired of missing trading opportunities or consistently e
Apollo Secret Trend ist ein professioneller Trendindikator, der verwendet werden kann, um Trends für jedes Paar und jeden Zeitrahmen zu finden. Der Indikator kann leicht zu Ihrem primären Handelsindikator werden, mit dem Sie Markttrends erkennen können, unabhängig davon, welches Paar oder welchen Zeitrahmen Sie bevorzugen. Durch die Verwendung eines speziellen Parameters im Indikator können Sie die Signale an Ihren persönlichen Handelsstil anpassen. Der Indikator bietet alle Arten von Warnungen,
Gold Stuff
Vasiliy Strukov
4.85 (262)
Gold Stuff-Ein Trendindikator, der speziell für Gold entwickelt wurde, kann auch auf allen Finanzinstrumenten verwendet werden. Der Indikator wird nicht neu gezeichnet und verzögert sich nicht. Empfohlener Zeitrahmen H1. Nach diesem Indikator geschrieben EA Gold Stuff Berater, können Sie es in meinem Profil finden. WICHTIG! Kontaktieren Sie mich sofort nach dem Kauf, um Anweisungen und Bonus zu erhalten!   Sie können eine kostenlose Kopie unseres Strong Support- und Trendscanner-Indikators er
TPSproTREND PrO
Roman Podpora
4.68 (25)
VERSION MT5        —        ИНСТРУКЦИЯ RUS           —        INSTRUCTIONS  ENG Hauptfunktionen: Präzise Eingangssignale OHNE RENDERING! Wenn ein Signal erscheint, bleibt es relevant! Dies ist ein wichtiger Unterschied zu Redraw-Indikatoren, die ein Signal liefern und es dann ändern können, was zu einem Verlust des eingezahlten Geldes führen kann. Jetzt können Sie mit größerer Wahrscheinlichkeit und Genauigkeit in den Markt eintreten. Es gibt auch eine Funktion zum Einfärben der Kerzen nach de
Hydra Trend Rider is a non-repainting, multi-timeframe trend indicator that delivers precise buy/sell signals and real-time alerts for high-probability trade setups. With its color-coded trend line, customizable dashboard, and mobile notifications, it's perfect for traders seeking clarity, confidence, and consistency in trend trading. Download the Metatrader 5 Version Read the User Manual here. HURRY!  Price  increasing soon! Read the product description carefully before purchasing the product. 
PipRush ist ein technischer Indikator, der strukturierte Handelsmöglichkeiten mit statistischer Logik erkennt. Er zeichnet automatisch Handelssignale mit vordefiniertem Einstieg, Stop Loss und Take Profit ein. Der Indikator wurde für Trader entwickelt, die manuelle Analysen reduzieren und einen datenbasierten, konsistenten Ansatz verfolgen möchten. Hauptfunktionen Zeichnet automatisch vollständige Handelssetups ein: Einstieg, Stop Loss, Take Profit und Risiko-Ertrags-Verhältnis Echtzeit-Dashboar
IQ FX Gann Levels a precision trading indicator based on W.D. Gann’s square root methods. It plots real-time, non-repainting support and resistance levels to help traders confidently spot intraday and scalping opportunities with high accuracy. William Delbert Gann (W.D. Gann) was an exceptional market analyst, whose trading technique was based on a complex blend of mathematics, geometry, astrology, and ancient mathematics which proved to be extremely accurate. Download the Metatrader 5 Version M
DERZEIT 26% RABATT Die beste Lösung für jeden Newbie oder Expert Trader! Dieser Indikator ist ein einzigartiges, qualitativ hochwertiges und erschwingliches Trading-Tool, da wir eine Reihe von proprietären Funktionen und eine neue Formel integriert haben. Mit nur EINEM Chart können Sie die Währungsstärke für 28 Forex-Paare ablesen! Stellen Sie sich vor, wie sich Ihr Handel verbessern wird, weil Sie in der Lage sind, den genauen Auslösungspunkt eines neuen Trends oder einer Scalping-Gelegenhei
Auto Optimized Bollinger Bands – Anpassungsfähiges Volatilitätswerkzeug basierend auf realem Marktverhalten Auto Optimized Bollinger Bands ist ein fortschrittlicher Indikator für MT4, der die klassischen Bollinger Bands verbessert, indem er mittels vergangener Tradesimulation die optimalen Perioden- und Standardabweichungswerte automatisch ermittelt. Anstatt sich auf feste Einstellungen zu verlassen, passt sich das Tool dynamisch an Marktveränderungen und Preisstrukturen an und erstellt so Echtz
Gold Pro Scalper
Aleksandr Makarov
4.8 (5)
Special offer! https://www.mql5.com/ru/users/bossik2810 Gold Pro Scalper Precise entry points for currencies, crypto, metals, stocks, indices! Indicator 100% does not repaint!!! If a signal appeared, it does not disappear! Unlike indicators with redrawing, which lead to loss of deposit, because they can show a signal, and then remove it. Trading with this indicator is very easy. Wait for a signal from the indicator and enter the deal, according to the arrow  (Blue arrow - Buy, Red - Sell).
Derzeit 20% Rabatt! Die beste Lösung für jeden Neueinsteiger oder Expert Händler! Dieses Dashboard arbeitet mit 28 Währungspaaren. Es basiert auf 2 unserer Hauptindikatoren (Advanced Currency Strength 28 und Advanced Currency Impulse). Es bietet einen hervorragenden Überblick über den gesamten Forex-Markt. Es zeigt die Werte der Advanced Currency Strength, die Veränderungsrate der Währungen und die Signale für 28 Devisenpaare in allen (9) Zeitrahmen. Stellen Sie sich vor, wie sich Ihr Handel
Auto Optimized RSI
Davit Beridze
5 (1)
Auto Optimized RSI ist ein benutzerfreundlicher, intelligenter Pfeil-Indikator, der entwickelt wurde, um präzise Kauf- und Verkaufssignale zu liefern. Er nutzt Handelssimulationen auf historischen Daten, um automatisch die effektivsten RSI-Kauf-/Verkaufsschwellen für jedes Symbol und jeden Zeitrahmen zu ermitteln. Dieser Indikator kann als eigenständiges Handelssystem verwendet werden oder als Teil einer bestehenden Strategie – besonders nützlich für kurzfristige Trader. Im Gegensatz zu herkömml
Volatility Trend System – ein Handelssystem, das Signale für Einstiege gibt. Das Volatilitätssystem liefert lineare und punktuelle Signale in Richtung des Trends sowie Signale zum Verlassen des Trends, ohne Neuzeichnung und Verzögerungen. Der Trendindikator überwacht die Richtung des mittelfristigen Trends, zeigt die Richtung und deren Änderung an. Der Signalindikator basiert auf Änderungen der Volatilität und zeigt Markteintritte an. Der Indikator ist mit mehreren Arten von Warnungen ausgestat
Gold Trend   - dies ist ein guter technischer Indikator für Aktien. Der Algorithmus des Indikators analysiert die Preisbewegung eines Vermögenswerts und spiegelt die Volatilität und mögliche Einstiegszonen wider. Die besten Indikatorsignale: - Für VERKAUFEN = rotes Histogramm + roter SHORT-Zeiger + gelber Signalpfeil in dieselbe Richtung + roter Trendrichtungspfeil. - Für KAUFEN = blaues Histogramm + blauer LONG-Zeiger + aquafarbener Signalpfeil in dieselbe Richtung + blauer Trendrichtungspf
PRO Renko System ist ein hochpräzises Handelssystem, das speziell für den Handel mit RENKO-Charts entwickelt wurde. Dies ist ein universelles System, das auf verschiedene Handelsinstrumente angewendet werden kann. Das System neutralisiert effektiv so genannte Marktgeräusche, die Ihnen Zugang zu genauen Umkehrsignalen geben. Der Indikator ist sehr einfach zu bedienen und hat nur einen Parameter, der für die Signalerzeugung verantwortlich ist. Sie können das Tool einfach an jedes Handelsinstrum
Entry Points Pro
Yury Orlov
4.61 (170)
Dies ist ein Indikator für MT4, der genaue Signale für den Einstieg in einen Handel ohne Repainting (Neuzeichnen) liefert. Er kann auf alle Finanzwerte angewendet werden: Forex, Kryptowährungen, Metalle, Aktien, Indizes. Er liefert ziemlich genaue Schätzungen und sagt Ihnen, wann es am besten ist, eine Position zu eröffnen und zu schließen. Sehen Sie sich das Video (6:22) mit einem Beispiel für die Verarbeitung nur eines Signals an, das sich für den Indikator gelohnt hat! Die meisten Händler ver
Weitere Produkte dieses Autors
Supply demand zone with added Alerting system. Why this supply demand indicator is different? Zones are not traditional zones. these are KIRI zones. these are high probability zones where market reacts no matter how much. Most people including me have been missed out of trade because we somehow got distracted. no worries, i have added an alert to our zones now. (Metatrader doesn't show alerts in strategy tester) Most people dont know when to enter the market when it comes to zone based trading.
EURUSD EA tested over 25 years from 2000 till today Pure price + time + quant mathematics. Please make " Enable Auto-algo selection based on broker " this flag to true before you test. You will not find a single EA on this platform that has been tested for such big data, all EAs here are martingales that fails no matter what and when they fail you lose it all. Message me if you need any help or if you are not able to regenerate the same results. Indicator setting :  Make sure you have enabled t
EURUSD EA getestet über 25 Jahre von 2000 bis heute Reine Preis-, Zeit- und Quant-Mathematik. Bitte setzen Sie " Enable Auto-algo selection based on broker " diese Flagge auf true bevor Sie testen. Sie werden keinen einzigen EA auf dieser Plattform finden, der für solch große Daten getestet wurde, alle EAs hier sind Martingale, die versagen, egal was passiert und wenn sie versagen, verlieren Sie alles. Schicken Sie mir eine Nachricht, wenn Sie Hilfe benötigen oder wenn Sie nicht in der Lage sind
Here is the V3 of perfect market structure. Whats new? Coded based on ICT rules. No more trend confusions...-- Added labels to show current trend No more timeframe juggling and missing out important points, -- Now You can add indicator multiple times to mark multi timeframe market  structure on the same chart window( 1D market structure on 4H or may be 4H market  structure on 15 min timeframe and more.....) No more waiting in large range as sometimes market makes huge ranges and starts making im
3 Trading Strategies to Exploit Market Structure (Without Overcomplicating It) Trading isn’t about predicting the future—it’s about spotting patterns, managing risk, and acting when odds favor you. Below are two timeless strategies (and one hybrid) that align with how markets   actually   move, not how we wish they would. Some of the strategies you can trade with the indicator [ Note] Higher timeframe should be 15x of the lower timeframe, for eg. htf 15min, ltf 1min. 1. The Breakout Trap: Trad
This is the finest structure marking you will ever find in any market. indicator is coded considering the actual structure any trader would use. indicator is coded based on actual candle breaks and not coded based on any pivot or predefined values or specific number of candles high and low. please check out the screenshot. if you want me to fine tune it according to your needs then i am open for it. Thank you :)
V2 of the Perfect structure. What's Inherited from v1? This is the finest structure marking you will ever find in any market. Indicator is coded considering the actual structure any trader would use. Indicator is coded based on actual candle breaks and not coded based on any pivot or predefined values or specific number of candles high and low. Please check out the screenshot. What's new in V2? AI based approach for High accuracy by calculating maximum bars with rapid switch algorithm. Dual tim
Zone + Trend Reversal System There are many many situations you may want to use this indicator and you may not want to. Please refer the doc attached in the comment section for complete guidance. Check comments for manual. Keep in mind, Once you make the purchase please reach out to me when you are in the testing phase so i could answer your queries when you are stuck and confused because most of the time we fail because we keep going in a wrong direction without asking for the help. Read the m
RD Range System V3
Rahul Shrikrishna Dani
About the indicator  You have price range limit (red lines) that is calculated based on previous range.  You have signal (yellow star) that indicates the end of swing. When price hits the price range upper or lower limit and generates swing end signal (yellow star) then you trade for reversal. Now there are rules, you can't just simply trade, read the manual i have attached in the comments. Note that, Indicator works with all pairs and with every timeframe. While testing in strategy tester it t
FVG that is only marked above(downtrend)/below(uptrend) 50% retracement with ICT market structure. Strategy 1: False Break + FVG Confluence Setup: structure breaks -> market goes to fvg -> returns back and continue its journey marking it as a false break. fvg above 50% retracement is a very strong unfilled area which always reacts to price. Entry Rules: Enter when price hits the FVG after the false break Wait for structure to change (downtrend close : when red candle closes below swing low and
SMT aka correlation divergence between EURUSD and Strategy: False Break + SMT Setup: Structure breaks -> market structure creates smt -> structure breaks and returns to 50% level. SMT makes it a high probability trade. for low risk high reward use 1H:5Min, 4H:15Min, 1D:1H timeframes, one to find false break, other to find out SMT and structure break.  stop loss should always be at the top of the structure start(in lower timeframe when price touches false break and breaks the structure) and not a
Pair correlation divergence. Define your pair in indicator setting with this format : SYMBOL1:SYMBOL2,SYMBOL3:SYMBOL4 Already Defined Symbols : EURUSD:GBPUSD,AUDUSD:NZDUSD,USDCHF:EURUSD,USDCAD:Crude,XAUUSD:AUDUSD Symbol name should match the exact case as you see it in left panel where all symbols are listed. (Indicator will not work on strategy tester, strategy tester fail to load different symbols data internally, watch video for functional usage) CAUTION   : If you drag any symbol on screen
V2 der perfekten Struktur. Was ist von v1 geerbt worden? Dies ist die beste Strukturmarkierung, die Sie je auf einem Markt finden werden. Der Indikator ist so kodiert, dass er die tatsächliche Struktur berücksichtigt, die jeder Trader verwenden würde. Der Indikator wird auf der Grundlage von tatsächlichen Kerzenbrüchen kodiert und nicht auf der Grundlage von Pivot- oder vordefinierten Werten oder einer bestimmten Anzahl von Hoch- und Tiefkerzen. Bitte sehen Sie sich den Screenshot an. Was ist n
3 Handelsstrategien zur Ausnutzung der Marktstruktur (ohne sie zu sehr zu verkomplizieren) Beim Trading geht es nicht darum, die Zukunft vorherzusagen - es geht darum, Muster zu erkennen, Risiken zu managen und zu handeln, wenn die Chancen für Sie günstig sind. Im Folgenden finden Sie zwei zeitlose Strategien (und eine hybride), die sich daran orientieren, wie sich die Märkte tatsächlich bewegen , und nicht, wie wir es uns wünschen. Einige der Strategien, die Sie mit dem Indikator handeln könne
Korrelationsdivergenz der Paare. Definieren Sie Ihr Paar in der Indikatoreinstellung mit diesem Format: SYMBOL1:SYMBOL2,SYMBOL3:SYMBOL4 Bereits definierte Symbole : EURUSD:GBPUSD,AUDUSD:NZDUSD,USDCHF:EURUSD,USDCAD:Crude,XAUUSD:AUDUSD Der Name des Symbols sollte genau der Groß- und Kleinschreibung entsprechen, wie Sie sie im linken Fenster sehen, in dem alle Symbole aufgelistet sind. VORSICHT : Wenn Sie ein Symbol auf den Bildschirm ziehen und der Indikator nicht angezeigt wird (Live-Modus, nic
Auswahl:
Keine Bewertungen
Antwort auf eine Rezension