Vispucci
- Indikatoren
- Version: 1.776
- Aktualisiert: 31 Oktober 2024

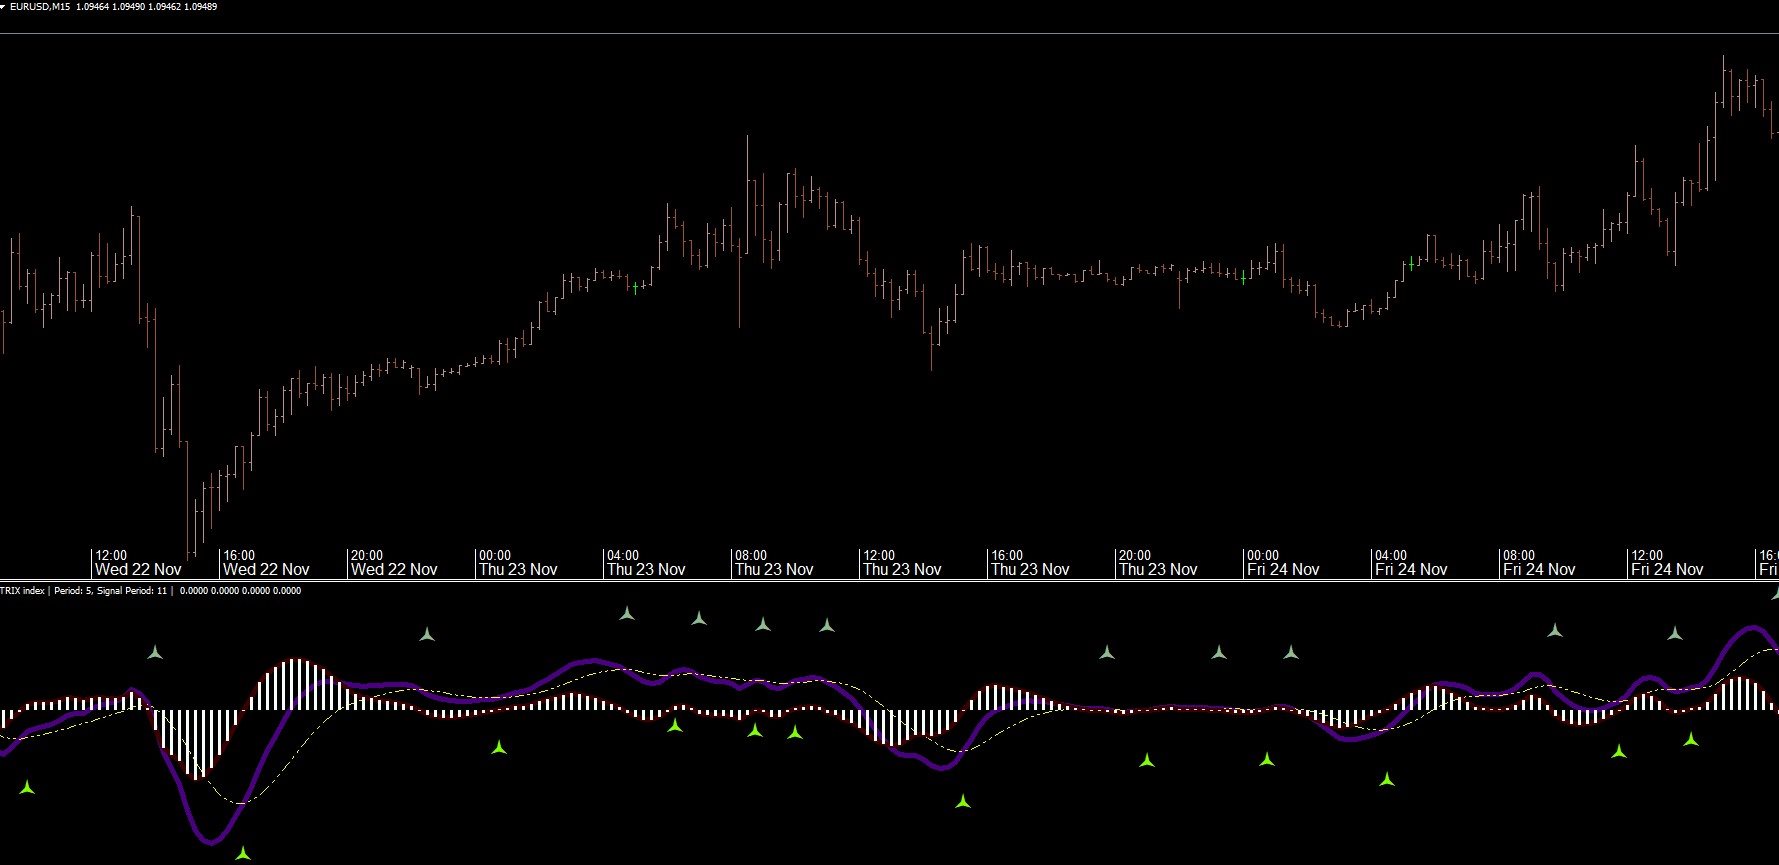
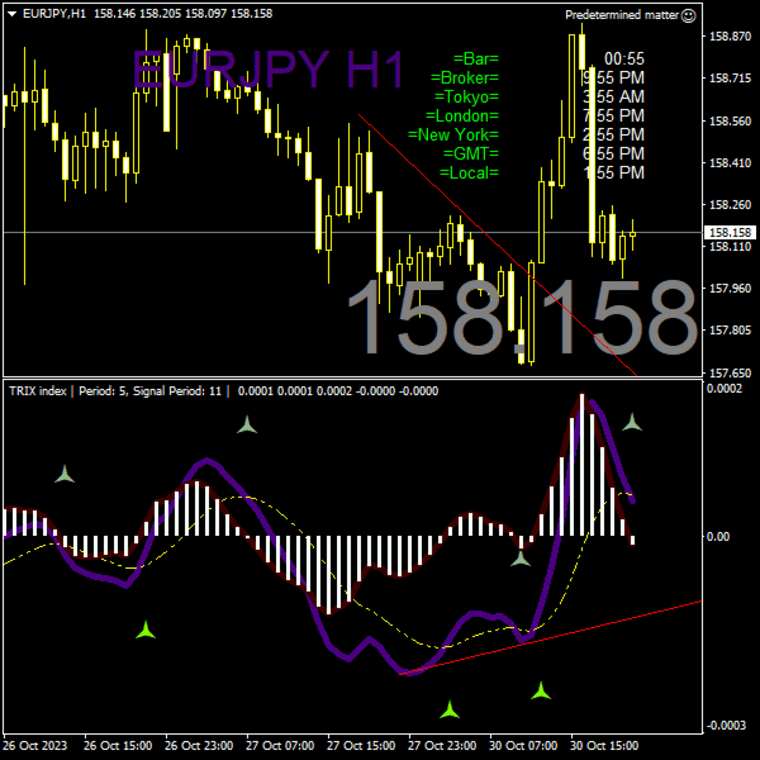
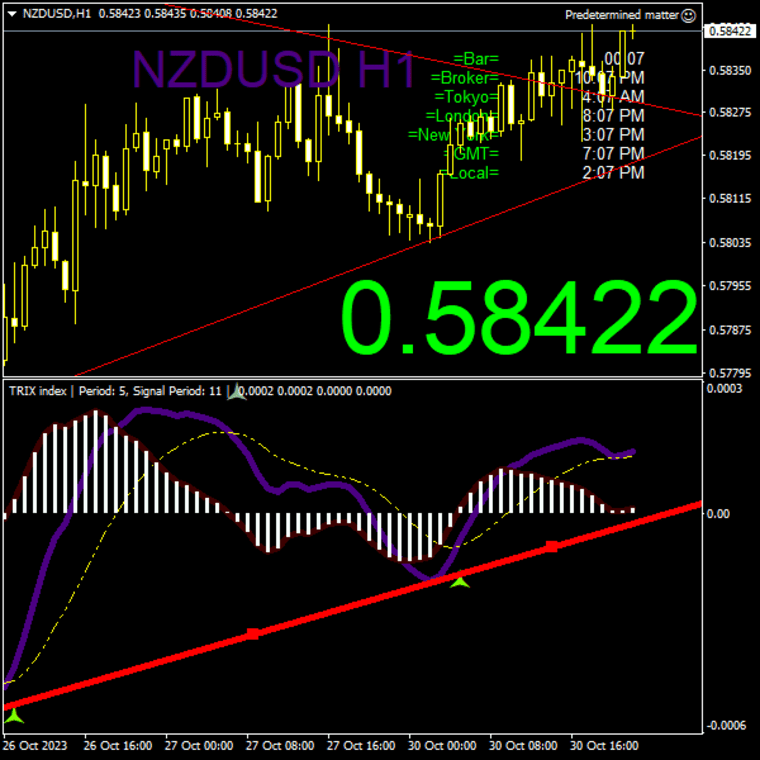
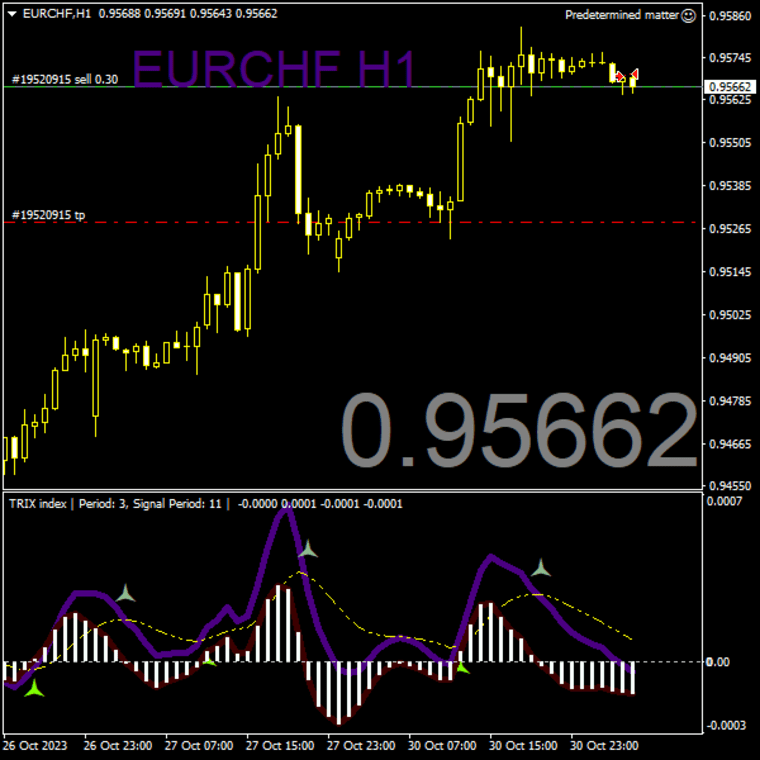
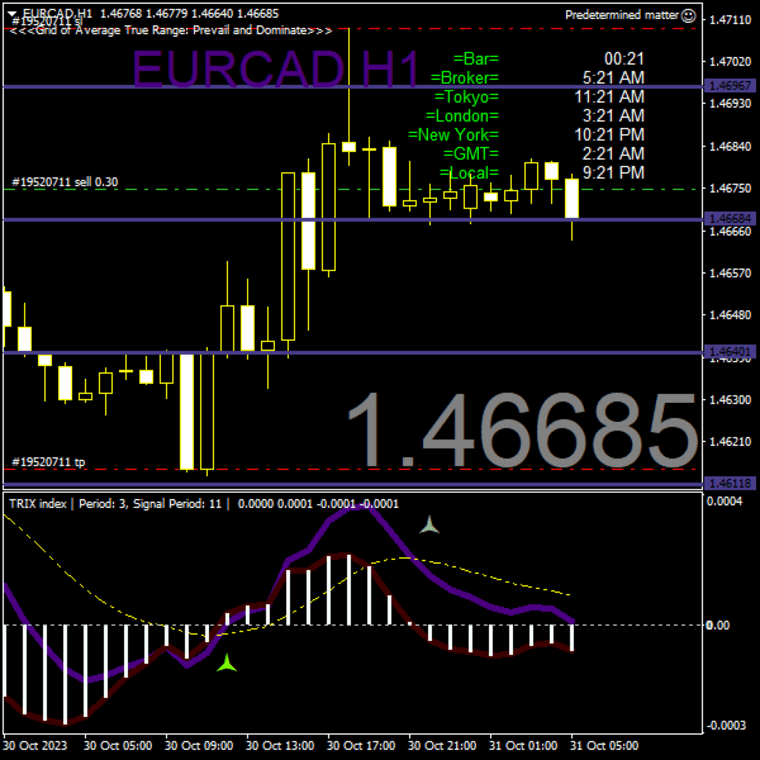
Der Indikator verhält sich ähnlich wie die Preisaktion eines Charts und verwendet "Trix", um sich auf die Exposition von Divergenzen, flachem/geringem Marktvolumen und Preisaktionsausweitung einzustellen. Der TRIX-Indikator, benannt nach dem Triple-Exponential-Average, ist ein Momentum-basierter Oszillator, der geringfügige Preisänderungen und Fluktuationen herausfiltert, die für den Forex-Handel als unbedeutend angesehen werden , während er gleichzeitig Möglichkeiten zum Geldverdienen bietet! Insgesamt ist der TRIX-Indikator ein führender Indikator, der Divergenzen zwischen dem Indikator und dem Preis anzeigt und damit potenzielle Umkehrungen anzeigt!
Er liefert die besten Handelssignale mit dem "Symbol 169, das auch als dreizackiges Mercedes-Zeichen" bezeichnet wird. Er kannüberkaufte und überverkaufte Bedingungen signalisieren. Der Indikator basiert auf dem geglätteten exponentiellen gleitenden Durchschnitt und wird häufig von Forex- und Indexhändlern verwendet, um die beste technische Handelsstrategie vorzubereiten. Händler können KAUFEN, sobald das unterstrichene Signal erscheint. Händler können auch VERKAUFEN, wenn das Signal oberhalb der gleitenden Durchschnitte erscheint. Der Signalanbieter zahlt den laufenden Kurs nicht zurück.Bei Erreichen eines Schlusspunktes der Trades, wenn die MA-Linien ausbrechen oder das gegenteilige Signal erscheint, wäre ein guter Zeitpunkt, den Trade zu schließen.Die Schließung eines Handels ist unbestreitbar der Zeitpunkt, an dem man einen vernünftigen Ausstieg sieht (abgesehen vom Warten auf das Gegensignal). Sobald ein Signal angezeigt wird, erhält der Benutzer eine Benachrichtigung , die auf die Wahrscheinlichkeit einer Preisänderung hin weist.Wenn der Oszillator dünn ist und auf ein Minimum geschrumpft ist, würde man offensichtlich sehen, dass der Preis schwankt und in einem minimalen Trend steckt. Eine Unentschlossenheit vielleicht, denn dort ist kein Geld zu finden. Folglich sind diese Signale aus einem flachen Markt nicht gut zu verwenden. Denken Sie daran, Sie werden in der Lage sein, Strategie-Test, so dass am besten abgestimmten Szenarien. Vergessen Sie nicht, sich von den Fundamentaldaten genauso leiten zu lassen wie von den technischen. Es gibt keinen bestimmten Zeitrahmen, der empfohlen wird, aber ich möchte erwähnen, dass Musik im Hintergrund für einen optimalen Überblick über die Marktliquidität sehr hilfreich ist! HA!
Wichtige Überlegungen und bekannte Einschränkungen:
Kein Handelskontext - Muster werden ohne Bestätigung von Trend, Unterstützung/Widerstand oder Marktphase erkannt. Verwendung mit diskretionärer Analyse.
Keine eingebaute Risiko-/Belohnungsstruktur - Das Tool legt keine Stop-Loss- oder Take-Profit-Ziele fest. Die Benutzer müssen die Handelsgröße und den Ausstieg manuell verwalten.
Ausschließliche Musterlogik - Die Signale basieren allein auf Kerzenformen und können in unruhigen oder von Nachrichten bestimmten Märkten falsch positive Signale auslösen.
Keine Bestätigungsebene - Eingaben basieren auf einer einzigen Kerze, ohne zusätzliche Momentum- oder Volumenfilter.
Multi-Timeframe-Konflikte - Signale aus verschiedenen Timeframes können sich widersprechen; Benutzer sollten einem Timeframe den Vorrang geben oder ihre eigene Filterlogik anwenden.
Statisches Verhalten - Der Indikator passt sich nicht an die sich ändernde Volatilität oder den Trend bzw. die Schwankungsbreite des Marktes an.
✅ So verwenden Sie ihn effektiv:
Verwenden Sie den Indikator als visuelles Warnsignal, nicht als Signalgenerator
Lassen Sie den Indikator potenzielle Umkehr- oder Fortsetzungszonen aufzeigen. Analysieren Sie weiter, bevor Sie handeln.Kombinieren Sie ihn mit der Trendstruktur
Filtern Sie Signale anhand der Trendrichtung von gleitenden Durchschnitten oder der Marktstruktur (HH/HL für Käufe, LH/LL für Verkäufe).Anwendung auf wichtige Unterstützungs-/Widerstandsniveaus
Suchen Sie nach Candlestick-Mustern, die in der Nähe bekannter Interessenzonen erscheinen - frühere Hochs/Tiefs, Angebot/Nachfrage oder institutionelle Preisniveaus.- Kombinieren Sie mit Grid MATR und anderen benutzerdefinierten Indikationen
Bestätigen Sie die Stärke eines Musters anhand von Volumenspitzen, RSI-Divergenz oder Momentum-Indikatoren wie MACD oder Stochastic.
Wählen Sie einen oder zwei Zeitrahmen
Vermeiden Sie eine Signalüberlastung - wählen Sie Zeitrahmen, die zu Ihrer Strategie passen (z. B. H1 + H4 für Swing, M15 für Scalping).Backtesting mit Grid MATR und Nutzung der EA-Prädetermination für das Trade Management
*Besuchen Sie auch den Rest meines Profils für weitere Apps und Inhalte.