Initial Balance MT5

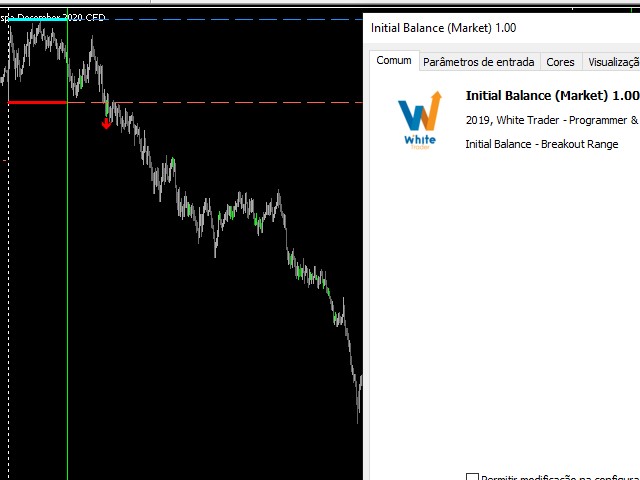
The Initial Balance (Initial Balance / Initial Balance) is a concept related to the study of volume (to learn more, study about Market Profile and Auction Market Theory. You can find some videos in English when searching for "Initial Balance Market Profile").


The IB defines a range in which prices were negotiated in the first hour of trading.The amplitude of the range is important and the break in the range defined by the Initial Balance may have occurred due to the movement of several players operating in that direction, and it is interesting to follow this movement.

Thus, this indicator seeks to automatically mark the level of the IB and can also visually signal the break.

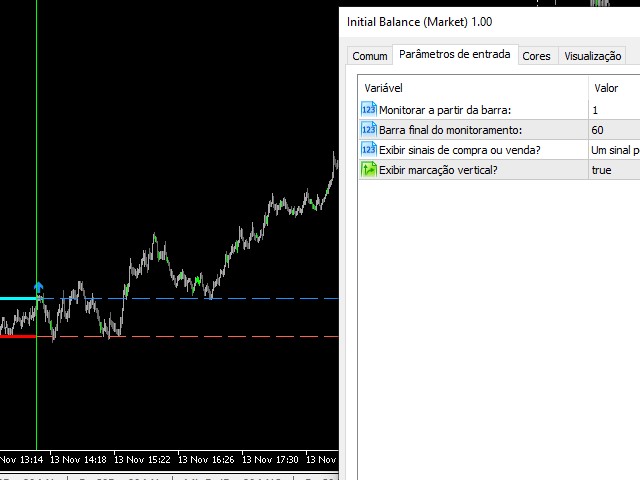
The input settings are:

  • Starting bar: 1 (monitor from the first candle)

  • Final bar: 60 (so we are monitoring the first hour if it is in the 1 minute timeframe)

  • Display buy and sell signals (Buffer that signals a break and can be adapted for use in Expert Advisors, where buffer 0 is a sell signal and buffer 1 is a buy signal);

  • Display vertical marking (a green line in the last IB candle)


By modifying the start and end boom settings, you can use the same indicator for other break break setups. This was the idea when programming the indicator to suit different traders and setups.


It is.


Success and good trades!

推荐产品
This Volume Delta Profile is an advanced MetaTrader 5 indicator that visualizes   volume delta (order flow imbalance)   using a volume profile-style histogram. It shows the difference between buying and selling pressure at specific price levels, helping traders identify supply and demand zones. This indicator provides a unique perspective on market dynamics by visualizing the imbalance between buying and selling pressure, offering insights beyond traditional volume analysis. Core Concept Positiv
Delta Profile Volume
Teresinha Moraes Correia
指标技术说明 – Delta Profile for MetaTrader 5 Delta Profile 是为 MetaTrader 5 开发的一款指标,用于在指定的 K 线区间内对成交量流进行详细分析。它能够在不同的价格水平上对正向成交量(与上涨相关)和负向成交量(与下跌相关)的不平衡进行结构化和可视化展示。最终,用户可以清晰地识别图表中成交最为集中的区域,以及真实的市场不平衡形成的位置。 以下是该指标的主要技术特征与参数说明。 核心概念 指标会识别 价格水平 ,并将其分类为正向成交量、负向成交量,以及净 Delta(正负成交量的差值)。 每个价格水平会在图表中以 水平条形 显示,帮助用户直观观察市场活跃区和不平衡区域。 用户可自由控制 分析的 K 线数量 、 价格精度(小数位数) 、 显示的最大水平数量 以及 可视化样式 。 主要功能 价格水平映射 :根据设定的精度对价格进行四舍五入,并累计对应 K 线的成交量。 净 Delta 计算 :显示正负成交量的差值,提供每个价格区间的客观数值。 最强 Delta 水平突出显示 :自动识别 Delta 绝对值最大的价格水平,并用特殊颜色标
Intraday Session TPO
Kummari Raghu Ram
Intraday Session TPO: Precision Volume Profiling for Day Traders Stop trading blind during the most volatile hours of the day. Standard daily volume profiles blend everything together, masking the true areas of liquidity and institutional interest. The Intraday Session TPO is engineered specifically for session-to-session traders. It empowers you to isolate and profile specific time windows—like the London Open, the New York Killzone, or the Asian range—so you can see exactly where the volume is
本指标可以让您享受两个最流行的产品来分析在感兴趣的价位的请求量和市场成交量: 真实市场深度图表 真实报价足迹成交量图表 本产品结合两个指标的效力,并以单个文件提供。 反危机出售。今日低价。赶紧! 真实的 COMBO 市场深度功能和报价成交量图表,完全等同于原始指标。您将享受这两款产品结合为单一超级指标的力量!下面是您将得到的功能: 真实市场深度图表 股民专用工具现已在 MetaTrader 5 上可用。 真实市场深度图表 指标在图表上以直方条的形式显示可视化的市场深度,并在实时模式下刷新。 利用 真实市场深度图表 指标您可以正确评估市场请求并从图表上看到大的市场。这可以 100% 的精确剥头皮和设置持仓止损。 指标以两种相应颜色的水平直方条形式显示买和卖的请求 (买-卖)。价格图表上给定级别的显示条和它们的长度与请求的交易量相应。此外, 它指示买卖请求的最大交易量。 此指标显示买卖请求总数量作为堆积面积图。这可以评估当经过下一价位时将会执行的请求总量。买卖请求总数量也显示在图表上。 省缺, 指标显示在图表背景上, 且它不会干扰任何其它指标。当使用指标交易时, 建议使用实际交易量。 本
VP hidden
Emr Aljnaby
4.33 (12)
The indicator works to convert normal volume into levels and determine financial liquidity control points. It is very similar in function to Fixed Volume Profile. But it is considered more accurate and easier to use than the one found on Trading View because it calculates the full trading volumes in each candle and in all the brokers present in MetaTrade, unlike what is found in Trading View, as it only measures the broker’s displayed prices. To follow us on social media platforms: telegram
FREE
VolumeProfile MT5
Robert Hess
4.14 (7)
Description: The Volume Profile displays detailed informations of historical trading activities at certain price levels (Market Profile). Locate the areas with the best prices in the market and get an advantage over other market participants. Features: Customizable Market Profile Shows the "fair" Value Area with 70% of all Volume Shows critical low volume zones Shows VPOC, VAL and VAH Points integrated resource management to reduce the load while working with multiple charts Works on all timefr
MR Volume Profile 5
Sergey Khramchenkov
The "MR Volume Profile 5" indicator is a charting tool that displays trading volume at different price levels rather than time intervals. A key concept in volume profile is the point of control (POC)—the price level with the highest volume traded during the session or time range. While tools like VWAP or OBV provide volume trends, the "MR Volume Profile 5" indicator offers granular detail about where the most market activity occurs at specific price levels. This makes it a more precise tool for
Blahtech Market Profile MT5
Blahtech Limited
5 (10)
Was: $249  Now: $99   Market Profile defines a number of day types that can help the trader to determine market behaviour. A key feature is the Value Area, representing the range of price action where 70% of trading took place. Understanding the Value Area can give traders valuable insight into market direction and establish the higher odds trade. It is an excellent addition to any system you may be using. Inspired by Jim Dalton’s book “Mind Over Markets”, this indicator is designed to suit the
MT4 版本: https://www.mql5.com/en/market/product/166784 MT5 版本: https://www.mql5.com/en/market/product/166785 流动性分布图 流动性分布图是一款可视化的市场结构工具,它使用动态热图式的分布图在图表上绘制潜在的流动性区域。 该指标分析历史价格走势和成交量,然后突出显示流动性可能集中的价格区域。它绘制: 流动性线(潜在的反应/扫荡水平) 热图分布图框(流动性集中区域) POC/最大流动性水平(检测到的最高流动性集中度) 最终生成清晰的可视化分布图,帮助交易者识别: 潜在的磁力线水平, 可能的扫荡区域, 当前价格上方/下方的反应区域, 入场、出场和风险管理的背景信息。 主要功能 动态流动性热图轮廓 基于成交量加权的价格区域 高亮显示最大流动性点 (POC) 高低流动性区域采用不同颜色区分 可调节轮廓分辨率(区间) 可调节扫描分辨率 用于快速控制显示的图表开关按钮 直接在主图表窗口中运行 工作原理(概念) 该指标通过结合以下因素来估算流动性集群
Profile Map MT5
Dmitriy Sapegin
5 (5)
Market Profile helps the trader to identify the behavior if major market players and define zones of their interest. The key feature is the clear graphical display of the range of price action, in which 70% of the trades were performed. Understanding of the location of volume accumulation areas can help traders increase the probability of success. The tool can be used as an independent system as well as in combination with other indicators and trading systems. this indicator is designed to suit
ZoneCore MT5
Frederic Jacques Collomb
ZONECORE — Volume Profile & Pivot Levels 以外科手术般的精准度识别成交量最集中的价格区域。 MT4 version 什么是 ZONECORE? ZONECORE 是一款专业级指标,将 成交量分布(Volume Profile) 与 高成交量枢轴位(Pivot Levels) 相结合,揭示市场停留时间最长、成交量最大的价格区域。这些区域对价格具有强大的吸引力——掌握它们,让您在识别支撑位、阻力位及高概率反转区域时占据决定性优势。 3 个独立计算模式 ZONECORE 提供三个完全独立的模式,可同时启用: Period 模式 — 基于可配置的 K 线数量(默认 200 根)计算成交量分布。非常适合波段交易和日内分析。 Daily 模式 — 基于当前交易时段计算,支持自定义开始和结束时间。专为在特定市场窗口内操作的日内交易者设计。 Previous Day 模式 — 计算前一交易日(D-1)的成交量分布,并以虚线延伸至当日。对于识别昨日至今仍有效的关键价位不可或缺。 每个模式均拥有独立的配色方案,完全可自定义。 显示的关键价位 POC(控制点) —
Market profile was developed by Peter Steidlmayer in the second half of last century. This is a very effective tool if you understand the nature and usage. It's not like common tools like EMA, RSI, MACD or Bollinger Bands. It operates independently of price, not based on price but its core is volume. The volume is normal, as the instrument is sung everywhere. But the special thing here is that the Market Profile represents the volume at each price level. 1. Price Histogram The Price Histogram i
Advanced Volume Profile Analysis Tool for MetaTrader 5 The Kecia Volume Profile Order Finder provides traders with volume profile analysis capabilities. This MT5 indicator combines volume profile visualization with statistical calculations to help identify potential trading opportunities and suggests entry, stop loss, and take profit levels based on market structure. Market Profile Visualization Transform your chart with customizable volume profile visualizations: Multiple visualization options
Advanced ARFIMA Predictor Advanced ARFIMA Predictor is a predictive trading indicator built on the ARFIMA (AutoRegressive Fractionally Integrated Moving Average) model, designed to capture the structural memory embedded in financial markets and translate it into actionable Buy and Sell signals. Unlike traditional short-memory models, ARFIMA incorporates fractional integration to detect long-memory dynamics and persistent price behavior. This enables the indicator to anticipate regime shifts and
TPO Institutional Levels Pro B3
Fernando Rosa De Almeida
Suggested Name: TPO & Institutional Levels Pro Description: Elevate your market reading with TPO & Institutional Levels Pro B3 , the ultimate tool for Day Traders looking to trade alongside the smart money. Instead of cluttering your chart with multiple scattered indicators, we combined the most powerful institutional metrics into a single, clean, lightweight, and highly responsive interface for MetaTrader 5. Grounded in Auction Market Theory, this indicator reveals the true market structure. Ke
Volume Profile V6
Andrey Kolesnik
4.67 (3)
市场的成交量曲线指标+一个智能振荡器. 它适用于几乎所有工具-货币对,股票,期货,加密货币,实际交易量和报价。 您可以设置配置文件范围的自动定义,例如,一周或一个月等。,并通过移动边界(两条垂直线红色和蓝色)手动设置范围。 示为直方图。 此级别直方图的宽度有条件地意味着在其上进行的交易数量。 使用"模式水平线颜色"参数,您可以设置自动显示价格可能会击退的最重要交易量水平,而最大颜色参数则分别显示整个设定范围内最大交易量的水平。     智能振荡器显示超买和超卖区域,它分析来自多个指标的信息,并根据处理的数据,以适当的颜色为超买和超卖区域着色。     在Volume every day中,您可以使用Range period参数设置构建配置文件的时间范围,并使用Range count参数设置这些范围的配置文件数量。 例如,Range period=1day,Range count=10表示配置文件将基于一天的周期,即最后十天。 重要的是,切换图表的时间框架不会影响配置文件的构建,这也是该指标的一个额外优势。      该指标非常简单易用,同时尽可能提供信息。 有了这个指标,做市商将
SMC Venom 模型 BPR 指標是針對在智慧貨幣 (SMC) 概念內工作的交易者的專業工具。它會自動辨識價格圖表上的兩種關鍵模式: FVG (公平價值缺口)是三根蠟燭的組合,其中第一根和第三根蠟燭之間存在缺口。它在水平之間形成一個沒有成交量支撐的區域,這通常會導致價格調整。 BPR (平衡價格區間)是兩種 FVG 模式的組合,形成一個「橋樑」 - 當價格以低成交量活動移動時,突破並返回到水平的區域,從而在蠟燭之間產生間隙。 這些模式可協助交易者透過分析圖表上的交易量和價格動態(大型市場參與者和普通參與者之間的互動)來識別關鍵的支撐/阻力位、突破區域和切入點。 此指標以矩形和箭頭的形式可視化模式,也支援靈活的警報設定。 主要特點: 模式顯示模式:選擇顯示 BPR 模式(看漲和看跌)或 FVG 模式(看漲和看跌)。 可以隱藏所有圖表分析模式。 以條數過濾:BPR 結構中 FVG 之間的最小/最大距離。 訊號的附加視覺化: 箭頭有 9 種類型可供選擇(標準、細、分形等)或手動輸入 Wingdings 代碼,其表格可以選擇性地顯示在圖表上。 設定顏色、尺寸及其縮放時相對於價格的動態
Time and Sales Tick
Pablo Filipe Soares De Almeida
Time & Sales Tick Indicator 是一款专为 MetaTrader 5 平台设计的实时报价与成交监控指标。 该工具能够在图表上实时显示每笔交易的价格、成交量与时间信息,帮助交易者观察市场的细微波动与订单流动。 功能说明 在图表中的独立面板上实时展示价格、成交量与成交时间,便于跟踪市场动态。 可根据用户自定义的时间或数量间隔对成交数据进行分组。 系统自动对价格变动进行颜色区分:上涨以绿色显示,下跌以红色显示,使趋势变化一目了然。 面板可自由放置在图表的任意角落,支持调整大小、字体、透明度和刷新速度。 与所有交易品种和时间周期兼容,可在 MetaTrader 5 平台上稳定运行,不影响主图性能。 适用于分析市场活跃度、监控流动性以及辅助短线或高频交易策略。 此指标为交易者提供了更直观的市场视图,使其能够在高波动市场中更好地识别短期机会并改进决策效率。
Rolling vwap atr market panel
Florian Alain Bernard Jean-paul Pierre Cuiset
Rolling VWAP + ATR Bands + Market Panel — powerful visual tool for scalping, extensions detection and intraday market structure analysis. Rolling VWAP + Panel Rolling VWAP + Panel is a professional MetaTrader 5 indicator designed to analyze market structure using a Rolling Volume Weighted Average Price (VWAP) combined with ATR-based volatility bands , a real-time market analysis panel , and an integrated candle countdown timer . This indicator provides a clear and structured view of price beha
FREE
Volume Profile For MT5
Abdelkhabir Yassine Alaoui
Volume Profile is a very useful indicator . it allows you to spot the price levels where important price action took place. It is similar to support and resistance levels but with a different logic. ( Check Out  Fixed Range Volume Profile MT5  ) One of the first thing that traders mark up when analyzing a chart is support and resistance. Volume Profile can be used for doing that too. The indicator scans the defined number of previous bars and calculates the volume of activity at each price le
CvdDeltaVolumes
Parasbhai N Patel
Delta + CVD & CVD Candles Order-flow indicator combining Delta (Ask–Bid), Cumulative Volume Delta (CVD), and a unique CVD-based synthetic candle system. Shows buy/sell pressure, volume aggressiveness, and momentum shifts with optional Delta histogram, CVD line, and CVD+Delta combined candles. Useful for scalping, intraday trading, divergence detection, and understanding buyer/seller dominance. Overview The Delta + CVD & CVD Candles Indicator combines multiple order-flow tools into one clean
Anchored VWAP Simple
Renan Souza Da Motta
This is a simple Volume Weighted Average Price (VWAP) indicator. Simply add it to the chart and adjust the vertical line that is used as start anchor point and it is done. Volume Weighted Average Price (VWAP) is a trading benchmark that represents the average price a security has traded at throughout the day, based on both volume and price. It is calculated as the sum of price times volume for each trade, divided by total volume.
FREE
Equity Shield Pro 1.1 NEW VERSION  Equity Shield Pro 1.1 is a powerful utility EA designed to safeguard your trading account by actively monitoring and enforcing equity protection and profit management rules. Whether you’re trading personal accounts or working through proprietary firm challenges, this EA ensures strict adherence to risk and profit targets, enabling you to maintain discipline and consistency. Fully compatible with all challenge types, Equity Shield Pro 1.1 is specifically craft
CVD SmoothFlow Pro
Thalles Nascimento De Carvalho
CVD SmoothFlow Pro - 适用于任何资产的无限量分析! CVD SmoothFlow Pro 是寻求精确和无限量分析的交易者的终极解决方案。该专业版利用累计成交量 delta (CVD) 并结合高级噪声过滤,为交易任何金融资产提供所需的灵活性和精确度。 CVD SmoothFlow Pro 提供了什么? 清晰分析 :过滤市场噪声,突显任何金融资产中的重要成交量变动。 ️ 精确计算 :监测买卖差异,提供外汇、指数、加密货币等资产的成交量行为的详细视图。 直观界面 :提供易于理解和高效的分析,数据呈现清晰明了。 趋势识别 :更自信地识别市场趋势,帮助做出明智决策。 实际应用: 实时监测任何资产中买卖双方的平衡。 基于成交量识别趋势反转。 精确过滤,关注外汇、指数、加密货币等资产中的重要变动。 无限制的专业版! 专业版提供无限制的所有功能访问权限,让您能够对任何金融资产进行详细和无限量的分析。
Avwap
Pablo Filipe Soares De Almeida
Avwap 主要功能: 自动每日 VWAP(每天服务器时间 00:00 完美重新开始) 8 种价格计算方式:Close、(H+L+C)/3、(H+L)/2、(O+C)/2、(O+H+L+C)/4 等 锚定 VWAP 模式:只需将垂直线拖到过去的任何位置,VWAP 会立即从该点重新计算 垂直线的颜色、粗细和样式 100% 可自定义(你决定如何显示锚点) 图表中没有标签或文字 代码极度优化 锚定 VWAP 的巨大优势: 普通日 VWAP 只适用于当前交易日。 锚定 VWAP 允许你: 准确查看从最近上涨/下跌波段低点开始的成交量加权平均价格 分析从突破重要区域以来的公允价格 从任何选定点进行基于 VWAP 的视觉回测 精确识别价格是否在某一特定事件(新闻、缺口等)以来的累积成交量上方或下方交易 总结:普通 VWAP 显示“今天发生什么”,而锚定 VWAP 显示“从我认为重要的点开始发生什么”。这完全改变你读取价格的方式。 适用于: Price Action Tape Reading / Volume Profile 日内交易和波段交易 指数、股票、期货和外汇交易
Weis Wave Result MT5
Sant Clear Ali Costa
Features 3 types of waves: bullish, bearish and unknown. The unknown tower comes when prices move in opposite the direction of the current tower. Label that shows the percentage remaining for the next tower. Allows you set the type of volume that will be accumulated in the towers, either real or tick volumes. Thus, the indicator works in any market, for example: stocks, futures, forex, commodities, etc. Allows you to set the required score for the tower exchange. Allows you to set the font size
An anchored Vwap With Arrows is an indicator that includes a moving average weighted by volume that allows you to plot on a bottom or a top. Usually banks and institutions measure an average price, this average price is a price range where they agree to make a trade. Using the logic of anchored vwap with arrows it is possible to understand that if the price breaks the vwap it means that someone with enough buying and selling power has lost control. You can use vwap anchored with arrows in any ti
Harmonic Pattern Structure Harmonic Pattern Structure is a professional MetaTrader 5 indicator that automatically detects classic harmonic patterns using strict Fibonacci ratio validation and XABCD price structure. Designed for traders who value precision, clean visuals, and structured analysis, the indicator highlights potential reversal zones based on price geometry, supporting consistent and objective decision-making. SUPPORTED HARMONIC PATTERNS Gartley (222) Butterfly Bat Crab Shark Cy
Blahtech Supply Demand MT5
Blahtech Limited
4.54 (13)
Was: $299  Now: $99  Supply Demand uses previous price action to identify potential imbalances between buyers and sellers. The key is to identify the better odds zones, not just the untouched ones. Blahtech Supply Demand indicator delivers functionality previously unavailable on any trading platform. This 4-in-1 indicator not only highlights the higher probability zones using a multi-criteria strength engine, but also combines it with multi-timeframe trend analysis, previously confirmed swings a
Hull Heikin Ashi Smoothed
Flavio Javier Jarabeck
Heikin Ashi candlesticks are a powerful tool for traders, offering a clear and smooth visualization of market trends. Unlike traditional candlesticks, they filter out market noise, providing a cleaner view of the market's direction and strength, which helps traders make more informed decisions. The Hull Heikin Ashi Smoothed indicator from Minions Labs takes this a step further by integrating the Hull Moving Average for enhanced smoothing and precision. This indicator not only simplifies trend id
该产品的买家也购买
SuperScalp Pro
Van Minh Nguyen
4.72 (18)
SuperScalp Pro – 高级多重过滤剥头皮指标系统 SuperScalp Pro 是一款高级剥头皮指标系统,将经典 Supertrend 与多重智能确认过滤器相结合。该指标在 M1 到 H4 的所有时间框架上均运行良好,尤其适用于 XAUUSD、BTCUSD 及主要外汇货币对。可作为独立系统使用,也可灵活整合到现有交易策略中。 指标集成超过 11 个过滤器,包括快慢 EMA、用于趋势判断的三条 EMA、EMA 斜率 (EMA slope)、RSI、ADX、成交量、VWAP、布林带突破(Bollinger Bands Breakout)以及 MACD 背离过滤器。智能蜡烛过滤器用于确认蜡烛收盘并剔除弱信号,而以三条 EMA 结合 MACD 背离的趋势识别机制则有助于筛选出更高胜率的交易信号。 SuperScalp Pro 基于 ATR 自动计算进场(Entry)、止损(Stop Loss)和止盈(Take Profit)水平。所有重要价格水平均直接显示在图表上,方便用户管理风险并做出更精准的交易决策。 系统在超过 5,000 根蜡烛上进行模拟与性能分析,展示完整指标如胜率、总交
Azimuth Pro
Ottaviano De Cicco
5 (6)
上市促销 Azimuth Pro 前100位买家特惠价 299 美元。最终价格为 499 美元。 散户与机构入场的区别不在于指标,而在于位置。 大多数交易者在任意价格水平入场,追逐动量或对滞后信号做出反应。机构投资者等待价格到达供需真正转换的结构性水平。 Azimuth Pro 自动映射这些水平:波段锚定VWAP、多时间框架结构线,以及仅在高概率位置出现的ABC形态。 Azimuth Pro 专为需要结构分析和智能自动化的专业交易者打造。 Azimuth 以外科手术般的精度映射市场结构,而Azimuth Pro增加了智能层:自动检测您的交易风格、智能配置的移动平均线,以及经过20年数据回测优化的参数。结果是专业级分析自动适应您的交易品种和时间框架。 这是我们Merkava Labs每天为自己和客户使用的指标。 PRO版本的独特之处 智能配置 Pro版本理解您的交易环境。将它放在EURUSD M15上,它知道您在做日内交易。放在BTCUSD H4上,它会调整为波段交易。无需手动调整。 自适应移动平均线 标准EMA有效。但ATR自适应StepMA(响应波动率)和动
Divergence Bomber
Ihor Otkydach
4.9 (86)
购买该指标的每位用户将额外免费获得以下内容: 原创工具“Bomber Utility”,该工具会自动跟踪每一笔交易,设置止损和止盈点,并根据策略规则自动平仓; 适用于不同交易品种的指标设置文件(Set 文件); 三种不同风险模式下的 Bomber Utility 设置文件:“最低风险”、“平衡风险” 和 “观望策略”; 一套详细的 视频操作手册,帮助您快速完成安装、配置并开始使用本交易系统。 注意: 要获取以上所有赠品,请通过 MQL5 的私人消息系统联系卖家。 我为您介绍原创的自定义指标 “Divergence Bomber”(背离轰炸机),它是一套基于 MACD 背离交易策略 的“全功能”交易系统。 该技术指标的主要任务是识别 价格与 MACD 指标之间的背离,并发出交易信号(包括推送通知),指示未来价格可能的运动方向。平均而言,这些信号的准确率超过 98%。有关该指标如何工作的详细说明,请观看本页面上的视频演示。 该系统使用 止损订单 和 动态回撤平仓机制 来管理交易。 Divergence Bomber 指标的主要特点: 支持交易的品种: AUDCAD、AUDCHF、AUDSG
Power Candles MT5
Daniel Stein
5 (7)
Power Candles – 适用于所有市场的基于强度的入场信号 Power Candles 将 Stein Investments 经过验证的强度分析直接带入价格图表。与仅对价格作出反应不同,每一根蜡烛都基于真实的市场强度进行着色,使交易者能够立即识别动能累积、强度加速以及清晰的趋势转换。 一套逻辑,适用于所有市场 Power Candles 可自动适用于 所有交易品种 。该指标会检测当前品种是否为外汇货币对或非外汇市场,并在内部自动应用相应的强度模型。 外汇与黄金 使用 FX Power Delta 数值(绝对范围最高至 100) 指数、加密货币和 CFD 使用 IX Power 强度数值(绝对范围最高至 50) 所需的强度计算已直接嵌入 Power Candles。本指标在蜡烛着色和信号逻辑方面无需额外安装任何其他指标。 以强度状态替代价格噪音 每根蜡烛都会被归类为九种清晰定义的强度状态之一: 中性 轻度、中度、强烈、极端空头 轻度、中度、强烈、极端多头 这种基于状态的方法能够过滤随机的价格波动,专注于有意义的市场参与行为。它帮助交易者识别新的方向性阶段正在形成,而不是对单根蜡
Entry In The Zone and SMC Multi Timeframe is a real-time 2-in-1 market analysis tool that combines market structure analysis and a No Repaint BUY / SELL signal system into a single indicator, built on Smart Money Concepts (SMC) — a widely adopted framework used by professional traders to understand market structure. This indicator helps you see the market more clearly, make decisions based on structure rather than guesswork, and focus on high-probability zones where price is more likely to react
购买此指标即可免费获得我的专业交易管理器。 首先,值得强调的是,这个交易系统是一个非重绘、非重画和非滞后的指标,这使得它非常适合手动和机器人交易。 在线课程,手册和下载预设。 “智能趋势交易系统 MT5”是专为新手和经验丰富的交易者量身定制的综合交易解决方案。它结合了超过 10 个优质指标,具有 7 多个强大的交易策略,使其成为适用于各种市场条件的多功能选择。 趋势跟随策略:提供精确的入场和止损管理,以有效地跟随趋势。 反转策略:识别潜在的趋势反转,使交易者能够利用区域市场的机会。 剃头策略:专为快速准确的日内交易和短期交易而设计。 稳定性:所有指标都不会重绘、不会重画和不会滞后,确保可靠的信号。 定制:支持自定义策略,以满足个人交易偏好。超过 7 种策略和组合可帮助您找到最佳策略。 信号清晰度:提供箭头信号,以指示清晰的入场和退出点。 实时警报:通过交易进出警报使交易者保持了解。 深入分析:提供更高时间框架的趋势分析和实时交易监控。 自适应颜色编码:利用蜡烛颜色编码来显示成交量、趋势和反转蜡烛信号。通过蜡烛颜色分析市场方向。 “智能趋势交易系统 MT5”赋予交易者必要的工具,以便在
OmniSync Projection
Antonio-alin Teculescu
5 (1)
Chronos Fractal Engine is an innovative price projection indicator for MetaTrader 5, designed to transform your technical analysis by intelligently identifying and projecting historical price patterns. Built upon an advanced correlation algorithm and the fractal principles of the market, this powerful tool visualizes potential future price movements, giving you a unique edge in your trading decisions. What is Chronos Fractal Engine? At its core, the Chronos Fractal Engine employs a sophisticat
Meridian Pro
Ottaviano De Cicco
5 (1)
Meridian Pro:MT5专业多时间框架趋势矩阵 概览 Meridian Pro 是 Merkava Labs 推出的多时间框架趋势矩阵,将方向状态、强度、动量条件和矩阵一致性压缩到一个紧凑面板中。一个自适应引擎,从M1到W1一致应用。无需逐品种调参。无需堆叠指标。一个结构化读数覆盖所有资产和所有时间框架。 上市优惠 — Meridian Pro 优惠价 USD 99 (限时)。常规价格:USD 149 。 1. Meridian Pro 为何不同 一个引擎,而非互不相连的指标仪表盘 许多MTF仪表盘只是在各时间框架重复原始指标状态。Meridian Pro在整个矩阵中使用一个自适应趋势引擎,面板中的每一行都来自同一个结构化框架。这使其读取快速、使用简洁,在真实图表条件下实用。 合成时间框架架构 Meridian Pro不依赖常规的零售MTF方法,而是从 M1数据 构建统一的内部矩阵结构。无经典MTF同步问题。无因脆弱的高时间框架拼接导致的重绘或延迟。无因不稳定时间框架依赖导致的面板冻结。在不同高时间框架数据质量的经纪商之间具有更好的稳健性。 2. 面板显示内容 Bias — 每
Power Bar MT5
Daniel Stein
在冒真金白银之前, 先看看哪种策略真正适合你的品种。 Power Bar 可在任何品种和任何时间周期上检测 极端价格K线 , 然后即时回测3种不同的交易策略, 让你并排比较胜率、盈亏比和收益。全部集成在一个交互式面板中。 无需猜测。无需过度拟合。只看数据。 Power Bar 有何独特之处? 大多数指标只给你一个信号, 让你猜测它是否有效。Power Bar 更进一步: 它用 三种策略 测试每个信号并展示统计数据。一键切换 FlipFlop、Momentum 和 Reversal, 即刻看到数据变化。 FlipFlop - 始终持仓。信号入场, 反向信号出场。我们的研究表明, 这在 US30、US500 和 DAX 等趋势性指数上效果最佳。 Momentum - 顺信号方向交易。基于 ATR 的固定 SL/TP。适用于趋势延续形态的均衡方法。 Reversal - 逆信号交易(反向操作)。我们的回测显示, 在 JPY 外汇交叉盘上胜率超过 70%, 因为极端K线标志着衰竭而非延续。 更改参数, 即时查看结果 无需打开指标属性。直接在面板中通过 +/- 按钮调整 ATR 倍数、周期、
Trend Screener Pro MT5
STE S.S.COMPANY
4.85 (104)
使用趋势筛选指标释放趋势交易的力量:由模糊逻辑和多货币系统提供支持的终极趋势交易解决方案! 使用趋势筛选器(由模糊逻辑提供支持的革命性趋势指标)提升您的趋势交易。 它是一个强大的趋势跟踪指标,结合了超过 13 种高级工具和功能以及 3 种交易策略,使其成为使您的 Metatrader 成为趋势分析器的多功能选择。 限时优惠:趋势筛选指标终身仅需 50 美元。 ( 原价 250$ ) (优惠延长) 体验趋势筛选器 100% 无需重新绘制的准确性,确保您的交易决策不受过去价格变化的影响。 释放多时间框架和多货币功能的多功能性,使您能够以无与伦比的信心在外汇、商品、加密货币和指数领域进行交易。 利用 Trend Screener 的综合策略套件增强您的交易: - 趋势跟踪策略和趋势延续策略 :趋势筛选器的趋势跟踪策略提供清晰的趋势延续信号,让您有效捕捉趋势走势并管理风险。 - 反转策略和早期入场点策略 :趋势筛选器的反转策略可检测市场方向的潜在变化,使您能够预测趋势反转并利用疲弱的市场趋势。通过早期入场点,您可以在潜在的趋势变化之前定位自己 获取可观的利润。 - 倒卖策略: 趋势筛选器的倒卖
FX Trend MT5 NG
Daniel Stein
5 (4)
FX Trend NG:新一代多市场趋势智能分析工具 概述 FX Trend NG 是一款专业的多时间周期趋势分析与市场监控工具,帮助您在几秒钟内全面了解市场结构。 无需在多个图表之间来回切换,您可以立即看到哪些品种处于趋势中、哪里动能正在减弱,以及哪些时间周期之间存在强烈共振。 限时发布优惠 – 仅需 $30(6个月) 或 $80 终身授权 即可拥有 FX Trend NG 。 已经是 Stein Investments 客户? -> 发送消息 以获取专属客户群访问权限。 需要帮助或安装指导? -> 请访问 Stein Investments 官方页面 。 1. FX Trend NG 的核心优势 三状态趋势逻辑 —— 不只是 Buy 或 Sell • 大多数指标仅显示两种状态:Buy 或 Sell。 • FX Trend NG 增加第三种状态: Fade 。 • Fade 表示趋势强度正在减弱,在完全反转之前提前发出信号。 这种结构化逻辑让您看到趋势变化过程,而不仅仅是简单方向信号。 多时间周期分析(M1 至 MN1) • 从短线交易到中长线交易全面覆盖。 • 快速识别趋势
Atomic Analyst MT5
Issam Kassas
3.94 (31)
首先值得强调的是,该交易指标是非重绘、非延迟的指标,这使其成为手动和机器人交易的理想选择。 用户手册:设置、输入和策略。 Atomic Analyst是一种PA价格行动指标,利用价格的力量和动量来寻找市场上更好的机会。配备了高级过滤器,可帮助去除噪音和假信号,并提高交易潜力。使用多层复杂的指标,Atomic Analyst扫描图表,并将复杂的数学计算转化为任何初学者都能理解并用来做出一致交易决策的简单信号和颜色。 “Atomic Analyst”是专为新手和经验丰富的交易者量身定制的综合交易解决方案。它将高级指标和一流功能融合为一体的交易策略,使其成为所有类型交易者的多功能选择。 日内交易和剥头皮策略:专为快速准确的日内交易和短期交易而设计。 日内和摆动交易策略:可用作追求价格大幅波动的日内和摆动交易者的可靠工具。 多货币和市场:凭借其可靠的精度,在不同的工具和市场上运作。 多个时间框架:可在多个时间框架上使用,性能良好。 稳定性:所有指标均不重绘、不重绘和不滞后,确保可靠的信号。 信号清晰度:提供箭头信号,用于清晰的入场和出场点。 实时警报:通过交易入场、SL和TP警报通知交易者
RFI levels PRO MT5
Roman Podpora
3.67 (3)
该指标能够准确显示反转点和价格回落区域。     行业领军人物 。您能洞察新趋势的形成,并以最高的精准度做出决策,掌控每一笔交易。 VERSION MT4     -    与……结合时,展现其最大潜力     趋势线专业版   指标 该指标显示的内容: 新趋势开始时的反转结构和反转水平及其激活。 显示屏   获利了结   和   止损   风险回报比最低的水平     RR 1:2       。 具有智能减值逻辑的止损。 显示指定指标中两种趋势类型的反转形态。 指标: 根据     趋势线     (全球趋势变化) 潮流专业版     (趋势快速变化) 简单有效   扫描器   实时趋势(新增)。 多时间框架工具筛选。 展示   利润   在 LOGIC AI 信号之后。 以下列出今日走势积极的金融工具。(RB键) 能够为终端启用通知(警报)功能,并向移动设备推送通知。 逻辑人工智能     — 利用人工智能寻找最佳切入点。 只有在启用 MTF(多时间框架分析)模式时,该功能才可用。 兼容性。 当与趋势线指标结合使用时,该指标能发挥其最大潜力。 这     RFI LEVELS
Trend indicator AI mt5
Ramil Minniakhmetov
5 (16)
趋势人工智能指标是一个伟大的工具,将加强交易者的市场分析结合趋势识别与可操作的进入点和逆转警报。 该指标使用户能够自信和精确地驾驭外汇市场的复杂性 除了主要信号,趋势Ai指标识别在回调或回调期间出现的次要入口点,使交易者能够利用既定趋势内的价格修正。 重要优势: *MT4及MT5工程 *明确买入或卖出信号 ·不重绘 *适用于所有资产 小心我不卖EA或设置电报它骗局. 所有设置免费在这里的博客。  重要! 购买后立即与我联系,以获得指示和奖金! 真实的操作监控以及我的其他产品可以在这里找到: https://www.mql5.com/en/users/mechanic/seller&nbsp ; 设置和输入: 建议为所有资源设置默认设置。 第...
Crystal Heikin Ashi Signals
Muhammad Jawad Shabir
5 (2)
Crystal Heikin Ashi Signals - Professional Trend & Signal Detection Indicator Advanced Heikin Ashi Visualization with Intelligent Signal System for Manual & Automated Trading Final Price: $149 ---------> Price goes up $10 after every 10 sales . Limited slots available — act fast . Overview Crystal Heikin Ashi Signals is a professional-grade MetaTrader 5 indicator that combines pure Heikin Ashi candle visualization with an advanced momentum-shift detection system. Designed for both manual traders
Btmm state engine pro
Garry James Goodchild
5 (3)
BTMM State Engine Pro is a MetaTrader 5 indicator for traders who use the Beat The Market Maker approach: Asian session context, kill zone timing, level progression, peak formation detection, and a multi-pair scanner from a single chart. It combines cycle state logic with a built-in scanner dashboard so you do not need the same tool on many charts at once. What it does Draws the Asian session range; session times can follow broker server offset or be set in inputs. Tracks level progression (L
Gann Made Easy MT5
Oleg Rodin
5 (2)
Gann Made Easy   是一个专业且易于使用的外汇交易系统,它基于使用先生理论的最佳交易原则。 W.D.江恩。该指标提供准确的买入和卖出信号,包括止损和获利水平。您甚至可以使用推送通知在旅途中进行交易。 购买后请联系我,即可免费获得交易指导和超棒的额外指标! 您可能已经多次听说过江恩交易方法。通常 Gann 的理论不仅对于新手交易者而且对于那些已经有一定交易经验的人来说都是非常复杂的东西。这是因为江恩的交易方法在理论上并不那么容易应用。我花了几年时间来完善这些知识,并将最好的原则应用到我的外汇指标中。 该指标非常易于应用。您所需要的只是将其附加到您的图表并遵循简单的交易建议。该指标不断进行市场分析工作并寻找交易机会。当它检测到一个好的入口点时,它会为您提供一个箭头信号。该指标还显示止损和获利水平。 换句话说,当您像先生一样进行交易时,该指标会为您提供最佳江恩建议。江恩亲自告诉你此时此刻该做什么。但最好的部分是您不需要了解任何有关江恩交易原则的知识,因为该指标会为您完成整个市场分析工作。
Currency Strength Dashboard Pro
Anastasia Danilova
5 (1)
Currency Strength Dashboard Pro 适用于 MetaTrader 5 的专业级实时货币强度分析面板。 该指标同时对 8 种主要货币 (EUR、USD、GBP、JPY、CHF、AUD、CAD、NZD)进行强度计算,并基于 28 个货币对 在多个时间周期上进行分析和显示。 该面板让交易者能够 一眼看清整个市场状况 —— 无需额外计算,也无需在多个图表之间切换。 计算方法 该指标基于一种 先进的数学货币强度计算方法 ,相比许多类似指标常用的 RSI 方法 ,具有更高的准确性和客观性。 该方法同时分析 全部 28 个货币对之间的关系 ,从而提供更清晰、更无偏差的市场真实强弱对比。 实时分析面板 主表格显示 8 种货币 的完整数据: Rank(排名) — 按整体强度排序, 1 为最强,8 为最弱 。 Strength(强度) — 当前货币强度的数值。 Change(变化) — 与上一根K线相比的强度变化。 Slope(斜率) — 强度趋势方向:上升、下降或横盘。 时间周期数据(M15、H1、H4、D1) — 各时间周期的独立强度值。 Composite(综合值) —
FX Power MT5 NG
Daniel Stein
5 (31)
FX Power:分析货币强度,助您做出更明智的交易决策 概述 FX Power 是一款专业工具,帮助您全面了解主要货币和黄金在任何市场条件下的真实强度。通过识别强势货币用于买入,弱势货币用于卖出, FX Power 简化了交易决策,并帮助您发现高概率的交易机会。不论您是想跟随趋势还是通过极端的 Delta 值预测反转,这款工具都能完美适应您的交易风格。别再盲目交易——用 FX Power 让您的交易更加智慧。 1. 为什么 FX Power 对交易者极具价值 实时货币和黄金强度分析 • FX Power 实时计算并显示主要货币和黄金的相对强度,助您全面了解市场动态。 • 监控领先或落后资产,轻松识别值得交易的货币对。 全面的多时间框架视图 • 跟踪短期、中期和长期时间框架的货币和黄金强度,以便将您的交易策略与市场趋势保持一致。 • 无论是快进快出的短线交易还是更长期的投资策略, FX Power 都能为您提供所需的信息。 Delta 动态分析用于趋势和反转 • 极端 Delta 值常常预示反转机会,而平缓的 Delta 变化则确认趋势延续。 • 使用 Delta 分析,轻
RelicusRoad Pro MT5
Relicus LLC
5 (24)
RelicusRoad Pro: 量化市场操作系统 终身访问限时 70% 折扣 - 加入 2,000+ 交易员社区 为什么大多数交易者即使拥有“完美”指标也会失败? 因为他们在真空中交易 单一概念 。没有背景的信号是赌博。要持续获胜,您需要 共振 (CONFLUENCE) 。 RelicusRoad Pro 不是一个简单的箭头指标。它是一个完整的 量化市场生态系统 。它描绘价格运行的“公允价值之路”,区分市场噪音和真实的结构性突破。 停止猜测。开始用机构级“路”逻辑进行交易。 核心引擎:“Road” (路) 算法 系统的核心是 Road Algo ,一个实时适应市场条件的动态波动率通道。它投射出 安全线 (平衡) 和价格可能反转的 扩展水平 。 Simple Road: 典型市场的标准结构映射。 Smooth Road: 针对震荡盘整的降噪计算。 Breakout Road: 专为识别波动率扩张和爆发性走势而调整。 1. 算法动量与确认 我们的“剥头皮箭头”不只是简单的交叉。它们利用 高阶多项式逻辑 过滤噪音,确保信号与主周期一致。我们检测动量、价格行为和 Road 结构汇聚的精确入场
HFT Spike Detector
OMG FZE LLC
5 (2)
[ My Products ] , [ My Channel ]   ,  [ LIVE SIGNAL ] HFT Spike Detector HFT Spike Detector 是一款专业的 tick 监控工具,旨在实时分析和测量高频交易(HFT)引发的价格剧烈波动。 其目标是通过数值数据帮助您识别由经纪商引起的异常滑点、流动性缺口以及毫秒级价格跳动。 由于它分析的是实时逐笔数据流和订单执行条件,因此无法通过回测进行准确评估。 您可以购买此EA,并结合现成的参数设置文件(set文件)实现自动化: VolumeHedger EA 工作原理 该 Expert Advisor 会实时分析每一个传入的 tick 数据,并: 价格变化速度 每秒 tick 密度 滑点幅度 同方向微观流动 进行测量并以图表面板形式展示。 因此,您可以看到除点差之外的真实执行质量。 面板显示指标 Slippage 显示监控 tick 中的最大滑点值(以 points 为单位)。 用于检测突发流动性缺口和激进的价格跳动。 Avg Slippage 显示所有传入 tick 的滑点平均值(以 p
Market Structure Order Block Dashboard MT5 是一款用于 MetaTrader 5 的 MT5 指标 ,专注于 市场结构 与 ICT / Smart Money Concepts: HH/HL/LH/LL 、 BOS 、 ChoCH ,并识别 Order Blocks 、 Fair Value Gaps (FVG) 、 流动性 (EQH/EQL、sweeps)、 交易时段 / Kill Zones ,内置 Volume Profile 与紧凑的共振评分仪表板。 重要说明: 这是一个 分析工具 。它不会下单,也不会管理仓位(不是 EA)。 买家赠品 购买后,您可以从我的商店中选择并获得 2 个赠品指标 (自选)。 如何领取赠品: 1) 在本产品页面留下真实评价。 2) 通过 MQL5 私信联系我,发送: BONUS MSOB + 您选择的 2 个指标名称 。 主要功能 市场结构: HH/HL/LH/LL 标注与 BOS / ChoCH 识别。 Smart Money 区域: 多空 Order Blocks 与关键 Fair Value Gaps
Bill Williams Advanced
Siarhei Vashchylka
5 (11)
Bill Williams Advanced is designed for automatic chart analysis using Bill Williams' "Profitunity" system. The indicator analyzes four timeframes at once. Manual (Be sure to read before purchasing) Advantages 1. Analyzes the chart using Bill Williams' "Profitunity" system. Signals are displayed in a table in the corner of the screen and on the price chart. 2. Finds all known AO and AC signals, as well as zone signals. Equipped with a trend filter based on the Alligator. 3. Finds "Divergence Bar
CGE Trading Suite
Carl Gustav Johan Ekstrom
5 (1)
CGE Trading Suite delivers the analytical edge typically reserved for professional trading desks. The platform integrates a full suite of analytical tools into one seamless workflow: dynamic grid mapping, liquidity behavior analysis, ECM, trend lines, MIDAS, trade cycles, and directional channel projections. Together, these provide a unified view of market structure and momentum. Directional clarity is further enhanced by the capital flow index, which measures currency basket strength to identif
ARIPoint
Temirlan Kdyrkhan
ARIPoint is a powerful trading companion designed to generate high-probability entry signals with dynamic TP/SL/DP levels based on volatility. Built-in performance tracking shows win/loss stats, PP1/PP2 hits, and success rates all updated live. Key Features: Buy/Sell signals with adaptive volatility bands Real-time TP/SL/DP levels based on ATR Built-in MA Filter with optional ATR/StdDev volatility Performance stats panel (Success, Profit/Loss, PP1/PP2) Alerts via popup, sound, push, or email Cu
Gold Sniper Scalper Pro
Ich Khiem Nguyen
3.78 (9)
Gold Sniper Scalper Pro 是一款专为检测 XAUUSD 上的 假突破 (false breakout)形态而构建的 MetaTrader 5 指标。它识别 4 根K线陷阱结构——价格突破区间边界、吸引突破交易者入场、然后反转回区间内部——确认该突破为虚假突破。指标通过 17 个质量因子对每个交易设置评分,经过 4 层汇流管道评估,对照 7 个时间框架趋势共识引擎验证,并通过黄金波动率状态分类器过滤——所有这些都在信号显示在图表之前完成。 详细的用户指南可在作者的   MQL5 博客   中找到。额外更新可通过作者的   MQL5 频道   获取。 根据当前的支持政策,购买者可能会获得作者开发的精选配套工具的额外使用权限。 该系统也适用于外汇货币对、指数和加密货币,但其检测参数、波动率处理和过滤器逻辑针对 XAUUSD 的特性进行了优化。 4 根K线假突破形态 检测引擎识别特定的四组件K线结构。Mother Bar 建立清晰的价格区间。一到三根 Inside Bar 在该区间内形成,压缩价格。False Breakout Candle 将价格推出边界——扫
Trend Lines PRO MT5
Roman Podpora
5 (1)
趋势线专业版 -     有助于了解市场真正转变的方向。该指标显示了真正的趋势反转点以及主要参与者重新入场的点位。 你看     BOS线路   无需复杂设置或不必要的干扰,即可在高时间框架内显示趋势变化和关键水平。信号不会重绘,并在K线收盘后仍保留在图表上。 MT4 版本   - 与 RFI LEVELS PRO 指示器结合使用时,可发挥其最大潜力 该指标显示的内容: 真正的转变   趋势线(BOS线) 一旦信号出现,它就始终有效!这与会重绘的指标有着重要的区别,后者可能会发出信号后又改变信号,从而导致资金损失。现在,您可以更精准、更准确地进入市场。此外,还有一个功能:在箭头出现后,K线会着色,直到达到目标价位(止盈)或出现反转信号为止。 重复条目   以及主要玩家的充值 为了提高寻找入场点时的视觉清晰度,我们创建了一个模块,该模块首先显示买入/卖出区域,并在该区域内寻找最佳入场点。此外,我们还加入了智能逻辑来管理止损位,该逻辑会随着时间的推移逐步降低止损位的大小,从而降低入场时的初始风险( 移动止损位 )。 信号强度水平     (BOS) 该指标采用三个显著性等级来衡量趋势变化
PZ Trend Trading MT5
PZ TRADING SLU
3.8 (5)
许多盈利交易者不仅知道如何识别市场趋势,而且也能把握趋势建立后的交易机会。 Pz 趋势交易 指标设计用来在趋势行情中尽可能的赚取利润。 已建立的趋势提供了一揽子交易机会,但大多数趋势交易指标完全忽视了它们,让交易者在趋势行情时完全不知道该如何做!一般趋势指标只通知有关的趋势变化,但根本不足以得到卓越的回报. Pz 趋势交易 指标比一般趋势指标显示多达 20 倍的交易 , 因为它注重所谓的市场时机。它不仅显示当前的市场趋势,也有回调,内柱线的突破和调整。它令您在趋势回调之后介入,安全的柱线内突破金字塔加仓,以及发现潜在的反转,和已知的调整。 趋势改变 一个趋势改变在市场方向变化时发生。趋势变化在图表上用带数字的彩色圆圈显示。蓝色 (1) 信号为上涨开始, 而红色 (1) 信号为下跌开始。趋势变化并非评估当前价格动作的结果, 它意味着交易设置是不定时地。如果您正确使用本指标, 在趋势变化时, 您将将已经入场 (参看下面的调整)。 回调 但凡趋势在运动中,行情上下抖动,盈利者收割利润,且其它参与者入场。趋势回调代表好的买入机会,通常是由主力获利离场导致。如果行情在回调后回归上行, 指标将
Trend Hunter MT5
Andrey Tatarinov
5 (4)
Trend Hunter 是外汇、加密货币和差价合约市场的趋势指标。 该指标的一个特点是,它可以自信地跟随趋势,当价格略微刺穿趋势线时不会改变信号。 指标不会重新绘制;收盘后会出现入市信号。 当沿着趋势移动时,指标会显示趋势方向上的其他入场点。 根据这些信号,您可以使用较小的止损进行交易。 趋势猎人是一个诚实的指标。 当您将鼠标悬停在指标信号上时,会显示该信号的潜在利润和可能的止损。 当出现新信号时,您可以收到以下通知: 警报 推送通知 通过电子邮件通知 电报中的通知 图表的屏幕截图也会发送到 Telegram,因此您无需打开终端即可做出交易决定。 指标信号可以在电报频道中在线查看 https://www.mql5.com/zh/market/product/11085#!tab=comments&page=13&comment=50356403 趋势猎人扫描仪可帮助您评估其他货币对和时间范围的趋势方向。 您还可以使用扫描仪接收其他仪器的入场信号。 要自动化交易,您可以使用使用指标信号进行交易的顾问  该指标通过位于图表下方的便捷面板进行控制。 MT4 版本 https://www.
FX Levels MT5
Daniel Stein
5 (13)
FX Levels:适用于所有市场的高精度支撑与阻力 快速概览 想要精准确定适用于任何市场(外汇、指数、股票或大宗商品)的支撑与阻力吗? FX Levels 将传统的“Lighthouse”方法与前沿的动态分析相结合,实现近乎通用的准确性。依托真实经纪商经验和自动化的每日与实时更新, FX Levels 帮助您捕捉价格反转点、设置合理的盈利目标,并自信地管理交易。立即使用,体验更准确的支撑/阻力分析如何助力您的交易更上层楼! 1. 为什么 FX Levels 对交易者非常有利 极度精准的支撑 & 阻力区 • FX Levels 专为不同经纪商提供的行情源和时间设置而设计,可生成几乎相同的价位区,解决数据不一致的常见问题。 • 这意味着无论您在哪里交易,都能获得稳定一致的水平线,为策略打下更加牢固的基础。 结合传统与先进技术 • 通过将久经考验的“Lighthouse”方法与动态分析相融合, FX Levels 不仅限于每日刷新,还可针对新的价格波动进行即时更新。 • 您可以选择经典的静态方式,或实时捕捉新出现的水平,以贴近最新的市场行为。 识别清晰的反转点 • FX Lev
作者的更多信息
WT Candle Color by Volume
Ricardo Almeida Branco
The White's Candle Color indicator (by volume) will color the candles based on the current candle's volume compared to the moving average of the volume. This will allow you to see clearly if the volume (real or tick) is within the normal range, whether it is high or low and bring very important information about the market. I hope that this indicator can help in your operational. Success and good trades!
White Weis Volume Ticks
Ricardo Almeida Branco
5 (4)
White Weis Volume This indicator shows the sum of the volume in each wave, bulish or bearish, as idealized by David Weis , but it brings an important addition , which is the marking of the bar with the highest volume of the wave (White Bar)! In coding the indicator, it was sought to optimize the code to require minimal processing during use and not to overload mt5. The indicator can be used for pre-trading analysis and study, where the trader analyzes possible points of support and resistance
Volume Doji
Ricardo Almeida Branco
Hey guys. This indicator will show you, in the volume histogram, if the candle was a Doji, a bullish candle, or a bearish candle. The construction of this indicator was requested by a trader who uses other indicators from my catalog, and I decided to release it free to help traders who think that the indicator can contribute to their operations. The parameters are: Volume Type: Real Volume or Tick Volume. Color if the candle is bearish: select the color. Color if the candle is high: select
FREE
Display N Bars
Ricardo Almeida Branco
4.88 (8)
The Display N Bars utility is a simple tool designed to help identify candles. If a trader tries to share knowledge with a colleague but it is difficult to pinpoint exactly the desired candle, just say the corresponding candle number. The candle count is reset every day. Seeking to offer a good customization the inputs are: Display type -> Display only odd, only odd, or both candles? Direction -> Horizontal or Vertical? Display multiples of: (display frequency) -> Display all number
FREE
White Trader Clock
Ricardo Almeida Branco
5 (1)
Simple countdown indicator for the next candle. Only claim is to be light! The indicator inserts a text object to the right of the current price and calculates how much time is left for the new bar, showing this to the trader. Leave your comment if the indicator helped you in any way! If you have any suggestions, let me know to evaluate the improvements. Success and Good Trades!
FREE
Automatic Vwap Midas
Ricardo Almeida Branco
5 (1)
The 3 Automatic Vwap (Midas) Indicator can be used for Price and Volume studyers to map the movement of market drivers. It automatically plots 3 Vwaps, two of which are dynamic and will be updated throughout the day if new highs or new lows emerge. The third Vwap is daily and can help if the trend is up or down. Also, an auxiliary indicator that plots (also dynamic) points of interest with OHLC prices (Open, High and Low of the current day and Close of the previous day) was inserted. Success and
Start Vwap Custom Midas
Ricardo Almeida Branco
5 (3)
Attention: New update - 4 major practicality improvements! 1) Alarm 2) Midas text value 3) Click panel 4) Can be connected to an EA to operate in semi-automatic mode Attention - This indicator does not work perfectly in backtest due to MT5 peculiarities (Reading hotkeys or panel clicks) . My suggestion is that you test Automatic Vwap Midas which has automatic operation to analyze the calculation and then buy Start if you think the indicator will match your operating.     This indicator is use
O HL2 C Lines
Ricardo Almeida Branco
5 (2)
If you consider the extremes of the daily price as important points, this indicator will help in your trades. Now, instead of manually drawing lines that mark daily highs and lows, you can use the O (HL) ² C Lines indicator. Thus, the OHLC Lines indicator automatically plots the lines O (Open for the current day), H (High for the current day), L (Low for the current day) and C (Close for the previous day). Plot also the high and low of the previous day. Thus, we have 4 static lines and tw
PVA Dragon
Ricardo Almeida Branco
Users of PVRSA / PVA certainly already know the Dragon indicator and its use. The Dragon works as dynamic support and resistance and can be used for scalper or trend follower. In addition to the Dragon we have the WGT (fast) and EMA (slow) averages that can show immediate movement and also trend movement. Stay tuned for the Dragon's inclination! The indicator can be used on any asset/currency pair and can be customized according to the trader's interest. See also my volume analysis indicato
PVA Color Candle
Ricardo Almeida Branco
Several techniques use volume as an important point in the trade. Whether to indicate strength, exhaustion, pullback weakness, among others. In chief I quote Richard Wyckoff's theory, which said about the importance of looking price and volume. However, there are several possibilities to filter what is volume that should be noticed. PVRSA/PVA users use an indicator with specific colors, which assist in identifying the volume and type of movement that the price has made. Will the high volume
PVA Color Volume Histograma
Ricardo Almeida Branco
Several techniques use volume as an important point in the trade. Whether to indicate strength, exhaustion, pullback weakness, among others. In chief I quote Richard Wyckoff's theory, which said about the importance of looking price and volume. However, there are several possibilities to filter what is volume that should be noticed. PVRSA/PVA users use an indicator with specific colors, which assist in identifying the volume and type of movement that the price has made. Will the high volume
Color Histogram Volume Set
Ricardo Almeida Branco
Do you use volume in your reading of the market? Certainly many traders use it, and do not imagine operating without it. The Color Histogram Volume Set indicator allows the user to choose the value that he considers interesting to monitor. When you pass this you will have visual confirmation and if you want you will also have the audible alert that is given by the indicator. Of course, there are other ways to try to find a high volume, such as assessing whether the volume is above av
Color Candle Volume Set
Ricardo Almeida Branco
Do you use volume in your reading of the market? Certainly many traders use it, and do not imagine operating without it. The Color Candle Volume Set indicator allows the user to choose the value that he considers interesting to monitor. When you pass this you will have visual confirmation on the price chart and if you want you will also have the audible alert that is given by the indicator. Of course, there are other ways to try to find a high volume, such as assessing whether the vol
WT Vwap Bands
Ricardo Almeida Branco
The WT Vwap Bands indicator is an indicator that combines price and volume, helping to show whether the price is within the "fair price", overbought or oversold. The indicator code was designed for performance and has already been tested in a real trading account. In addition to the visual inputs (color, thickness and line style), the user can define a% value that depends on the price. The default values work with the most distant band at 1% of the price and then dividing this distance in
Fibo Z
Ricardo Almeida Branco
5 (1)
With it, you leave pre-configured two expansion settings and one fibo retraction configuration to use via keyboard shortcut and mouse click. That is, the Fibo_Z utility facilitates the use of MT5's native functions. The shortcut keys are: "Z" configuration 1 of the expansion. "X" expansion setting 2 "Z" retraction configuration. "V" clears objects from the screen. It is. Success and good trades!
Color HLC Bars and Candles
Ricardo Almeida Branco
Want to make the graph cleaner? Don't you use the opening price in your analysis? Want to use a chart model that was used by Richard Wyckoff? Then you need to know the Color HLC Candles and Bars indicator. In the same indicator you can switch to the display of candles or bars. Take a look at the other volume indicators to complement your operating. And don't forget to look at the best Vwap Custom (Midas)! Leave your comment! Success and good trades!
Vwap Freeze
Ricardo Almeida Branco
5 (1)
The previous day's vwap is used by some traders as a support and resistance point, after all it is one of the ways to consider the fair price of that asset or that pair the day before. Possible defenses can occur in this region indicating a reversal, or triggering stops starting a new, more directional movement. It is a matter of analyzing how it will add to your operational. To avoid manually drawing the previous day's vwaps and saving time for your analysis, use the Vwap Freeze indicator, as
Start Display N Bars
Ricardo Almeida Branco
5 (1)
Do you already know Display N Bars? Do you already know the Start tool (from Midas indicators)? In this indicator, we unified the two tools, allowing you to define which candle will start counting, or use the automatic numbering that was already available in the previous version. Description of the utility follows: Display N Bars The Display N Bars utility is a simple tool that aims to help identify candles. If a trader tries to share the knowledge with a colleague but it is difficult t
WT Vwap 5 Bands
Ricardo Almeida Branco
WT Vwap 5 Bands The WT Vwap Bands indicator is an indicator that combines price and volume, helping to show whether the price is within the "fair price", overbought or oversold. The indicator code was designed for performance and has already been tested in a real trading account. In addition to the visual inputs (color, thickness and line style), the user can define a% value that depends on the price. The default values work with the most distant band at 1% of the price and then dividing
Haos MT5
Ricardo Almeida Branco
5 (1)
The Haos oscillator coded for the MT5! This oscillator allows to verify overbought / oversold regions in two periods (14 and 96, for example), making it possible to anticipate a reversal. Possibility to activate an audible alert when it reaches a defined level. Possibility to choose the alert sound by placing a .wav song in each asset or timeframe. (save a .wav file to the MQL5 \ Files folder) Possibility to activate / deactivate histogram and levels to make the screen cleaner. Customizable col
VTC Volatility
Ricardo Almeida Branco
The VTC Volatility indicator was written to support a Brazilian stock market strategy in the WDO (USDBRL), but it can be adapted to other strategies and markets. In the new indicator update, it is now allowed to choose up to 4 levels to determine the range, and thus be more versatile. The Brazilian stock exchange (B3) has the VTC which is a "Structured Exchange Rate Volatility Transaction" (more information on the B3 website). At around 10:00 am, the VTC "Call" comes out and Brazilian broker
Vwap Standard Deviation
Ricardo Almeida Branco
O indicador Vwap Deviation Bands segue na mesma linha dos outros indicadores da White Trader, que buscam leveza, personalização e qualidade, para entregar o que há de melhor para o trader. Isto, além de combinar preço e volume (informações importantes para o trader) com uma medida estatística do desvio padrão. Este indicador já foi utilizado e testado por outros traders que deram sugestões, inclusive, para chegarmos nesta versão final (embora ainda esteja aceitando sugestões, sempre :)   ). O de
Midas is the acronym for Market Interpretation / Data Analysis System is a trade approach started in 1995 by technical analyst Paul Levine and later developed by Andrew Coles, PhD and David Hawkins. Learn more in the book MIDAS Technical Analysis: A VWAP Approach to Trading and Investing in Today's Markets , (I saw that it is possible buy via Amazon). The positive points in relation to the Midas-based indicators are the prediction of movement reversal points, the negative point is the subjectivi
Vwap Bands Auto
Ricardo Almeida Branco
The Vwap Bands Auto indicator seeks to automatically map the maximum market frequency ( automatic update of the outermost band ) and has two intermediate bands that also adjust to daily volatility. Another tool from White Trader that combines price and volume, in addition to mapping the daily amplitude. The external band is updated automatically when the daily maximum or minimum breaks the current frequency, and can be an input signal, seeking a return to the daily vwap. Thus, in addition t
Start Midas SD Channel
Ricardo Almeida Branco
5 (1)
Do you already know the Start Midas indicator? What about the Vwap Standard Deviation indicator? And I need to speak again in the book MIDAS Technical Analysis ... The Start Midas SD Channel indicator combines the two in one, bringing the practicality and efficiency of Midas with the statistical calculation of the standard deviation. All of this with the practicality of the White Trader Start indicators, where you can plot the indicator and move them on the screen using keyboard shortcuts
Start Midas Fibo Bands
Ricardo Almeida Branco
Here we have the Start Midas Fibo Bands , I confess that it is an indicator that excited me enough to operate because I was able to find more defined rules. Well, the indicator has the functions of the other indicators of the Start line , which is a possibility to plot several Midas on the screen, you can move the anchor point using keyboard shortcuts and use the legend to differentiate one anchor from another. The rules that I have analyzed for my possible setup are recommended to the entry, st
Prior Lines
Ricardo Almeida Branco
This indicator shows on the current day some lines of interest, such as maximum, minimum and closing of the previous day, as well as the opening, maximum and minimum price of the current day. It can also show the GAP (closing of the previous day and opening of the current day) and projections of the amplitude of the previous day, according to the value you choose in the multiplier. Oh, I was going to forget. It is also possible to determine the time frame, which is daily by default. If this i
Auto Zig HTF Vwap Midas
Ricardo Almeida Branco
5 (1)
The best Vwap Midas coding for Metatrader 5 you can find in White Trader indicators. The indicator has been optimized not to recalculate (improving performance) and has several visual settings for you to adapt in your own way. TRY IT FOR FREE by clicking the free demo button Where and why to use Vwap Midas (and Auto Zig Vwap Midas) can be used on a variety of indices, currencies, forex, cryptocurrencies, stocks, indices and commodities. Many successful traders use price and volume to get the
Danko Trend Color
Ricardo Almeida Branco
The Danko Trend Color indicator is actually a candle coloring to bring practicality, ease and information to your charts. Danko Trend Color combines PRICE AND VOLUME indicators to define the prevailing trend, so the colors are: Blue (indicates an uptrend) Orange (indicates a downtrend) White (indicates undefined trend) I don't like to promise anything with my indicators, I ask you to download, test it for free (for use in backtesting) and see if the indicator can, in some way, help your oper
Danko DTC Panel
Ricardo Almeida Branco
Do not buy before seeing the Danko Trend Color product, as this panel is a way to view a summary of this indicator on various timeframes. The Danko DTC Panel utility allows you to look at the trend in up to 5 timeframes. When clicking on the timeframe texts, a new window will open with the indicator plotted on the screen so you can see the complete chart. The width of the panel, with the amount of candles you want to see, is customizable, see the images below. Ao clicar nos textos dos timeframe
筛选:
Quantum Trader
3010
Quantum Trader 2021.06.14 17:16 
 

用户没有留下任何评级信息

Ricardo Almeida Branco
9992
来自开发人员的回复 Ricardo Almeida Branco 2021.06.14 18:19
Thanks again for your comment MAHMOUD! Good to know that the indicators I develop help you on trades! Success and good trades!
OmarKfoury
37
OmarKfoury 2021.02.25 16:58 
 

用户没有留下任何评级信息

Ricardo Almeida Branco
9992
来自开发人员的回复 Ricardo Almeida Branco 2021.05.18 05:10
Grande Omar!
Obrigado pelo comentário! Sucesso e bons trades!
Eduardo Silva Vian
328
Eduardo Silva Vian 2020.11.29 23:35 
 

用户没有留下任何评级信息

Ricardo Almeida Branco
9992
来自开发人员的回复 Ricardo Almeida Branco 2021.05.18 05:10
Opa! Vlw Eduardo! Obrigado pelo comentário! Sucesso e bons trades!
Enzo Castelo
56
Enzo Castelo 2020.11.29 19:31 
 

用户没有留下任何评级信息

Ricardo Almeida Branco
9992
来自开发人员的回复 Ricardo Almeida Branco 2021.05.18 05:10
Vlw Enzo!
Obrigado pelo comentário! Sucesso e bons trades!
回复评论