PVA Color Candle
- 指标
-
Ricardo Almeida Branco
 我从2018年开始在模拟账户中关注巴西证券交易所,发现使用的设置数量很有趣。 认真对待学习甚至是演示,我明白我应该开始编程以验证/放弃设置。
我是一名经过培训和专业的数学家,并且凭借我对编程的知识,我对mql5了如指掌(当然,我仍然在学习),并且我开始为交易员群体的一些朋友开发或调整指标我参与了,直到开发了我的第一个设置和专有指标。
那时,我在MIDAS技术分析一书中了解了Richard Wyckoff的研究以及Paul Levine,Andrews Cole和David Hawkins的研究,然后我开始研究更多有关价格和数量的知识,这使我意识到了数量在阅读中的重要性价格变动。 - 版本: 1.0
- 激活: 5
Several techniques use volume as an important point in the trade. Whether to indicate strength, exhaustion, pullback weakness, among others.
In chief I quote Richard Wyckoff's theory, which said about the importance of looking price and volume.
However, there are several possibilities to filter what is volume that should be noticed.
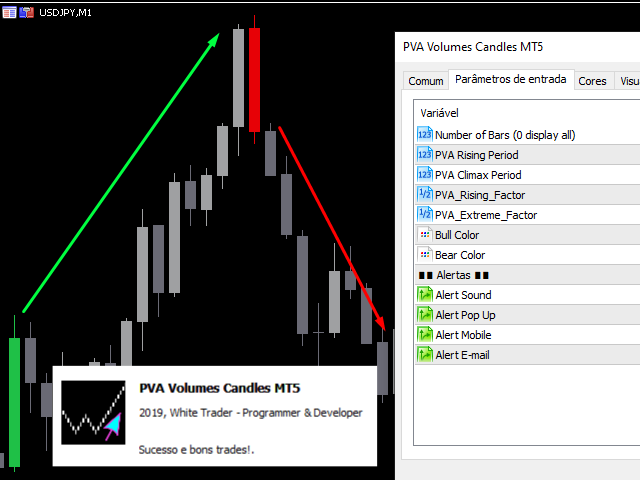
PVRSA/PVA users use an indicator with specific colors, which assist in identifying the volume and type of movement that the price has made.
Will the high volume candle serve as a resistance, or has it indicated a candle of exhaustion of movement and the trend will reverse?
This decision is the trader's, but will be aided by the pva color candle indicator coloring rule.
The indicator can be used on any asset/currency pair and can be customized according to the trader's interest.
See also my volume analysis indicator in the form of histogram and also the "Dragon", as they complete pva analysis (Price and Volume Analysis)
Success and good trades!
In chief I quote Richard Wyckoff's theory, which said about the importance of looking price and volume.
However, there are several possibilities to filter what is volume that should be noticed.
PVRSA/PVA users use an indicator with specific colors, which assist in identifying the volume and type of movement that the price has made.
Will the high volume candle serve as a resistance, or has it indicated a candle of exhaustion of movement and the trend will reverse?
This decision is the trader's, but will be aided by the pva color candle indicator coloring rule.
The indicator can be used on any asset/currency pair and can be customized according to the trader's interest.
See also my volume analysis indicator in the form of histogram and also the "Dragon", as they complete pva analysis (Price and Volume Analysis)
Success and good trades!