Prior Lines
- 指标
-
Ricardo Almeida Branco
 我从2018年开始在模拟账户中关注巴西证券交易所,发现使用的设置数量很有趣。 认真对待学习甚至是演示,我明白我应该开始编程以验证/放弃设置。
我是一名经过培训和专业的数学家,并且凭借我对编程的知识,我对mql5了如指掌(当然,我仍然在学习),并且我开始为交易员群体的一些朋友开发或调整指标我参与了,直到开发了我的第一个设置和专有指标。
那时,我在MIDAS技术分析一书中了解了Richard Wyckoff的研究以及Paul Levine,Andrews Cole和David Hawkins的研究,然后我开始研究更多有关价格和数量的知识,这使我意识到了数量在阅读中的重要性价格变动。 - 版本: 1.0
- 激活: 5
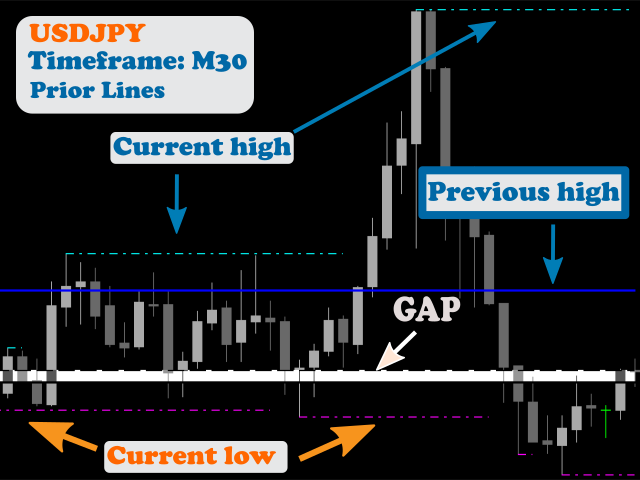
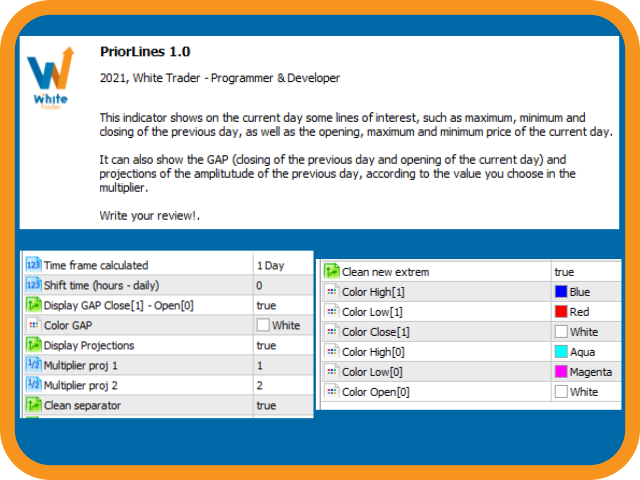
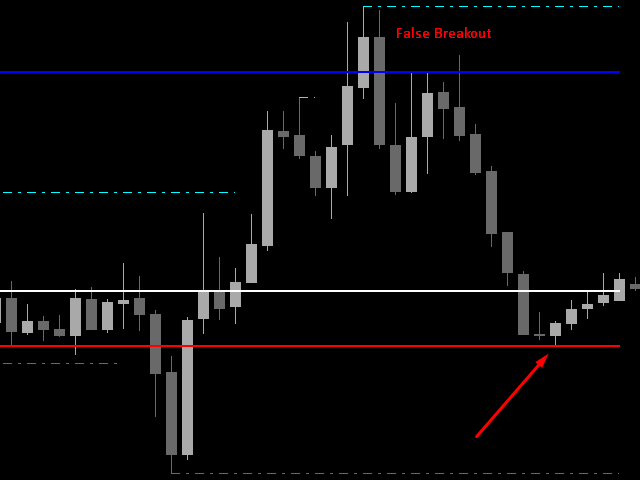
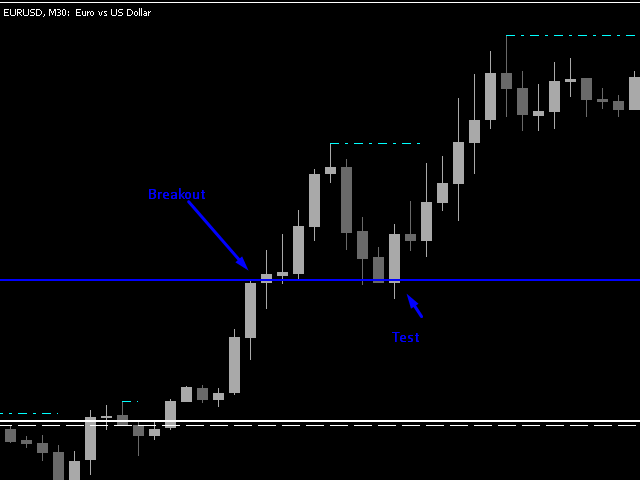
This indicator shows on the current day some lines of interest, such as maximum, minimum and closing of the previous day, as well as the opening, maximum and minimum price of the current day.
It can also show the GAP (closing of the previous day and opening of the current day) and projections of the amplitude of the previous day, according to the value you choose in the multiplier.
Oh, I was going to forget. It is also possible to determine the time frame, which is daily by default.
If this indicator can contribute to your operational, I'm grateful for your purchase.
Inputs:
- Time frame calculated
- Shift time (hours - daily)
- Display GAP Close[1] - Open[0]
- Color GAP
- Display Projections
- Multiplier proj 1
- Multiplier proj 2
- Clean separator
- Clean new extrem
- Color High[1]
- Color Low[1]
- Color Close[1]
- Color High[0]
- Color Low[0]
- Color Open[0]
Write your review!
If you have any suggestions for improvement, please be sure to let me know!
Success and good trades!