WT Vwap Bands
- 指标
-
Ricardo Almeida Branco
 我从2018年开始在模拟账户中关注巴西证券交易所,发现使用的设置数量很有趣。 认真对待学习甚至是演示,我明白我应该开始编程以验证/放弃设置。
我是一名经过培训和专业的数学家,并且凭借我对编程的知识,我对mql5了如指掌(当然,我仍然在学习),并且我开始为交易员群体的一些朋友开发或调整指标我参与了,直到开发了我的第一个设置和专有指标。
那时,我在MIDAS技术分析一书中了解了Richard Wyckoff的研究以及Paul Levine,Andrews Cole和David Hawkins的研究,然后我开始研究更多有关价格和数量的知识,这使我意识到了数量在阅读中的重要性价格变动。 - 版本: 1.0
- 激活: 5
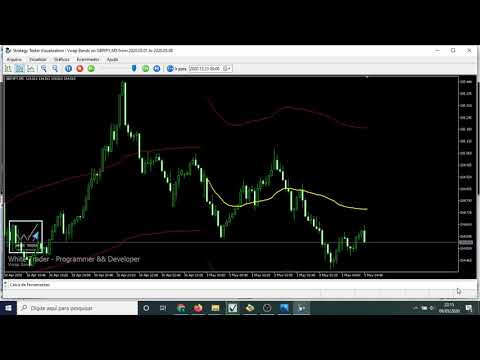
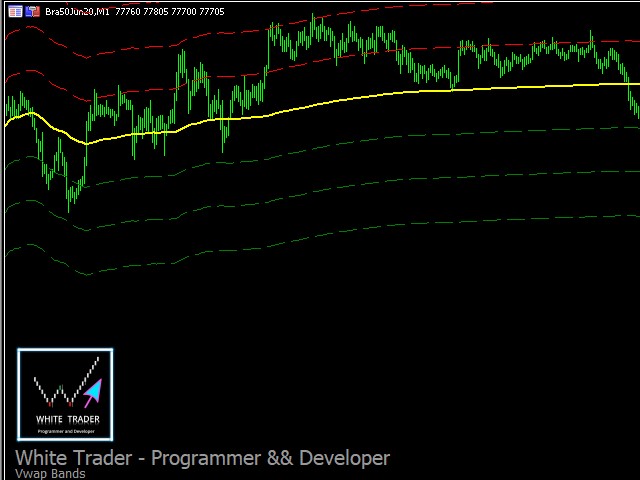
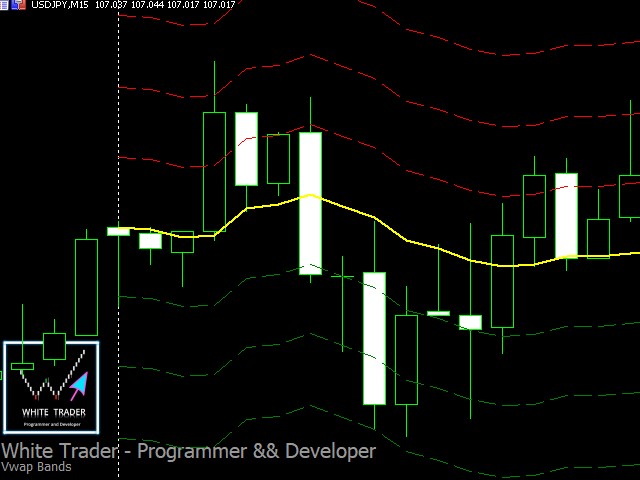
The WT Vwap Bands indicator is an indicator that
combines price and volume, helping to show whether the price is within the "fair price", overbought or oversold.
The indicator code was designed for performance and has already been tested in a real trading account.
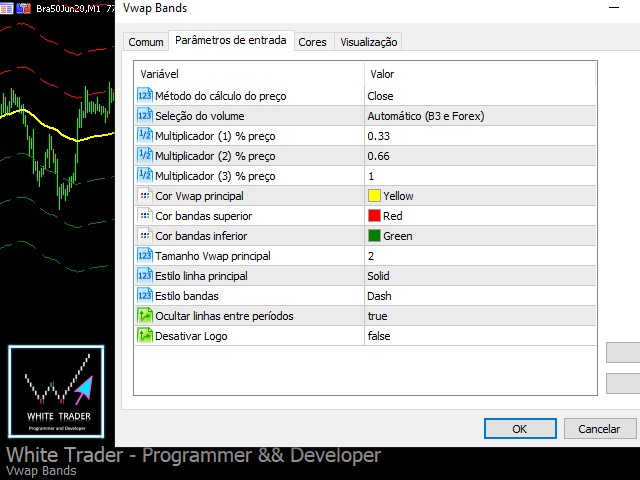
In addition to the visual inputs (color, thickness and line style), the user can define a% value that depends on the price.
The default values work with the most distant band at 1% of the price and then dividing this distance in 3, that is, 0.33% and 0.66% of the price.
These values may need to be changed depending on the asset or pair you are going to trade.
This indicator can be used in the strategy tester (works in demo) and can also be used in an Expert Advisor (robot) to give input and output signals.
It is!
Success and good trades!
The indicator code was designed for performance and has already been tested in a real trading account.
In addition to the visual inputs (color, thickness and line style), the user can define a% value that depends on the price.
The default values work with the most distant band at 1% of the price and then dividing this distance in 3, that is, 0.33% and 0.66% of the price.
These values may need to be changed depending on the asset or pair you are going to trade.
This indicator can be used in the strategy tester (works in demo) and can also be used in an Expert Advisor (robot) to give input and output signals.
It is!
Success and good trades!