Heatmap 105
- 指标
- 版本: 1.21
- 更新: 22 十一月 2021
- 激活: 5

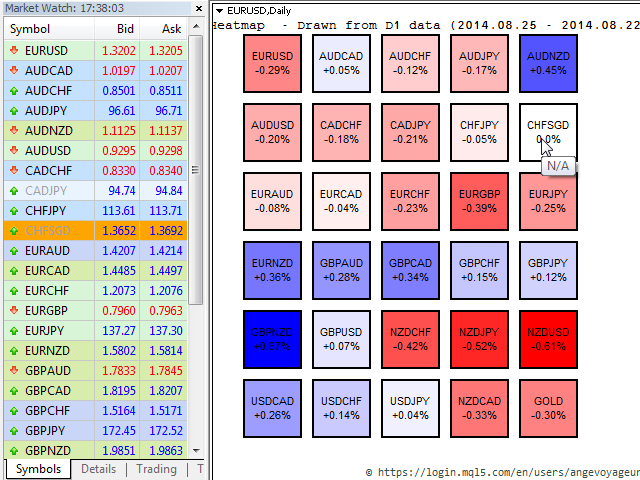
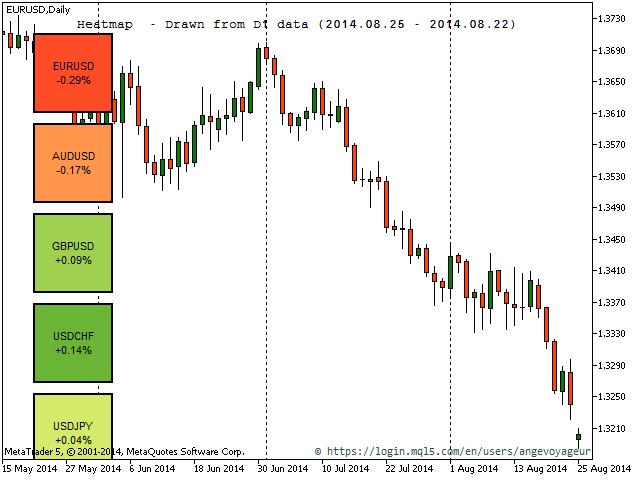
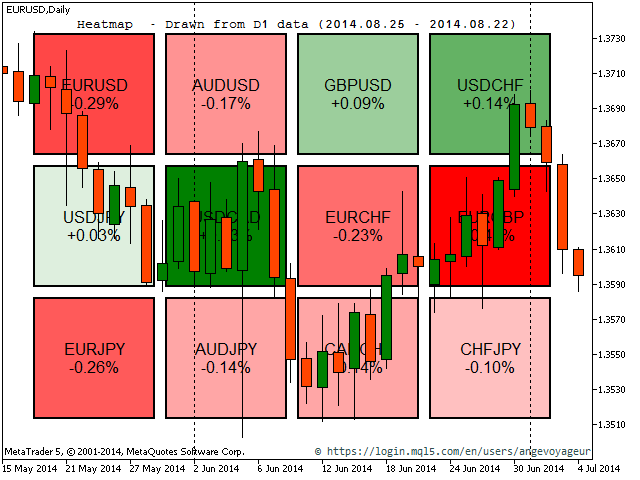
热图指示器
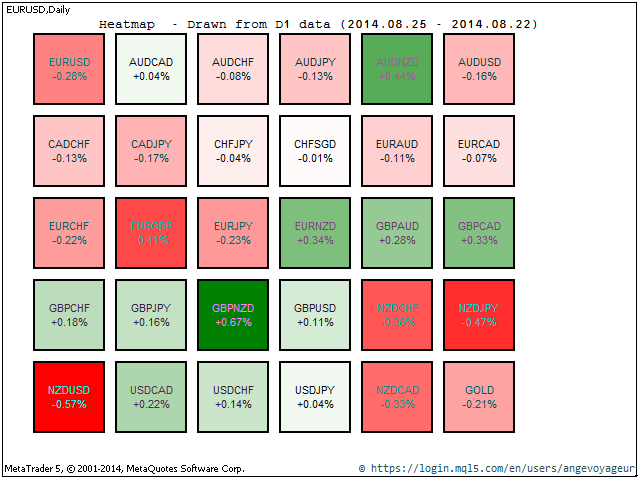
此热图指标允许您显示在市场报价中选择的所有代码的“热图”。在此版本中,它显示了相对于上次每日收盘价的价格变化百分比,可以快速了解市场概况。
这是一种工具,可帮助交易者确定一种货币相对于所有其他货币对的强度。这是一个可视化工具,不能在“EA 交易”中使用。从这个意义上说,它更像是一种自由交易者的工具,而不是自动交易者。因此,对于那些有兴趣使用此工具进行自动交易的人来说,很遗憾这是不可能的。
它对股票或期货市场特别有用,例如巴西交易所 Bovespa。
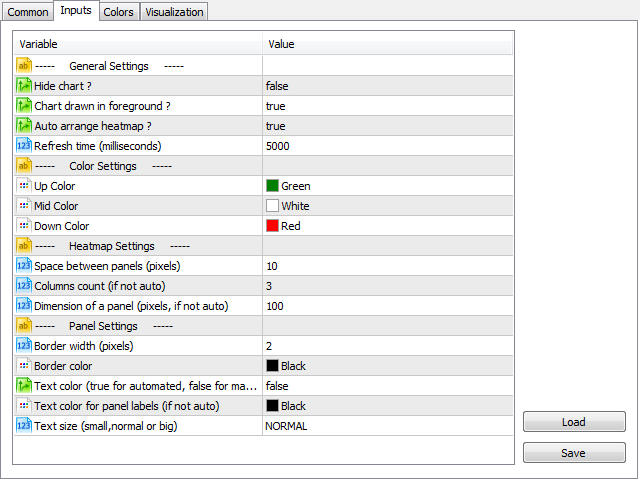
设置
热图指示器中有几个设置需要自定义:
<头>| 设置 | 可能的值 | 描述 |
|---|---|---|
| 隐藏图表? | 真/假 | 您可以完全隐藏图表或保持原样。当指标从图表中移除时,图表将恢复。 |
| 在前景中绘制的图表? | 真/假 | 如果之前的设置为 True,您可以选择在前景 (true) 或背景 (false) 中显示图表。 |
| 自动排列热图? | 真/假 | 如果为 true,所有尺寸和排列都会自动完成。否则必须选择进一步的设置。 |
| 刷新时间(毫秒) | >=1000 | 数据默认每 5 秒刷新一次。最小值为 1,000(1 秒)。 |
| 上色 | 任何颜色 | 默认为蓝色。此颜色用于指示具有正百分比变化的符号。 |
| 中色 | 任何颜色 | 默认为白色。这是中性色,用于没有增加或减少 (0%) 的符号。 |
| 羽绒服 | 任何颜色 | 默认为红色。颜色用于表示价格的负百分比变化。 |
| 面板之间的空间(像素) | >=0 | 热图的 2 个面板(符号)之间的空间。 |
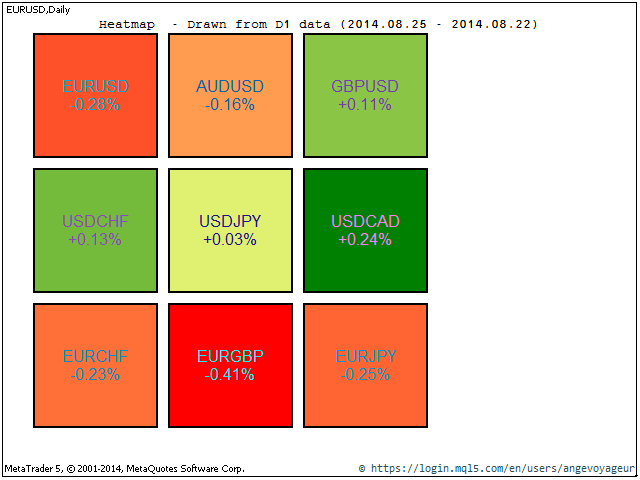
| 列数(如果不是自动) | >=1 | 仅在“自动排列热图?”时使用是假的。表示用于显示热图的列数。 |
| 面板的尺寸(像素,如果不是自动) | >=50 | 仅在“自动排列热图?”时使用是假的。指示热图上符号面板的大小。 |
| 边框宽度(像素) | >=0 | 符号面板的边框大小。 |
| 边框颜色 | 任何颜色 | 符号面板的边框颜色。 |
| 文本颜色(自动为真,手动为假) | 真/假 | 用于文本标签的颜色(符号名称和百分比)。 True=自动化,false=手动(参见下一个参数)。 |
| 面板标签的文本颜色(如果不是自动) | 任何颜色 | 如果之前的设置为 false,则此颜色将用于面板的文本标签。 |
| 文字大小(小、普通或大) | 枚举 | 面板标签的大小(名称和百分比)。 |
允许的最大交易品种为 200。如果市场报价包含超过 200 个,则只会显示前 200 个。请注意,如果您想同时显示大量符号,您的计算机需要足够的资源(CPU、内存)。
如果您有任何问题、意见或建议,请与我联系。良好的交易。


Very nice! I would pay some extra bucks for a variable to add specific symbols (not all marketwatch) and the ability to put the symbols in an order.