The trend filter

Trend Filter By HYPOLITE MAKER (v3.00)

Trend Filter is a visual indicator for MetaTrader 5 designed to clean up your charts and display the market's true trend. It eliminates market noise and visual traps to help you stay on the right side of the market, with significantly less lag than standard moving averages.

Visuals & Key Features

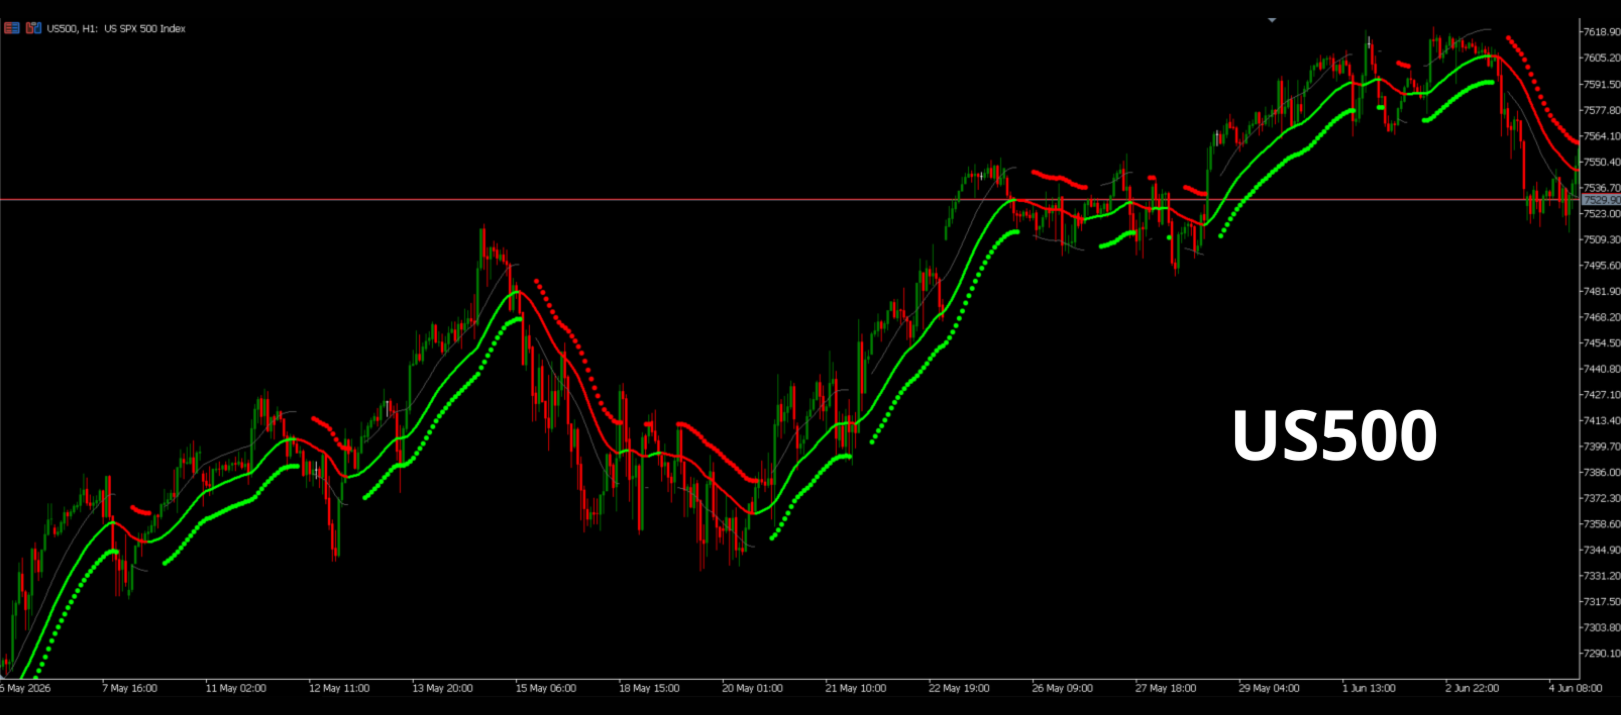
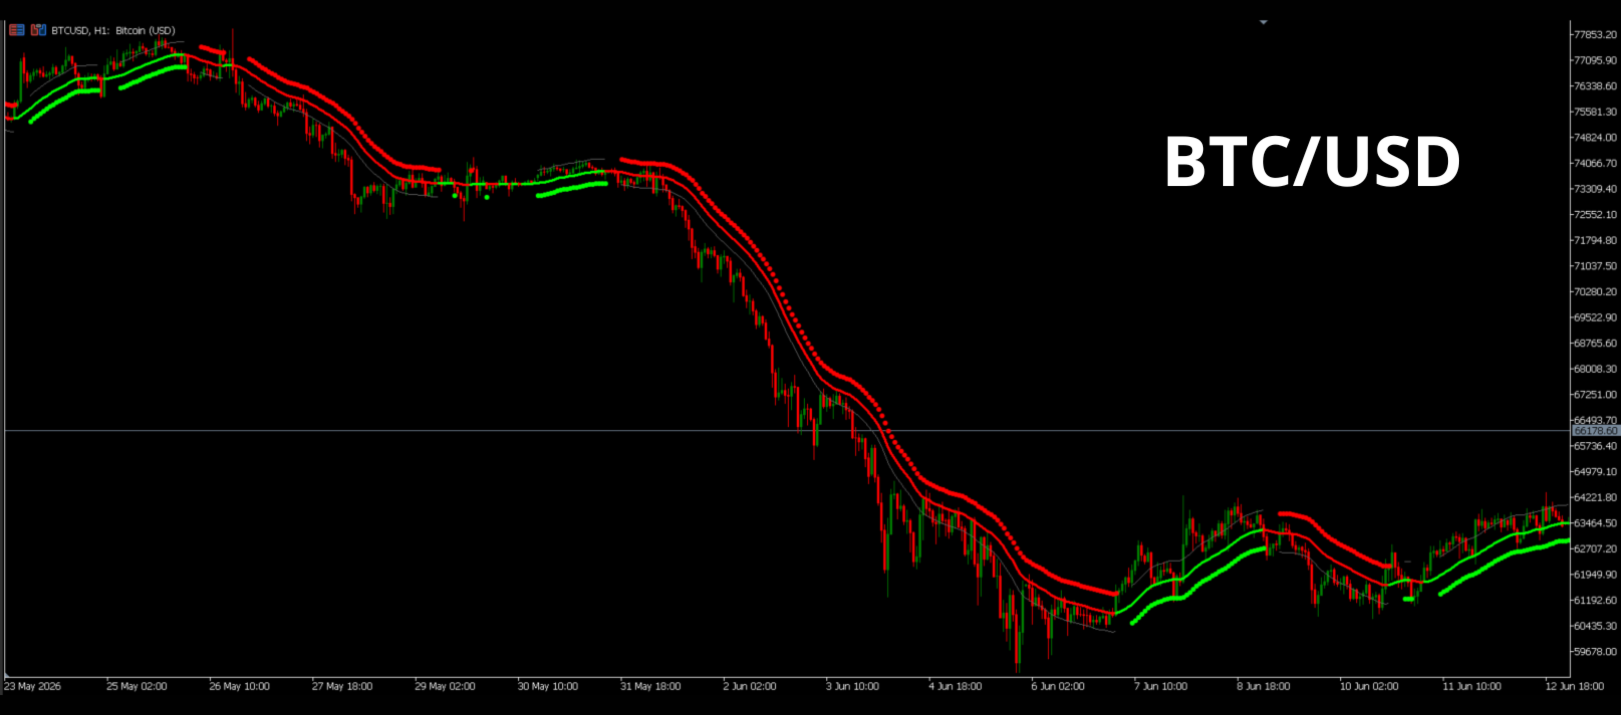
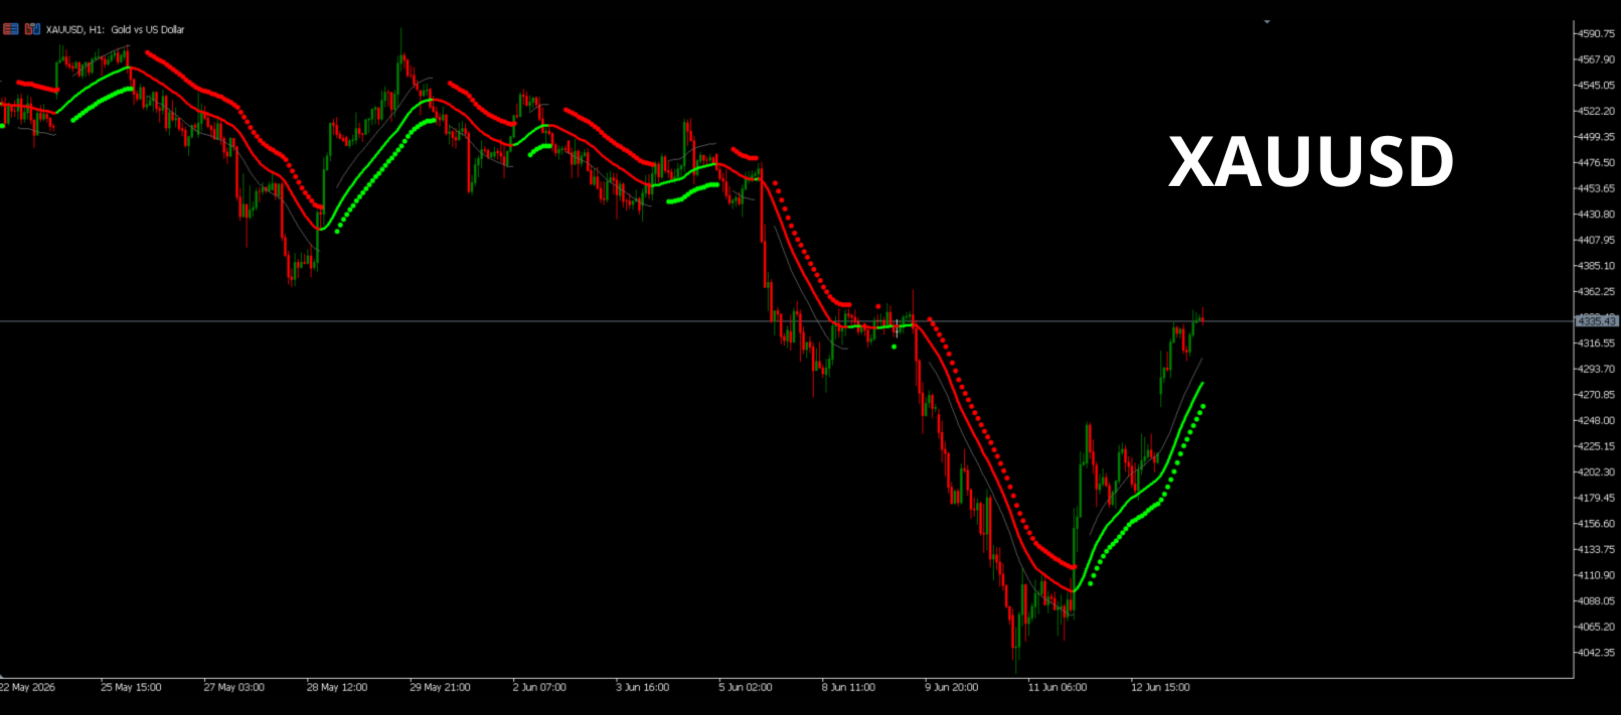
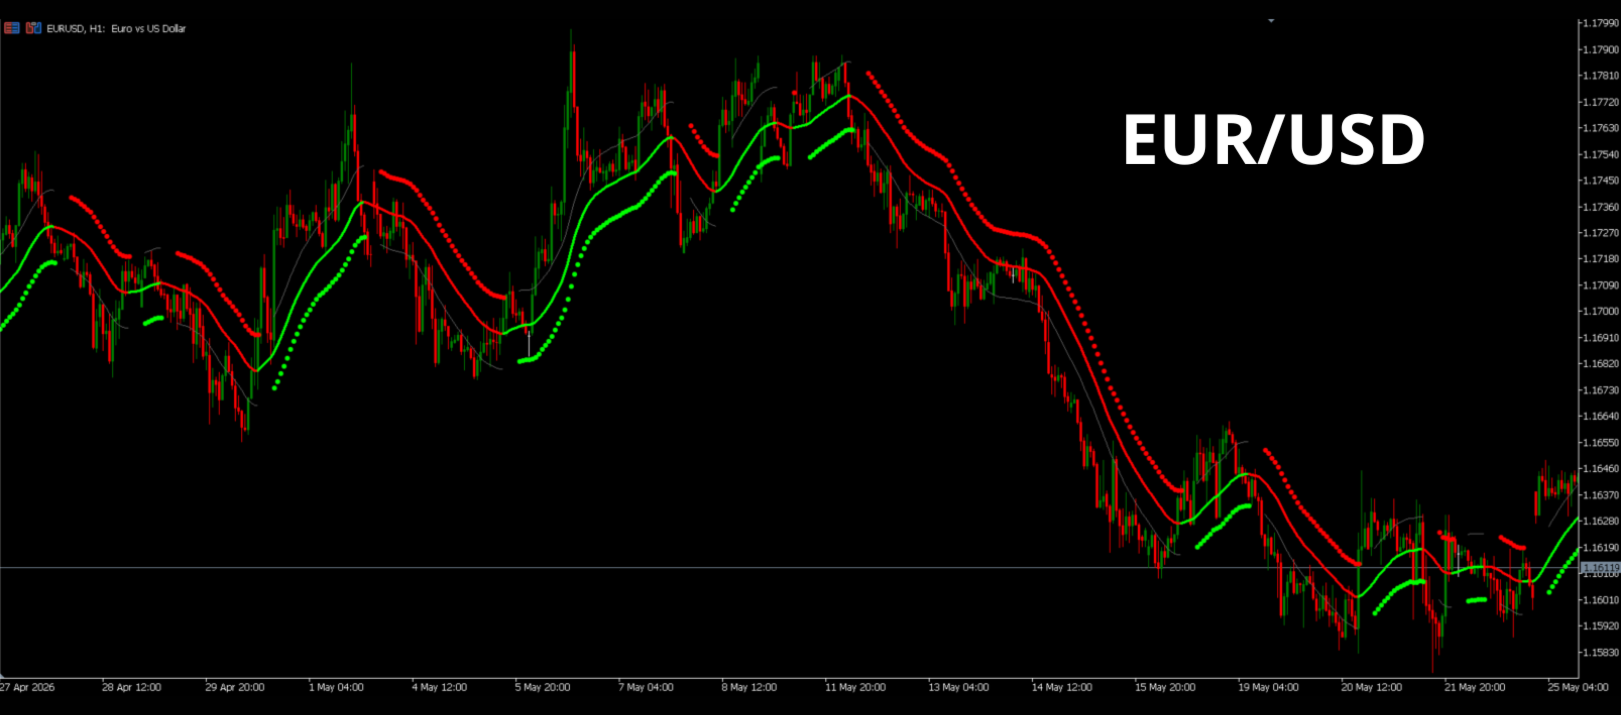
  • The Central Line: It changes color to give you the market direction at a glance. Green for an uptrend, Red for a downtrend, and Yellow when the market is hesitating or changing direction.

  • Confirmation Dots: The indicator does not jump on every minor price movement. It waits for the trend to establish strength before displaying confirmation dots (Green below the price for buys, Red above the price for sells).

  • Market Adaptation: The distance of the dots automatically adapts to market conditions: it widens during volatile periods and tightens when the market goes quiet.

  • Automatic Alerts: You receive a notification directly on your platform as soon as a trend (bullish or bearish) is officially confirmed.

How to Use It Daily?

⚠️ Essential Reminder: This tool is designed for trending markets. Like all indicators of this type, it will be less effective and may generate false signals when the market is moving sideways (ranging).

  1. The Filter: Check the color of the line. Only look for buy setups if it is green, and only look for sell setups if it is red.

  2. The Signal: Wait for the green or red dots to appear to confirm that the movement has momentum before entering a trade.

  3. Protection: You can use the level of the dots or the gray line to place your safety level (Stop Loss).

Simple Settings (Inputs)

You can easily adjust the parameters to fit your trading style (Scalping, Day Trading, or Swing Trading):

  • Length / Damping: To make the indicator faster (more reactive) or slower (more stable).

  • Rising / Falling threshold: The number of confirmation candles required before the signal dots appear.

  • Alerts: A simple True/False switch to turn notifications on or off.

In Summary

  • Platform: MetaTrader 5 (MT5)

  • Style: Trend following and decision-making aid.

  • Learning Curve: Immediate, thanks to the simple color-coded system.

推荐产品
NQX Retracement Entry Burst
Marcel De Oliveira Farias
NQX Retracement Entry Burst 是一款适用于 MetaTrader 5 的信号指标:回撤入场信号(仅在波动率扩张至近期平均水平之上时发出信号)。 NQX 专有逻辑:检测回撤至关键回撤区域并获得支撑的走势。仅在波动率扩张至近期平均水平之上时发出信号。它会绘制建议入场位、较短的止损和较远的目标(3:1、5:1、10:1,波段最高可达 20:1);由您决定。 图表上显示的内容 - 在已收盘的信号K线上显示箭头(已收盘的信号绝不重绘)。 - 建议入场位、较短的止损和较远的建议目标(默认为风险的 6 倍),以及 3 x 1、5 x 1 和 10 x 1 参考线。 - 价格触及某一水平时,图表上会显示标签(目标或止损)。 - 显示最近一次信号以及可见历史中出现的信号数量的面板。 - 新信号的弹窗提醒和推送通知(可选)。 NQX 独家逻辑:没有其他任何 NQX 指标使用相同的入场信号与市场过滤器组合,因此其信号为本指标所独有。 设置 - 主要建议目标(风险倍数)及额外目标线(默认为 3 x 1、5 x 1 和 10 x 1)。 - 最小和最大止损距离(ATR 倍数),以及信号
is a versatile analytical tool designed for both advanced traders and beginners. It combines classic trend line analysis with automatic Fibonacci level plotting to deliver precise market entries and structural clarity. Built as an intuitive and clean on-screen dashboard, this indicator simplifies multi-timeframe analysis without cluttering your main workspace. Technical Analysis and Entry Points The indicator automates the most critical aspects of price action and structural trading: Trend L
Market Scoring System
Vincent Jose Proenca
市场评分系统 —— 高级多周期交易指标 专业级市场分析系统,结合技术指标、机器学习模式识别及多周期共振确认,为您提供精准的交易信号。 核心功能: 多周期分析: 在不同周期(M5、H1)之间确认信号,提高交易成功率 智能评分引擎: 基于最近 25 根K线进行加权分析,计算趋势、区间和不确定性评分 市场意图识别: 基于最近 6 根K线及成交量权重,实时判断买盘/卖盘压力 全球评分(0–100): 综合信号强度指标,配备可视化进度条 ATR 风险管理: 动态计算止损、止盈和移动止损 ADX 趋势强度过滤: 基于 DI+/DI- 判断强趋势或震荡行情 成交量环境分析: 区分爆发性波动与低波动蓄势阶段 机器学习系统: 模式识别与结果跟踪,实现自适应信号 严格模式: 基于 ADX、不确定性阈值及趋势强度过滤信号 可自定义仪表盘: 全模式或紧凑模式,可调位置与缩放 信号类型: BUY/SELL: 多指标确认的强趋势信号 RANGE BUY/SELL: 震荡区间内的逆势机会 NEUTRAL: 无明确方向,建议等待更佳入场点 仪表盘结构: 周期:高周期确认与方向分析 评分:趋势、区间、不确定性与相关性指
# SSL ST Strategy MT5 Indicator - Chinese (Simplified) Version SSL ST Strategy MT5指标是一个技术分析工具,旨在帮助交易者在交易图表上清晰地识别买卖信号。它提供视觉指标(如线条和箭头),以及声音、弹出和推送通知,在出现交易机会时及时提醒交易者。 ## 主要优势 - 在图表上直接提供清晰的视觉信号,使用彩色线条(SSL1和基线)和箭头表示买入(绿色三角形)和卖出(红色三角形)信号。 - 支持声音警报、弹出警报和移动推送通知,确保交易者即使不在屏幕前也不会错过重要信号。 - 允许反转信号逻辑,使其适应不同的交易策略或市场条件。 - 使用基于高点、低点和收盘价的指数移动平均线(EMA)以获得更响应和平滑的信号生成。 - 内置过滤功能可防止同一信号柱的重复警报,减少噪音和警报疲劳。 ## 输入参数 - **len**: 设置SSL1和基线EMA计算的周期长度(默认60)。 - **show_Baseline**: 选择在图表上显示或隐藏基线EMA线。 - **show_SSL1**: 选择在图表上显示或
FREE
Equivalent MA
Yuya Kogoshi
THE NUMBER CHANGES. THE MEANING DOESN’T. Change timeframes. Keep your reference. SAME PERIOD. DIFFERENT MEANING. Change the timeframe, and the MA you trusted is no longer measuring the same market horizon. The problem The same MA period measures a different amount of market time when the chart timeframe changes. The solution Equivalent MA changes the number — so your reference keeps the same meaning. H4 EMA 50 = H1 EMA 200 = M15 EMA 800 USER MANUAL Complete setup instructions, feature details,
High And Low MT5
Dmitriy Parfenovich
On the current chart, this indicator displays candlestick highs and lows of another time frame. Input Parameters: TimeFrame - chart time frame whose data will be displayed on the current price chart (by default, H12). Time Zone - shift of the indicator by time zone relative to the broker's time (by default, Broker-1). If the broker's time zone is UTC+1 and the Time Zone parameter is set to Broker-1, the bends of the indicator will be plotted in multiples of Greenwich Time. Indicator buffer value
All in One Multi Indicator
Teerathad Booranawisedkul
Overview Comprehensive technical analysis indicator combining 20+ essential trading tools in a single chart display. Moving Averages EMA (Exponential Moving Average): 9, 21, 50, 200 periods SMA (Simple Moving Average): configurable period Customizable colors and line widths Price position indicators (above/below) Oscillators & Momentum RSI (Relative Strength Index): adjustable overbought/oversold levels MACD (Moving Average Convergence Divergence): customizable fast/slow/signal periods Stochasti
Bid Price Timer Indicator — 精准计时,智能价格追踪! 使用 Bid Price Timer Indicator ,让您的交易更具 时间感与精准度 !这是专为重视 时机、精确与清晰度 的交易者打造的强大工具。 主要功能: 固定计时器显示 —— 始终显示在图表 右侧 (可自定义 X_Offset)。 动态价格追踪 —— 计时器会随 买价 (Bid) 实时 上下移动 。 自动重新定位 —— 当市场价格变化时,计时器会 自动跟随 新的价格水平。 可选水平线 —— 可添加一条 水平线 ,清晰显示 当前买价位置 。 ️ 实时倒计时 —— 每秒自动更新,显示 距离下一根K线的倒计时 ,让您不错过任何交易时机! 交易者喜爱的理由: 帮助您以 毫秒级精度 掌握K线收盘时间 让图表更 简洁、美观、信息丰富 非常适合 剥头皮、日内交易与技术分析 简洁、高效、现代化的设计,让 Bid Price Timer Indicator 成为您市场中精准控制时间的最佳助手!
Vwap RSJ
JETINVEST
4.82 (11)
VWAP RSJ 在同一图表上绘制小时、日、周和月 VWAP 线。 大型机构买家和基金使用 VWAP 建仓和平仓,以尽量减小对市场的影响。他们通常尝试在 VWAP 下方买入、在其上方卖出,这往往会将价格拉回均值附近。 本指标将四个 VWAP 周期结合在一起,方便您查看价格相对于每一条 VWAP 的位置。 如何解读 每条 VWAP 线都会在其周期开始时重新计算:小时 VWAP 每小时重新开始,日 VWAP 每天重新开始,周 VWAP 每周重新开始,月 VWAP 每月重新开始。 当价格位于某条 VWAP 上方时,说明买方支付的价格高于该周期的平均价格;当价格位于其下方时,说明该周期由卖方掌控。 两条或更多 VWAP 线彼此靠近的区域常常充当支撑或阻力,因为不同周期的交易者都在关注同一价格。 适用于任何提供 tick 成交量或真实成交量的交易品种。 如果您觉得这个指标有用,请留下评价。这能帮助其他交易者找到它。
FREE
ICT Institutional Zones Pro
Celestine Anyango Wabomba
ICT Institutional Zones Pro — Trade with Institutional Precision Stop wasting time manually drawing key ICT levels every day. ICT Institutional Zones Pro is a professional-grade MT5 indicator built for traders who use ICT (Inner Circle Trader) and Smart Money Concepts (SMC) to read market structure with precision. This indicator automatically maps the most important institutional levels directly on your chart, helping you instantly identify where smart money is likely accumulating, distributing
Brilliant Reversals MultiCurrency Scanner MT5 是一款先进的交易指标,旨在帮助交易者识别多个货币对的潜在反转点。通过利用先进的算法,这个工具提供即时洞察,使其对希望优化交易策略的新手和经验丰富的交易者都极为重要。 该指标通过根据市场条件提供实时买入和卖出信号,增强了交易者的决策能力并改善了交易表现。凭借其全面的仪表板和警报功能,您可以轻松监控关键货币对,并迅速抓住市场机会。 MQL产品安装指南 | 在 MT4/MT5 上更新已购买的MQL产品 | 常见故障排除指南 | 指标设置 / 指南 主要特点 缓冲区集成:将指标值暴露为可访问的缓冲区,使 Expert Advisor 能够有效利用基于信号的交易。 可视化箭头信号:在您的图表上清晰地显示 BUY/SELL 箭头,方便您发现交易机会。 快速且可回测:基于 MetaTrader 的本地 OnCalculate() 引擎构建,确保快速计算并与策略测试器完全兼容。 弹出警报:在信号事件时触发警报弹窗,确保您不会错过潜在的交易设置。 推送通知:实时向您的 MetaTrader 移动应用发送推送通知,
Xausd pro EA
Sushil Kushawaha
Use only RAW Spread AC use SL 270 & TP 2700 1:30 risk Reward EA Key Advantages Automated, hands-free trading — no manual monitoring required once attached to the chart. Multi-layer signal confirmation — combines an RSI oscillator, Ichimoku Kinko Hyo, and a time filter before entering a trade, reducing false signals. Step trailing stop protection — profits are locked in gradually as price moves in your favor, rather than using a single static trailing distance. Built-in risk controls — fixed Stop
Professional VWAP Trading System with Advanced Signal Detection Transform your trading with the most comprehensive VWAP indicator available for MetaTrader 5. Magic VWAP Key Levels Pro combines multiple timeframe analysis, intelligent signal detection, and professional-grade visualization to give you the edge in modern markets. CORE FEATURES: Multi-Timeframe VWAP Analysis Session, Weekly, and Monthly VWAP calculations Previous 10-day VWAP support/resistance Dynamic anchor periods (Session/Week/Mo
Fractals MTF
Kong Yew Chan
Multi-Timeframe Fractal Indicator Description for MQL5 Introducing the Multi-Timeframe Fractal Indicator! Key Features: Multi-Timeframe Analysis: Analyze Fractals on a timeframe independent of your chart's current timeframe. Gain insights from higher timeframes for informed trading decisions. Customizable Parameters: Timeframe: Choose the timeframe on which Fractals will be calculated (e.g., Daily, H4, etc.). Number of Bars: Specify the number of bars considered around a potential Fractal for c
Elliott Wave Engine
Enrique Gauto Sand
Elliott Wave Engine The Auto Elliott Engine is a tool designed for MetaTrader 5 that automates the identification, decomposition, and projection of price structures based on the Elliott Wave Theory. Powered by a pattern-recognition engine, this indicator processes price action to identify market configurations, translating data into structured scenarios. Key Features Multi-Degree Recognition: Analyzes price action across multiple fractal levels. From higher degrees, such as Supercycle or Cycle,
HTF Open Markers + ICT Silver Bullet Zones — Usage & Strategy Guide What it draws Session 1 / Session 2 lines : vertical lines at the open of every bar on two independently configurable higher timeframes (defaults: H4 and D1), including a projected line for the rest of today's not-yet-opened bars on sub-daily timeframes, so you can see where the next candle will open before it happens. ICT Silver Bullet zones : shaded rectangles over the three classic ICT kill-zone windows, converted from New Yo
FREE
Trend integrity filter
David Chokumanyara
TIF – Trend Integrity Filter Trade With the Trend. Filter the Noise. TIF (Trend Integrity Filter) is a professional trend-analysis indicator designed to help traders identify the dominant market direction and filter out lower-quality trades that go against the prevailing trend. TIF can be used as a standalone trend filter or combined with your existing trading strategy, entry indicator, price action system or Expert Advisor. KEY FEATURES Trend Integrity Analysis Helps identify the cur
Trade Area
Jinsong Zhang
Most time the market is in a small oscillation amplitude. The Trade Area indicator helps users to recognize that time. There are 5 lines in this indicator: Area_high, Area_middle, Area_Low, SL_high and SL_low. Recommendations: When price is between Area_high and Area_Low, it's time to trade. Buy at Area_Low level and sell at Area_high level. The SL_high and SL_low lines are the levels for Stop Loss. Change the Deviations parameter to adjust SL_high and SL_low.
Candle Timer Zakirulbd
Mohammad Zakirul Haque
Zakirulbd Candle Timer V7   Professional trader utilities. Minimal design. Maximum clarity. Zakirulbd Candle Timer V7 is a professional MT5 indicator designed to display the remaining time of the current candle directly on your chart in a clean, distraction-free format. One of the most common frustrations among traders is not knowing exactly how much time remains before a candle closes. Many traders moving from other platforms actively look for a reliable candle countdown timer before fully ado
FREE
Institutional Intelligence
Johan Adrian Nieto Resendiz
Institutional Intelligence Institutional Intelligence is a modular market analysis indicator for MetaTrader 5. It combines structure, liquidity, institutional reference levels, price zones and two selectable signal strategies in one workspace. It is designed to organize market context, not replace execution or risk management. Every visual module can be enabled independently for a clean chart or a complete analytical view. Full Intelligence Panel The expandable Full panel provides a structured m
UTS Trading Stat
Dawid Aaron Zinserling
The UTS Trading Stat indicator, developed by Ultron Trading Solutions, is a customizable tool designed to track and display trading statistics for the current chart's symbol. It presents a visual dashboard on the chart, offering real-time insights into trading performance with a toggleable panel (STAT SHOW/STAT HIDE) for user convenience. Below is a detailed description of its features and functionality: Trading Statistics Displayed : Current Positions : Number of open profit/loss trades and tot
ApexForge MA Trend Strength Professional 是 ApexForge 系列中功能最完整、最強大的旗艦版本,專為追求專業分析與高效率交易的使用者打造。除了完整的 MA 趨勢強度分析外,Professional 版本提供更多進階功能、更多自訂選項,以及更高的分析自由度,滿足從剝頭皮、日內交易到波段交易等不同操作需求。 指標可自動分析圖表中的移動平均線斜率,並以 Strong Down、Down、Flat、Up、Strong Up 五段式趨勢強度清楚呈現市場狀態,協助交易者快速判斷趨勢是否正在增強、減弱或進入盤整。透過直覺化的介面設計,即使同時監控多個商品與多個時間週期,也能迅速掌握整體市場方向。 Professional 版本支援完整的介面客製化,包括更新頻率、面板位置、顏色配置、文字大小及更多專業設定,並採用極致輕量化架構,不依賴 Tick 更新、不重繪歷史資訊,長時間運行依然保持流暢,適合需要同時開啟多張圖表的專業交易環境。 本指標並非提供買賣訊號,而是提供客觀且一致的趨勢評估,協助交易者建立更有紀律的交易流程。無論搭配價格行為、均線策略、支撐壓力或
Anubi Terminal MT5
Marco Maria Savella
Anubi Terminal is a professional trade management assistant designed for manual traders who demand precision, speed, and strict risk control. Unlike automated bots, Anubi puts the trader in control, providing a sophisticated interface to execute and manage trades according to institutional-grade risk management rules. Why Anubi Terminal? Manual trading often fails due to calculation errors and emotional exits. Anubi eliminates these risks by automating position sizing and trade management based
Fabulous Four FAB4 Indicator
Daniel Raimundo De Oliveira
The Exclusivissimo FAB4 (Fabulous Four) Indicator is an institutional-grade chart analysis tool designed for MetaTrader 5. Built for professional traders who demand precision, this indicator automatically maps the most critical liquidity zones and momentum shifts in the market, keeping your chart clean and your entries surgical. Whether you are trading Forex, Indices, or Stocks, the FAB4 Indicator provides a complete institutional roadmap right on your screen, highlighting true market intent wit
WZY 鲸落结构线(MetaTrader 5) 让主图更清楚,让结构更有价值。 WZY 鲸落结构线是一款为主图看盘设计的视觉化结构工具。它把重要的支撑与阻力背景整理到价格图表上,减少手动画线和反复清理标记,让你在行情快速变化时依然保持清晰视野。 当市场节奏加快,注意力就变得更加宝贵。WZY 会把当前值得关注的结构保留在视线里:较新的区域使用更醒目的渐变色,已经形成的区域保留为历史背景,整张图仍然保持干净、有层次、容易阅读。 你会获得 - 更清晰的主图工作区:价格、K 线和结构保持在同一张图里。 - 更快的行情背景:不用在拥挤的图表中反复寻找市场曾经反应过的位置。 - 清楚的优先级:较新的有效区域更醒目,较早的区域作为背景参考。 - 适合个人习惯的视觉呈现:可以使用内置配色,也可以调整成自己的看盘风格。 - 能融入多种分析流程:适合配合价格行为、波段分析、突破规划、趋势观察和多周期研究。 - 更少的手工维护:把时间留给行情判断,减少反复画线和整理标记。 适合这样的交易者 - 喜欢用主图观察结构,不想依赖堆满窗口的信号面板; - 希望在活跃交易时段持续保留支撑和阻力背景;
Fusion Harmonic Intelligence
Juan Antonio Alvarenga Galindo
Fusion Harmonic Intelligence ,专为在 MetaTrader 5 平台上运行而设计。该工具结合了谐波形态分析与传统技术指标(如 RSI 和移动平均线),以识别市场中的精确进场点。该软件因其强大的风险管理而脱颖而出,包括针对重大损失的应急计划、集成的新闻过滤器以及用于保护资本的积极对冲系统。此外,它还通过动态追踪止损引擎和激活智能网格(Smart Grid)策略的可能性提供了操作灵活性。该程序的主要目标是在严格的安全参数下保持回撤(Drawdown)受控,同时实现利润最大化。 交易中的谐波形态检测系统 系统编程用于检测三种特定类型的谐波形态: 1. Gartley 形态:通过评估 XABCD 结构进行检测。系统验证 B 点相对于 XA 有约 0.618 的回调,且 D 点的回调接近 0.786。 2. Butterfly(蝴蝶)形态:同样使用 XABCD 结构,验证 B 点在 XA 的 0.786 左右回调,且 D 点是扩展位(1.27 或 1.618)。 3. ABCD 形态:通过检查 AB 段的距离是否等于 CD 段的距离来识别,其中 C 点的回调落在
Momentum waves oscillator
Vincent Albert Feugier
The Momentum Waves Oscillator is an indicator designed for traders who want to declutter their charts. It does not generate "magic" signals; instead, it structures market data to provide an immediate, noise-free reading of momentum and volatility. This tool transforms price action into an organized visual grid, facilitating rapid and confident decision-making. Key Features: "Snap-to-Grid" Points: Prices are normalized on a scale of -100 to +100 with a step of 5. This eliminates chart "jitter" an
Dynamic Trend Moving Average for MT5 Dynamic Trend Moving Average is an intelligent moving average indicator designed to help traders instantly identify the current market trend through a simple and intuitive color-coding system. Unlike traditional moving averages, this indicator automatically changes color according to market conditions: Green – Bullish trend detected Red – Bearish trend detected Yellow – Neutral market or transition phase This visual approach allows traders to quickly
Quantum Trend Scanner
Niccyril Chirindo
5 (1)
QUANTUM TREND SCANNER Professional Multi-Timeframe Trend Analysis Dashboard Quantum Trend Scanner is an advanced technical indicator designed to analyze market trends across multiple timeframes and currency pairs simultaneously. The indicator provides traders with comprehensive market insights through three integrated analytical panels. Quantum Trend Scanner Guide is Here  What It Does The indicator monitors 30 currency pairs across 9 timeframes (M1, M5, M15, M30, H1, H4, D1, W1, MN1) and pre
该产品的买家也购买
Trend Sniper X
Sarvarbek Abduvoxobov
4.86 (43)
Trend Sniper X 是一款适用于 MetaTrader 5 的多周期趋势跟踪指标,可帮助交易者清晰精准地识别趋势方向和潜在的反转点。 适用于 MT4: https://www.mql5.com/en/market/product/193245 价格信息: 当前价格为促销价,随着后续更新和新功能的推出,价格可能会有所变动。 赠品优惠: 购买后联系作者,即可免费获取该指标的 Auto-Trade Assistant EA(自动交易助手 EA)。 Code2Profit 频道 通过多时间框架分析掌控市场! 如何使用 Trend Sniper X 最大化您的胜率:核心规则与交易时段技巧 技术规格 平台 MetaTrader 5 指标类型 多时间周期趋势指标 运行时间周期 任何图表时间周期,可独立选择更高的时间周期 (M1–MN1) 主要交易品种 外汇、黄金 (XAUUSD) 及其他差价合约 (CFD) 推荐账户 任何账户类型 可视化 彩色趋势蜡烛 (买入/卖出/微弱/变化) + 买入/卖出箭头 附加模块 交易时段方框 (悉尼、东京、伦敦、纽约) 主要功能 多时间周期趋势分析: 直接在
全新王者降临 - 指标 + 订单管理提示(TP1 + TP2 + TP3)+ 可选 Telegram 信号发送器 INCLUDED(免费) (完整交易与信号系统) 我们最强的黄金 EA: Gold Slayer 该指标包含先进的交易策略、可自定义订单管理系统,以及结合 Envelope 扩展的均值回归系统,并通过 RSI 等多重智能确认过滤器进行验证,以捕捉高概率反转入场机会,提供 BUY 与 SELL 信号。 你不仅能够学习如何交易,还能学会如何高效管理多个仓位,并利用之前盈利的持仓来覆盖亏损交易。 专为 M5 周期打造并优化,在 BTCUSD 和 XAUUSD 上表现尤为出色,因为这些市场的流动性能够让信号更加干净、可靠。 该指标会自动生成清晰的多头(Long)与空头(Short)信号,同时基于 ATR 自动计算入场位、止损位和止盈位,让风险管理从一开始就融入系统之中。 多 TP 系统设有三个渐进式目标位,你可以在 TP1 锁定部分利润、在 TP2 继续持仓,并在更大的行情中将仓位持有至 TP3,而这正是平均风险回报比真正开始大放异彩的地方。 默认参数开箱即用,已经针对稳定表现进行
Smart Trend Trading System — MetaTrader 5 购买后,请在 MQL5 上给我发消息,即可免费获得 Smart Universal Expert Advisor,以及在线课程、PDF 手册和私人群组访问权限。 STTS 将趋势方向、入场和出场信号、反转区域及重要价格水平集中呈现在图表上。您可以根据系统手动交易,也可以连接单独的兼容 EA,按照您选择的设置自动执行交易。 一套系统,四种交易思路 STTS 将交易方法分为四大类: • 剥头皮交易 — 跟踪短期信号和市场波动。 • 趋势交易 — 评估方向,寻找趋势中的交易机会。 • 反转交易 — 识别潜在的转折区域和方向变化。 • 成交量交易 — 利用成交量相关信息评估市场活跃程度。 入场和出场箭头、趋势信息、支撑与阻力位及反转区域,帮助您直接在图表上分析交易形态。 先从一种方法开始。了解其信号和设置后,再探索其他方法。 从信号到自动化 Smart Universal Expert Advisor 可连接 STTS,让您自动执行受支持的交易信号。 启用自动交易前,请配置指标连接、仓位大小和交易管理设置
Zoryk Gold
Reda El Koutbane
4.78 (18)
折扣将在 24 小时后结束——下一价格为 69 美元 ZORYK — MetaTrader 5 专用高级 XAUUSD 黄金信号系统 你一定熟悉这种感觉。 你花了很多时间分析黄金,等待合适的入场机会。终于开仓后,价格却立刻朝相反方向移动。你过早平仓、移动止损,或者只犹豫了几秒钟。随后,市场却在没有你的情况下到达了你原本预期的目标。 问题并不总是方向判断错误。 真正的问题是缺乏确定性。 你不知道准确的入场位置在哪里。 你不知道什么时候交易逻辑已经失效。 你不知道应该先锁定较近的利润,还是继续等待更大的行情。 你也不知道当前信号是否足够强,还是自己只是在强行寻找交易机会。 黄金市场变化非常快。一个没有明确计划的好想法,可能在几秒钟内变成错误的交易决定。 ZORYK 正是为了解决这个问题而开发。 什么是 ZORYK ZORYK 是一套完整的 XAUUSD 黄金信号与交易计划系统,专门为 MetaTrader 5  和 M5 时间周期 开发。 它不是一个只显示 BUY 或 SELL 箭头,然后让你独自决定其余所有内容的简单指标。 每个确认后的信号都可以在图表上显示完整的可视化交易计划,包
M5 Sniper
MeanFX
5 (4)
让您的交易优势尽在视野之中! M5 Sniper 是 MeanFX 推出的一款全新指标。它将 精准的交易信号 与 自适应 TP/SL 水平 相结合——从而创造出最佳的统计交易机会! 每售出 5 份,价格上涨一次,下一价格为 69$ 购买后请给我发消息,以获取技巧/指南和奖励 EA 它有哪些突出优势? 经过验证的统计表现 ,适用于 Gold XAUUSD( 几乎适用于每一种资产 ,专注于掌握一个时间周期,而不是试图面面俱到却无法获得稳定的结果) 每天每个交易品种 1 至 8 笔交易 ,具有较高的胜率百分比,并让所有统计优势站在我们这一边 图表上 仅显示已确认的 BUY 和 SELL 信号 自适应 TP 和 SL 水平 ,由指标针对每笔交易生成 平均胜率 75%+ 平均 Signal Ratio 最低 1.1+ 警报 和通知也会发送至 手机 **适合 Prop Firm(资金管理公司)**的交易方式 易于理解——适合 所有经验水平 的交易者 创作者提供的个人支持 100% 不重绘、不重新绘制、不滞后 奖励自动化 Expert Advisor(EA) 背后的策略: M5 Sniper 基于
SuperScalp Pro
Van Minh Nguyen
4.54 (37)
SuperScalp Pro - Professional Multi-Layer Confluence Scalping System SuperScalp Pro 是一款先进的剥头皮交易指标,在经典 Supertrend 的基础上加入了多种智能确认过滤器。它可以帮助您识别成功概率更高的 Buy/Sell 交易机会,同时显著减少虚假信号。 清晰的 Buy 和 Sell 箭头会直接显示在图表上,并实时自动计算基于 ATR 的 Stop Loss 和 Take Profit 水平。 购买后,请通过 MQL5 给我发送消息,即可免费获取 SuperScalp Pro Auto Trader EA、用户指南以及私人群组的访问权限。 下载推荐的设置文件: [Set File] 完整文档请参阅产品博客: [User Guide] 加入官方频道,获取最新更新: [Official Channel] SuperScalp Pro 如何工作? 只有当多个确认层同时满足条件时,指标才会生成信号(趋势 + 动量 + 成交量 + 波动率 + 高时间周期趋势)。 Multi-Timeframe (MTF)
Gold Trend Coach MT5
Cristhian Alexander Gaibor Cuasquer
4.2 (10)
Gold Trend Coach 是一款用于 MetaTrader 5 的黄金(XAUUSD)趋势指标,提供在K线收盘时确认的买卖信号(不重绘)、止损和三个止盈目标,一个从入场一路指导你到 TP3 的教练,一个多周期面板,以及推送到手机和 Telegram 的提醒。专为伦敦和纽约时段的 M1、M5 剥头皮和 M15 日内交易打造。 赠品:免费 Gold Trend Coach 自动交易 EA。 购买后给我留言,我会发给你按指标信号自动交易的 EA,以及 Telegram Alert Bridge,它会把每个信号、入场、止损和触及的目标发送到你的 Telegram 聊天、群组或频道,并附带 set 文件和安装指南。 首发价 $39 仅限前 20 份,已售完。当前价格 $45,至 40 份为止,之后 $59。计划最终价格 $79。 你可能已经试过几十个黄金指标。大多数只给你一个箭头形式的买卖信号,然后把最难的部分留给你:入场之后该怎么做。Gold Trend Coach 正是为这一刻而生。这个市场上的 XAUUSD 指标都只展示盈利单,而 Gold Trend Coach 也会用红色展示亏
Entry Points Pro for MT5
Yury Orlov
4.52 (152)
Entry Points Pro 会在您下单之前,告诉您在哪里入场、止损放在哪里、用多大的手数交易。 价格 现在 149 USD,这是按此价格出售的最后一份。之后价格将涨到 199 USD,最终价格为 349 USD。 我靠交易市场赚钱,并公开展示,所以我不需要把这个指标卖给所有人。它是为独立思考的交易者准备的工具,而不是一个神奇按钮。 箭头在 K 线收盘时出现,并且不会重绘。只有两项设置:您的本金和每笔交易的风险。 付款前先验证:免费演示版可在 MT5 策略测试器中运行,只需两分钟。购买后,我会亲自帮您完成设置。 2019 年,我向全世界展示了这款指标的能力。我按它的信号手动交易,用的是真实账户,全程公开——账户在 Myfxbook 上接受监控,我还在 Facebook 上详细记录了这次实验。结果:10,000 美元在四个月内变成了 941,411 美元。风险是我有意设得极高的——回撤一度达到 54%,因为在我们这一行,利润和风险总是相伴而行。Myfxbook 的截图就是图库中的第一张图片。 看来,要恭喜您了:您的寻觅到此结束。Entry Points Pro 让您的入场不再靠
GoldenX Entry MT5
VividMind Digital Solutions
5 (17)
GoldenX Entry 是一款用于 MT5 的指标,包含自适应 Smart Entry Trend 算法、信号评分系统、市场状态识别器以及波动率过滤器。每个信号都包含计算得出的入场位、三个止盈位(TP1、TP2、TP3)以及止损位。它基于多个分析层构建,旨在适应不同市场条件,将多层分析系统与内置优化器及统计跟踪系统相结合。该指标基于风险收益比(RR)指标和历史交易行为提供量化分析。 开始使用非常简单——在所选时间周期上运行优化器,然后在图表上开始使用该指标。 核心功能 GoldenX Entry 将信号引擎与内置交易管理及历史统计跟踪整合在同一图表中: - 内置优化器: 优化器可在图表上单击运行。它通过两阶段搜索流程测试200种参数组合——先进行探索,再进行优化——并在完成后自动应用选定配置。结果会按时间周期缓存,因此当返回已优化的周期时,会立即恢复相同设置。 - 黄金品种自动周期识别: 将指标加载到任何 XAUUSD 图表(M1 到月线)。系统会自动识别当前周期并加载对应预设。共包含9个时间周期配置文件,专为黄金在标准周期上优化设计。切换周期时,参数会自动调整。 - 资金参考面
SMC Intraday Formula
VividMind Digital Solutions
5 (26)
让我们先坦诚一点。 没有任何一个指标可以单独让你实现盈利。如果有人告诉你可以,那他是在向你兜售一个梦想。任何显示完美买卖箭头的指标都可以被做得看起来毫无瑕疵——只需要放大历史中的某一段并截取成功交易的截图。我们不会这样做。 SMC Intraday Formula 是一个工具。 它为你读取市场结构,标记出概率最高的价格区域,并用简单直白的语言准确告诉你当前智能资金的行为轨迹。你仍然需要做决定。你仍然需要执行交易。但现在,你是带着精确性执行,而不是靠希望。 我们已经在黄金(XAUUSD)以及主要外汇货币对的日内剥头皮交易中使用该指标将近三年。这是我们在 M1、M5、M15 和 M30 上的日常主力工具。它之所以有效,是因为它不试图预测未来——它展示的是当前正在形成的高概率交易机会,并解释 为什么 。 它与其他所有指标有什么不同? 大多数交易指标只做一件事。移动平均线交叉。振荡指标触及某个水平。出现一个箭头。你进场交易。你亏损。你责怪指标。重复。 SMC Intraday Formula 将多个机构级概念整合为一个统一的市场解读: - 斐波那契共振引擎 不只是普通的斐波那契水平——该指标
Ultra Indicator
Ihor Otkydach
5 (1)
ULTRA 是一項採用「一站式」運作模式的技術指標——它能獨立分析市場、產生交易訊號、顯示設定停損單的價位,並建議何時平倉以鎖定獲利或將損失降至最低。 換句話說,無論您是否懂得分析市場、判定價位(該將停損設在哪裡),或是對資金管理感到棘手,都無妨。ULTRA 會為您處理所有這些事情! 買家專屬好禮 : 購買 ULTRA 指標後,請透過私訊聯繫我,即可免費獲贈「ULTRA BOT」。這是一款特別設計的工具,能協助您根據該指標發出的訊號來管理已開倉的交易(它會為每筆交易設定停損點,並依照策略規則自動平倉,以爭取最佳交易結果)。 我還會為買家提供各種資產的預設參數,讓該指標能發揮最大效能。請透過私訊聯繫我,免費獲得這些超級好處! ULTRA 策略的運作方式 ULTRA 指標會分析歷史價格數據(涵蓋約過去 4 年),並自動學習辨識波段反轉,以便在實際交易中為您創造最大利潤。 該指標的訊號絕不會重新繪製!!一切都盡可能做到真實且直觀! ULTRA 指標運用特殊的虛擬化演算法,根據歷史數據計算所有訊號的結果,並將其交易成果顯示於儀表板上。這意味著您甚至在開始交易之前,就能預先了解 ULTRA 指標
Gann Made Easy MT5
Oleg Rodin
5 (13)
Gann Made Easy   是一个专业且易于使用的外汇交易系统,它基于使用先生理论的最佳交易原则。 W.D.江恩。该指标提供准确的买入和卖出信号,包括止损和获利水平。您甚至可以使用推送通知在旅途中进行交易。 购买后请联系我,即可免费获得交易指导和超棒的额外指标! 您可能已经多次听说过江恩交易方法。通常 Gann 的理论不仅对于新手交易者而且对于那些已经有一定交易经验的人来说都是非常复杂的东西。这是因为江恩的交易方法在理论上并不那么容易应用。我花了几年时间来完善这些知识,并将最好的原则应用到我的外汇指标中。 该指标非常易于应用。您所需要的只是将其附加到您的图表并遵循简单的交易建议。该指标不断进行市场分析工作并寻找交易机会。当它检测到一个好的入口点时,它会为您提供一个箭头信号。该指标还显示止损和获利水平。 换句话说,当您像先生一样进行交易时,该指标会为您提供最佳江恩建议。江恩亲自告诉你此时此刻该做什么。但最好的部分是您不需要了解任何有关江恩交易原则的知识,因为该指标会为您完成整个市场分析工作。
M1 Sniper MT5
Oleg Rodin
5 (7)
M1 SNIPER   是一款易于使用的交易指标系统。它是一个专为 M1 时间框架设计的箭头指标。该指标可以作为独立的系统在 M1 时间框架下进行剥头皮交易,也可以作为您现有交易系统的一部分使用。虽然该交易系统专为 M1 时间框架交易而设计,但它也可以用于其他时间框架。我最初设计此方法是为了交易 XAUUSD 和 BTCUSD。但我发现这种方法在其他市场交易中也同样有用。 指标信号既可以顺势交易,也可以逆势交易。我教授一种特殊的交易技巧,帮助您利用指标信号进行双向交易。该方法基于使用特殊的动态支撑位和阻力位区域。 购买后,您可以立即下载 M1 SNIPER 箭头指标。此外,我还为所有 M1 SNIPER 工具用户免费提供下方屏幕截图所示的 Apollo Dynamic SR 指标!这两个指标的组合可以帮助您更轻松、更准确地利用 M1 时间框架进行交易。 购买后请联系我,免费获取交易提示和奖励指标! 祝您交易成功!
下一次更新 — 版本 2.52 即将推出![全新功能] 准备迎接 4 项重大新功能,全面提升您的市场分析能力与交易流程! 我们将通过 4 项全新功能,进一步提升市场分析水平,满足您的交易需求。现为您介绍: 1. TRADE OVERVIEW DASHBOARD 2. CONFLUENCE AT ZONE 3. STRONG & WEAK HIGH/LOW 4. OTE 1. TRADE OVERVIEW DASHBOARD 一个帮助您更轻松地了解整体市场状况的仪表盘,为您的交易决策提供参考指引,帮助您系统地分析市场并规划交易,所有信息尽在一个屏幕中。 多时间周期市场概览(Multi-Timeframe Market Overview) 更清晰地了解市场方向与价格结构 快速查看市场状况 为系统化市场分析和入场规划提供指引。 2. CONFLUENCE AT ZONE 当价格进入关键区域时……您将了解有多少项支持因素相互吻合。 关键区域是交易决策至关重要的地方。但仅仅是价格进入某个区域还不够。此功能可帮助您在入场交易前,识别相互吻合的因素,包括信号及其他相关因素,从而进行更全面的分析,并
Adaptive Price Action Engine 买指标,免费送EA 自适应多时间框架趋势与K线形态智能分析系统 市场环境始终在变化,不同的市场阶段中,并非所有 Price Action 形态都具有相同的参考价值。 Adaptive Price Action Engine 旨在适应不断变化的市场条件,将 趋势结构、多时间框架分析、K线形态与统计优化 整合到一个统一的分析框架中。 两种自适应模式 Dual Alpha Trend Mode(双 Alpha Trend 模式) 自动搜索适合的 Alpha Trend 参数,并结合低周期与高周期市场结构,使指标能够根据近期市场行为动态调整趋势识别。 Candlestick + Alpha Mode(K线 + Alpha 模式) 将 Alpha Trend 市场状态与 22种多空K线形态 相结合。系统不会简单地对所有形态一视同仁,而是对不同的形态组合进行统计评估,并识别在特定市场环境下表现出更强历史统计特征的配置。 主要功能 趋势参数自动优化 多时间框架市场状态分析 22种多头与空头 Price Action K线形态 对数千种可能
FiboSniper Pro
Van Minh Nguyen
5 (4)
FiboSniper Pro – Multi-Filter Fibonacci System with Auto SL/TP and Control Panel FiboSniper Pro 是一款技术指标,将动态 Fibonacci Envelopes 与多个确认过滤器相结合,以生成经过筛选的 Buy 和 Sell 信号。Fibonacci 水平基于 Moving Average 和 ATR 计算,然后通过 ADX、EMA、RSI、ATR、Volume、Time 和 Candle 结构进行过滤。该指标直接在图表上显示基于 ATR 自动计算的 Stop Loss 和 Take Profit 水平,并提供交互式控制面板,以便快速调整参数。 购买后,请通过 MQL5 给我发送消息,即可免费获取 Auto Trader X,以及有关如何将该指标的交易信号自动化的说明。 用户指南和设置文件: [Click here] 完整文档请参阅产品博客: [Click here] 加入官方频道获取最新更新: [Click here] 专为偏好结构化入场和清晰风险管理的交易者设计,适用于 Gold (XAU
Auto Optimized SpeedAngle 是一款机构级的动量向量化系统,通过持续的前瞻优化(Walk-Forward Optimization, WFO)彻底消除了曲线拟合(curve-fitting)。该指标没有采用在市场 状态转换时容易失效的静态输入参数,而是利用出样外验证(Out-of-Sample, OOS) dynamically 动态重新校准设置,从而确保显示的 信号代表真正的统计优势,而非历史巧合。 核心机构级架构 前瞻优化引擎(Walk-Forward Optimization Engine): 核心算法持续扫描数千种回溯周期(lookback)与阈值组合,严格将数据划分为样本内(in-sample)和样本外(out-of-sample)。只有当参数配置在未知数据环境中证明具备数学优越性时,系统才会对其进行 adoption。 量化目标函数(Quantitative Objective Functions): 优化引擎不一味追求绝对毛利,而是聚焦于机构级的稳定性指标。用户可针对系统质量数(SQN)、期望值(每笔交易的平均 R 倍数)或净 R 值进行优化,从而优
Boba Analysis Suite
Trade Ready Solutions LLC
5 (2)
Boba Analysis Suite Boba Analysis Suite 是一款适用于 MetaTrader 5 的分析指标。它将市场结构、关键价格区域和整体市场背景整合到同一图表视图中。 该指标源于交易及交易教学的实践经验,旨在帮助用户建立有条理的分析流程:评估市场方向、识别重要价位,并结合多个时间周期进行分析。 结合市场背景进行分析 单个信号的意义取决于市场背景。Boba Analysis Suite 帮助用户将当前图表状况与更大范围的市场结构相结合,并根据预先制定的规则评估交易思路。 分析功能包括: **趋势与市场结构:**评估市场方向及相关结构背景。 **关键价格区域与价位:**在图表上直观标示值得进一步分析的重要区域。 **多时间周期:**整合不同时间周期的信息,评估整体市场背景。 **可视化分析流程:**直接在图表上查看分析信息。 自主做出交易决策 Boba Analysis Suite 适合希望系统分析图表并结合多个时间周期信息的交易者。 该指标用于辅助分析,不会开仓或平仓,也不能替代交易策略或风险管理。每一笔交易的决策均由用户自行做出。 使用与许可 平台:Meta
ScalpPoint
Temirlan Kdyrkhan
ScalpPoint is a powerful trading companion designed to generate high-probability entry signals with dynamic TP/SL/DP levels based on volatility. Built-in performance tracking shows win/loss stats, PP1/PP2 hits, and success rates — all updated live. Key Features: Buy/Sell signals with adaptive volatility bands Real-time TP/SL/DP levels based on ATR Built-in MA Filter with optional ATR/StdDev volatility Performance stats panel (Success, Profit/Loss, PP1/PP2) Alerts via popup, sound, push, or emai
ARICoins
Temirlan Kdyrkhan
ARICoin is a powerful trading companion designed to generate high-probability entry signals with dynamic TP/SL/DP levels based on volatility. Built-in performance tracking shows win/loss stats, PP1/PP2 hits, and success rates all updated live. Key Features: Buy/Sell signals with adaptive volatility bands Real-time TP/SL/DP levels based on ATR Built-in MA Filter with optional ATR/StdDev volatility Performance stats panel (Success, Profit/Loss, PP1/PP2) Alerts via popup, sound, push, or email Cust
Crystal Heikin Ashi Signals
Muhammad Jawad Shabir
5 (5)
Crystal Heikin Ashi Signals—Professional Trend & Signal Detection Indicator Advanced Heikin Ashi Visualization with Intelligent Signal System for Manual & Automated Trading Final Price: $149 ---------> Price goes up $10 after every 10 sales . Limited slots available — act fast . Overview User Guide PDF Crystal Heikin Ashi Signals is a professional-grade MetaTrader 5 indicator that combines pure Heikin Ashi candle visualization with an advanced momentum-shift detection system. Designed for both m
Scalper Vault MT5
Oleg Rodin
5 (1)
Scalper Vault 是一套功能强大且配置完善的交易系统,专为追求日内交易稳定性的交易者而设计。 作为一套完整且独立的交易系统,该高精度指标能够为外汇和二元期权交易者提供机构级的市场分析。 购买后请联系我,获取我的独家交易技巧以及一份超值赠品! Scalper Vault 能够消除凭感觉交易和复杂的各种手动分析,让您只需专注于执行交易,并运用简单易行的交易技巧进行操作。 精准的顺势交易信号:其核心算法通过分析市场结构,仅在市场主导趋势的方向上提供高胜率信号,从而大幅减少错误的入场操作。 精确的顶部与底部探测:系统能够识别市场动能耗尽的状态,从而锁定潜在的反转区域。 基于江恩(Gann)理论的买卖区域:系统会自动绘制江恩数学市场点位,让您能清晰洞察大型机构交易者在何处寻求买入或卖出。 100% 不会重绘(Non-Repainting):一旦K线收盘,生成的信号便会永久固定在图表上。绝无动态偏移,绝无虚假信号——您在历史数据中所见,即为该指标的真实表现。 广泛的市场适用性:适用于各类货币对、黄金、指数以及加密货币交易。
Azimuth Pro
Ottaviano De Cicco
5 (7)
Azimuth Pro V2:MT5合成分形结构分析与确认入场 概述 Azimuth Pro 是 Merkava Labs 推出的多层级波段结构指标。四层嵌套波段层级、锚定波段的VWAP、ABC形态识别、三时间框架结构过滤以及收盘确认入场——一个图表,一个从微观波段到宏观周期的完整工作流程。 这不是盲目的信号产品。它是一个以结构为先的工作流程,专为重视位置、背景和时机的交易者打造。 万圣节促销 — 立减35% 市场愈发诡谲,你的优势依然锐利。立享35%优惠,别让这份好礼消散在迷雾之中。 Azimuth Pro 现价 259 美元(原价 399 美元)。 1. V2的变化 合成多时间框架引擎 高时间框架分析从零开始重建,采用与Meridian Pro相同的专有合成架构。更清晰的HTF背景、稳定的实时行为、无经典MTF同步问题。合成引擎还解锁了 固定比率时间框架级联 (x2、x3、x4、x6)——不再在经纪商的固定时间框架之间任意跳转,您可以按图表时间框架的固定倍数分析结构,在每个尺度上保持相同的分形关系。 确认入场箭头 作为稳定且可恢复的执行层而设计的收盘确认箭头。当ABC设
Trend Catcher ind mt5
Ramil Minniakhmetov
5 (18)
趨勢捕捉指標 趨勢捕捉指標結合了作者獨有的客製化自適應趨勢分析指標,用於分析市場價格趨勢。它透過過濾掉短期噪音,並專注於潛在的動能強度、波動性擴張和價格結構行為,來識別真實的市場方向。此外,它還結合了平滑和趨勢過濾等客製化指標,例如移動平均線、相對強弱指標 (RSI) 和波動率過濾器。 您可以在這裡查看實際運行情況以及我的其他產品: https://www.mql5.com/en/users/mechanic/seller 請注意,我不會在 Telegram 上出售 EA 或任何設置,那是騙局。所有設定都可以在我的部落格上免費取得。 重要提示!購買後請立即聯繫我,以獲取使用說明和額外獎勵! 請注意,我不會在 Telegram 上出售 EA 或任何設置,那是騙局。所有設定都可以在我的部落格上免費取得。
Volatility Master for MetaTrader is a real-time dashboard tool that scans up to  50 symbols  to identify high-volatility , trending markets instantly. With bullish/bearish signals, customizable alerts, and a user-friendly interface, it helps you avoid range-bound conditions and focus on high-probability trades. Clarity leads to confidence. Trade confidently and protect your capital effectively with this powerful dashboard. We don't offer free or bonus indicators in exchange of reviews from you.
Apex Patterns PRO 购买指标 — 免费获取基于该指标的 Expert Advisor。 自我优化的图表形态与突破分析智能 传统的形态扫描器依赖固定输入,在市场波动和结构发生变化时通常表现不佳。 Apex Patterns PRO 旨在适应不断变化的市场条件,将结构性图表形态识别、动量过滤和统计自我优化结合到一个分析框架中。 适应性扫描引擎 自我优化形态模式 在近期历史数据中自动搜索合适的形态参数,使指标能够根据当前市场行为调整其结构检测,而不是使用静态配置。 智能突破过滤 将经典形态识别与动量、成交量和价格行为指标相结合。引擎不会同等对待每次突破,而是评估潜在的市场结构,以识别符合当前统计环境的交易设置。 主要功能 固定的、不重绘的实时信号 自我优化的形态检测参数 丰富的图表结构库(顶部/底部、头肩顶/底、三角形、楔形) 基于动量和成交量的突破过滤 基于市场结构的动态止损和止盈水平 图表信号和实时性能指标 标准的推送、电子邮件和平台提醒 专为适应不断变化的市场条件而设计,而非依赖永久固定的参数 核心理念 目标不是将静态的几何形状强加于动态的市场。 目标是让历史市场数据
Unix Scalper
Issam Kassas
4 (4)
Unix Scalper — MetaTrader 5 购买后,请在 MQL5 上给我发消息,即可免费获得 Smart Universal Expert Advisor,以及在线课程、PDF 手册和私人群组访问权限。 发现交易形态,看清交易计划,选择执行方式。 UNIX Scalper 将市场分析、BUY/SELL/WAIT 决策以及 Entry、Stop Loss、TP1 和 TP2 水平集中在一个清晰的面板中。 看清信号与交易计划 • 明确的决策:BUY、SELL 或 WAIT。 • 明确的价格水平:Entry、Stop Loss、TP1 和 TP2。 • 多时间周期概览:比较面板中各时间周期的信号。 • 辅助分析:趋势、动量、成交量、波动率、支撑与阻力,以及市场质量。 • 灵活的布局:Minimized、Compact、Standard 或 Full。 查看信号,检查价格水平,再判断该交易形态是否符合您的交易规则。 从黄金和比特币开始 建议首先使用的交易品种:XAUUSD 和 BTCUSD。 探索短期剥头皮交易和较高时间周期分析。选择历史K线范围,通过表现曲线查看所选设置
Neuro Poseidon MT5
Daria Rezueva
4.68 (53)
Neuro Poseidon is a new indicator by Daria Rezueva. It combines precise trading signals with adaptive TP/SL levels - creating best possible trades as a result! Message me and get  Neuro Poseidon Assistant  as a gift to automize your trading process! What makes it stand out? 1. Proven profitability on all assets and timeframes 2. Only confirmed BUY and SELL signals present on the chart 3. Adaptive TP & SL levels generated by the software for each trade 4. Easy to understand - suitable for al
SIO Oscillator
Davit Beridze
SIO Oscillator:自优化半方差失衡振荡器 购买指标,即可免费获得基于该指标的智能交易系统(EA)。 大多数振荡器对所有价格波动一视同仁。SIO 将上行压力与下行压力分开,并衡量两者之间的失衡程度,清楚显示究竟是买方还是卖方在真正掌控市场。当失衡达到极值时,SIO 会给出明确的信号,并附带入场价、止损(Stop Loss)和止盈(Take Profit)水平。 SIO 的独特之处在于它不依赖固定参数。内置的自优化器会持续寻找适合当前品种和周期的参数,并在使用之前对其进行验证。 两种信号模式 均值回归(Mean Reversion):在失衡极值处交易,预期价格回归平衡。 趋势跟随(Trend Following):顺着持续、占主导地位的失衡方向交易。 自动模式:由优化器根据近期数据选择表现更好的模式。 具备真实验证的自优化器 滚动前推优化(Walk-forward):参数只用历史数据选出,然后应用于之后的K线。 真正的样本外保留期(Hold-out):结果会在优化器从未训练过的数据上得到确认。 平台图(Plateau map):所有测试参数的可视化热力图。SIO 优先选择结果稳
Atomic Analyst MT5
Issam Kassas
4.5 (64)
Atomic Analyst — MetaTrader 5 购买后,请在 MQL5 上给我发消息,即可免费获得 Smart Universal Expert Advisor,以及在线课程、PDF 手册和私人群组访问权限。 Atomic Analyst 将价格行为、趋势方向、入场和出场信号、止损位及多个止盈位集中呈现在图表上。 看清信号,理解交易形态 Atomic Analyst 将分析结果整理为清晰的可视化信息: • 买入和卖出箭头,用于识别潜在的入场机会。 • 止损位和多个止盈位,帮助规划交易。 • 趋势、强度和动量读数,用于评估市场方向。 • 多时间周期分析,用于比较更广泛的市场背景。 • 彩色K线和提醒,帮助您跟踪变化的市场条件。 结合辅助分析查看信号,再判断该交易形态是否符合您的交易规则。 从短期形态到更大级别的行情 您可以将 Atomic Analyst 用于剥头皮交易、日内交易,或跟踪持续时间更长的市场走势。 建议从 H1 时间周期开始。建议交易品种包括 EURUSD、AUDUSD 和 XAUUSD。 从信号到自动化 Smart Universal Expert A
作者的更多信息
Vortex oscillator mt5
Vincent Albert Feugier
VORTEX OSCILLATOR: The Power of Volume Flow VORTEX OSCILLATOR is an advanced trading tool that transforms the classic Vortex indicator into a highly responsive precision oscillator. Designed for traders who demand absolute clarity, it merges price action and volume to reveal the true strength behind every market movement. What Makes VORTEX OSCILLATOR Unique Most indicators simply follow price, often resulting in late entries. VORTEX OSCILLATOR utilizes a mathematical approach centered on Volume-
Four rsi mt5
Vincent Albert Feugier
Multi-RSI: 4 RSI in 1 for Comprehensive and Fast Market Analysis Analyze market strength and momentum like a professional. Multi-RSI combines four distinct RSI indicators into a single window, providing a clear view of market dynamics across multiple timeframes. Each RSI features a configurable period to adapt to your specific trading strategies and styles. Key Features 4 RSI in one indicator: Track multiple timeframes simultaneously. Fully customizable periods: Individually adjust each RSI to f
FREE
Fisher Transform MT4
Vincent Albert Feugier
Fisher Transform by HYPOLITE MAKER – Professional Precision Oscillator Experience the definitive version of the Fisher Transform, engineered by HYPOLITE MAKER. The Fisher Transform is renowned for spotting price reversals before they happen. However, the standard version is often too sensitive to market noise. Fisher Transform by HYPOLITE MAKER fixes these issues to provide a stable, highly visual, and profitable trading experience. What makes this version superior to the standard indicator? To
Four rsi mt4
Vincent Albert Feugier
Multi-RSI: 4 RSI in 1 for Comprehensive and Fast Market Analysis Analyze market strength and momentum like a professional. Multi-RSI combines four distinct RSI indicators into a single window, providing a clear view of market dynamics across multiple timeframes. Each RSI features a configurable period to adapt to your specific trading strategies and styles. Key Features 4 RSI in one indicator: Track multiple timeframes simultaneously. Fully customizable periods: Individually adjust each RSI to f
FREE
Blackjack mt5
Vincent Albert Feugier
Table Royale — Product Description The best traders know how to wait. The smartest ones know how to stay busy in the meantime. Table Royale turns your MetaTrader into a trading floor… and a gaming table. An elegant panel, a 52-card deck, and 25,000 € in virtual chips to spice up your idle hours. Hit, stand, double down — real Black Jack, right inside your chart. Available in 7 languages: Français · English · Español · Italiano · Deutsch · 日本語 · 中文 30-second set
FREE
Price manipulation risk mt4
Vincent Albert Feugier
Price Manipulation Risk Indicator Advanced Risk Assessment and Manipulation Detection Tool The Price Manipulation Risk Indicator is a professional tool designed to measure the current level of market risk. It analyzes price behavior, market activity, and candle dynamics to identify unstable or potentially manipulated phases. This tool helps traders avoid traps, filter out false signals, and improve entry and exit timing. Product Objective Provide a visual and immediate assessment of market condi
Kst pro tools MT4
Vincent Albert Feugier
KST Pro Tools: Advanced Momentum Indicator KST Pro Tools is an advanced and optimized implementation of Martin Pring’s Know Sure Thing (KST) indicator. Designed for traders seeking an objective reading of market momentum, this tool filters out market noise to highlight only the phases of directional acceleration. Through intelligent filtering logic, KST Pro Tools allows you to quickly identify dominant trends and distinguish between phases of strength and periods of neutrality. Key Features Opti
Canal icare MT4
Vincent Albert Feugier
ICARUS CHANNEL The ICARUS CHANNEL is a technical indicator designed to identify extreme price zones and optimize your entry and exit points in the market. How It Works The tool is based on a Simple Moving Average (SMA) , which represents the fair market value. Around this line, it identifies overbought (Premium) and oversold (Discount) zones: Premium Zone (Orange): Price is considered too high. Ideal for selling (short). Discount Zone (Blue): Price is considered a bargain. Ideal for buying (long
Pairs synthetique mt4
Vincent Albert Feugier
Pairs Synthetic Pro (Synthetic Pairs & Spread) Master Correlation Trading Correlation trading and statistical arbitrage are now within your reach thanks to the Pairs Synthetic Pro indicator. This tool goes beyond simple ratio analysis, acting as a specialized radar for detecting price imbalances between two assets to anticipate market corrections. For example, when Brent rises while WTI lags, the price spread widens. Our indicator, integrated with adaptive Bollinger Bands, identifies when this d
Vortex oscillator mt4
Vincent Albert Feugier
VORTEX OSCILLATOR: The Power of Volume Flow VORTEX OSCILLATOR is an advanced trading tool that transforms the classic Vortex indicator into a highly responsive precision oscillator. Designed for traders who demand absolute clarity, it merges price action and volume to reveal the true strength behind every market movement. What Makes VORTEX OSCILLATOR Unique Most indicators simply follow price, often resulting in late entries. VORTEX OSCILLATOR utilizes a mathematical approach centered on Volume-
True strength index mt4
Vincent Albert Feugier
TrueStrength Oscillator v1.00 Visual representation Thick blue line: The main TSI, which tracks market momentum. Thick red line: The signal line, which follows the main line closely to identify crossovers. Thin blue bars: Histogram bars extending from the zero line to the main blue line. Dotted gray line: The zero level, providing a clear reference for trend reversals. Operational advantages Fixed scale: The range remains constant between -0.000001 and +0.000001 for consistent reading. No repain
Klinger Volume Oscillator  Short Description A volume-based flow analysis tool designed to visualize buying and selling pressure through a dual-colored histogram. Detailed Description The Klinger Volume Oscillator Histo is a technical analysis indicator that explores the relationship between price movement and transactional volume. By converting the traditional Klinger Oscillator into a dynamic histogram, this tool allows traders to observe the internal strength of market movements. The indicato
Price manipulation risk
Vincent Albert Feugier
Price Manipulation Risk Indicator Advanced Risk Assessment and Manipulation Detection Tool The Price Manipulation Risk Indicator is a professional tool designed to measure the current level of market risk. It analyzes price behavior, market activity, and candle dynamics to identify unstable or potentially manipulated phases. This tool helps traders avoid traps, filter out false signals, and improve entry and exit timing. Product Objective Provide a visual and immediate assessment of market condi
Kst pro tools
Vincent Albert Feugier
KST Pro Tools: Advanced Momentum Indicator KST Pro Tools is an advanced implementation of the famous Know Sure Thing (KST) indicator by Martin Pring. Designed for traders seeking an objective reading of momentum, this tool filters out market noise to highlight only the phases of directional acceleration. Through an intelligent filtering logic, KST Pro Tools allows you to quickly identify dominant trends and distinguish strong momentum phases from periods of market neutrality. Key Features Optimi
Canal icare
Vincent Albert Feugier
ICARUS CHANNEL The ICARUS CHANNEL is a technical indicator designed to identify extreme price zones and optimize your entry and exit points in the market. How It Works The tool is based on a Simple Moving Average (SMA) , which represents the fair market value. Around this line, it identifies overbought (Premium) and oversold (Discount) zones: Premium Zone (Orange): Price is considered too high. Ideal for selling (short). Discount Zone (Blue): Price is considered a bargain. Ideal for buying (long
Pairs synthetique mt5
Vincent Albert Feugier
Pairs Synthetic Pro (Synthetic Pairs & Spread) Master Correlation Trading Correlation trading and statistical arbitrage are now within your reach thanks to the Pairs Synthetic Pro indicator. This tool goes beyond simple ratio analysis, acting as a specialized radar for detecting price imbalances between two assets to anticipate market corrections. For example, when Brent rises while WTI lags, the price spread widens. Our indicator, integrated with adaptive Bollinger Bands, identifies when this d
Fisher Transform MT5
Vincent Albert Feugier
Fisher Transform by HYPOLITE MAKER – Professional Precision Oscillator Experience the definitive version of the Fisher Transform, engineered by HYPOLITE MAKER. The Fisher Transform is renowned for spotting price reversals before they happen. However, the standard version is often too sensitive to market noise. Fisher Transform by HYPOLITE MAKER fixes these issues to provide a stable, highly visual, and profitable trading experience. What makes this version superior to the standard indicator? To
True strength index mt5
Vincent Albert Feugier
5 (1)
TrueStrength Oscillator v1.00 Visual representation Thick blue line: The main TSI, which tracks market momentum. Thick red line: The signal line, which follows the main line closely to identify crossovers. Thin blue bars: Histogram bars extending from the zero line to the main blue line. Dotted gray line: The zero level, providing a clear reference for trend reversals. Operational advantages Fixed scale: The range remains constant between -0.000001 and +0.000001 for consistent reading. No repain
Klinger Volume Oscillator  Short Description A volume-based flow analysis tool designed to visualize buying and selling pressure through a dual-colored histogram. Detailed Description The Klinger Volume Oscillator Histo is a technical analysis indicator that explores the relationship between price movement and transactional volume. By converting the traditional Klinger Oscillator into a dynamic histogram, this tool allows traders to observe the internal strength of market movements. The indicat
Xauxag panel gestion mt5
Vincent Albert Feugier
XAU/XAG Panel Gestion Introduction Gold (XAU) vs. Silver (XAG) arbitrage is a cornerstone strategy for hedge funds and institutional traders. This professional-grade panel for MetaTrader 5 provides an all-in-one control station to exploit correlation gaps and relative strength between these two precious metals. Designed for surgical precision, it automates complex ratio calculations and risk management to ensure flawless execution. 1. Dual-Leg Trading System (Arbitrage) Unlike standard directio
Forex flux liquidity
Vincent Albert Feugier
The Ultimate Raw Strength & Currency Flow Analyzer for MetaTrader 5. FOREX FLUX LIQUIDITY is a high-precision dashboard designed to instantly identify where the "smart money" is moving. By scanning up to 28 currency pairs simultaneously, this tool filters out market noise to reveal the true intrinsic strength and current liquidity of every major currency. 1. Reading and Interpretation The interface utilizes a dual-visual system for lightning-fast decision-making: The Power Gauge: Measures the cu
Canal of shizukesa
Vincent Albert Feugier
SHIZUKESA Channel – Precision Volatility via Kijun Dynamics The SHIZUKESA Channel (Japanese for "Serenity") is a high-performance technical analysis tool built for traders who demand structural clarity. Unlike standard envelopes or Bollinger Bands that fluctuate with noise, this channel is mathematically rigid : it creates a 100% synchronized clone of the Kijun-Sen to identify objective price deviations. Core Features & Functionality Perfect Clone Structure : The bands do not rely on variable st
Trend series indicator
Vincent Albert Feugier
The Trend Series Indicator is a momentum-based tool designed to isolate and quantify the persistence of price cycles. While traditional oscillators like RSI or Stochastics often "flatten" during strong trends, the TSI measures the actual duration of the current market impulse. How It Works The indicator tracks the sequence of consecutive directional closes: Green Bars (Positive): Counts the streak of bullish candles. Each new higher close increments the bar (+1, +2, +3...). Red Bars (Negative):
STC Pro-Volume Dynamics: Advanced Momentum & Market Pressure Indicator STC Pro-Volume Dynamics is a high-performance trend cycle indicator developed for MetaTrader 5. Engineered for systematic and discretionary traders who demand precision, it merges the proven Schaff Trend Cycle (STC) algorithm with an integrated visual analysis of execution volumes. The objective of this tool is not to provide "magic" predictions, but to deliver a clear, stable, and statistically actionable reading of price dy
Trading isn't just about whether the price is going up or down; it's about how it is moving. The DPO is a structural indicator that neutralizes the underlying trend to isolate the market's pure cyclic component. What is the DPO, really? Mathematically, the DPO measures the distance between the current price and its moving average. It doesn't follow direction: It measures speed and acceleration. The "Detrending" concept: By subtracting the trend (the average), the indicator "flattens" the price.
Candle liquidity volume
Vincent Albert Feugier
Volume Color Candles v1.02   is an MT5 indicator that colors candlesticks based on their direction and relative volume. Bullish candles transition from light green to dark green, bearish candles from light red to dark red, featuring 8 gradient levels per direction (16 individually adjustable colors total). Parameters : 21 inputs including 16 customizable colors, volume average period (20), "high volume only" option, and threshold multiplier (1.2x). The algorithm compares current tick_volume to i
Why MarketSentiment Pro? Standard indicators only look at a single timeframe, leaving you blind to the bigger picture. Our proprietary algorithm analyzes 4 simultaneous time cycles across 4 different assets on a single screen. This gives you a unique "Eagle Eye" view of the market. Relative Strength Algorithm: Pure mathematical calculation based on the price position within its recent range ( $Position = \frac{Price - Low}{High - Low}$ ). 80% Reliability Target: By waiting for all 4 gauges to
Trail of SMOKE
Vincent Albert Feugier
Trail of SMOKE v1.0 The Kinetic Footprint of Price. Trail of SMOKE is an advanced momentum indicator that transforms raw volatility into a fluid visual structure. While traditional indicators merely follow price with a lag, Trail of SMOKE projects market energy to identify zones of real acceleration and institutional exhaustion. The Science Behind the "SMOKE" The name isn't just for aesthetics. The indicator functions like an aerodynamic slipstream: Force Projection: It calculates the gap betwee
Lyapunov exponent
Vincent Albert Feugier
Lyapunov Exponent Indicator for MT5 Measures the rate at which nearby market trajectories diverge over time — a concept from chaos theory applied to price series. What it measures The speed at which two initially close market states diverge. Fast divergence indicates a chaotic/trending regime. Convergence indicates a stable/consolidating regime. Reading the indicator Value near 1 → market in chaotic / trending regime Value near 0 → market in stable / ranging regime White line : Lyapunov exponent
Asymmetry lnp
Vincent Albert Feugier
ASYMMETRY OF LOSSES & PROFITS — MT5 Indicator The concept Most traders know their loss in %. Few know how much they need to gain to get back to breakeven. This is the mathematical asymmetry of markets: losing 50% doesn't require +50% to recover — it requires +100% . The bigger the loss, the more disproportionate the recovery effort. Loss Required gain to recover -10% +11.1% -25% +33.3% -50% +100% -75% +300% -90% +900% This indicator makes that number visible, continuously, directly on your MT5 c
筛选:
无评论
回复评论