Four rsi mt4
- 指标
- 版本: 1.0
- 激活: 20

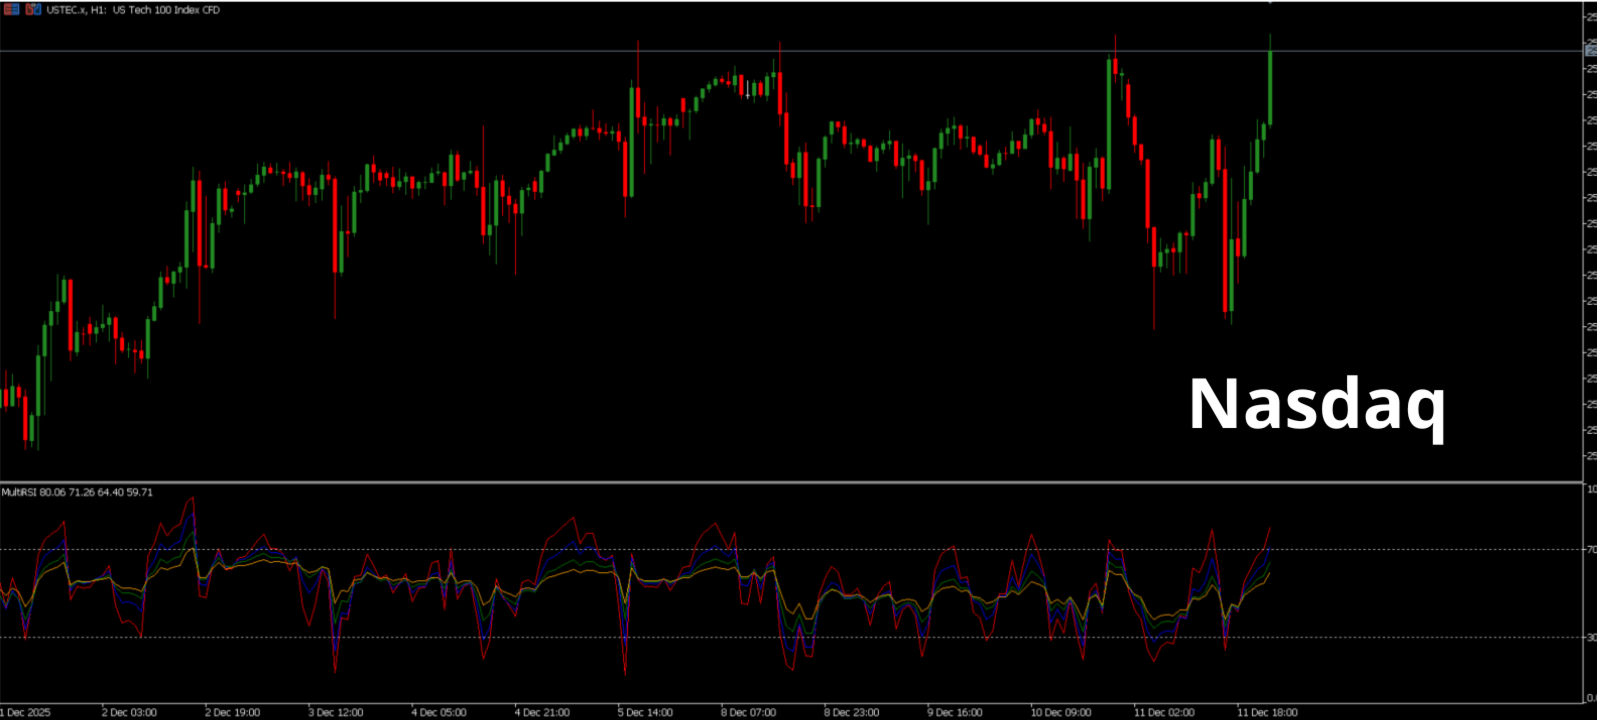
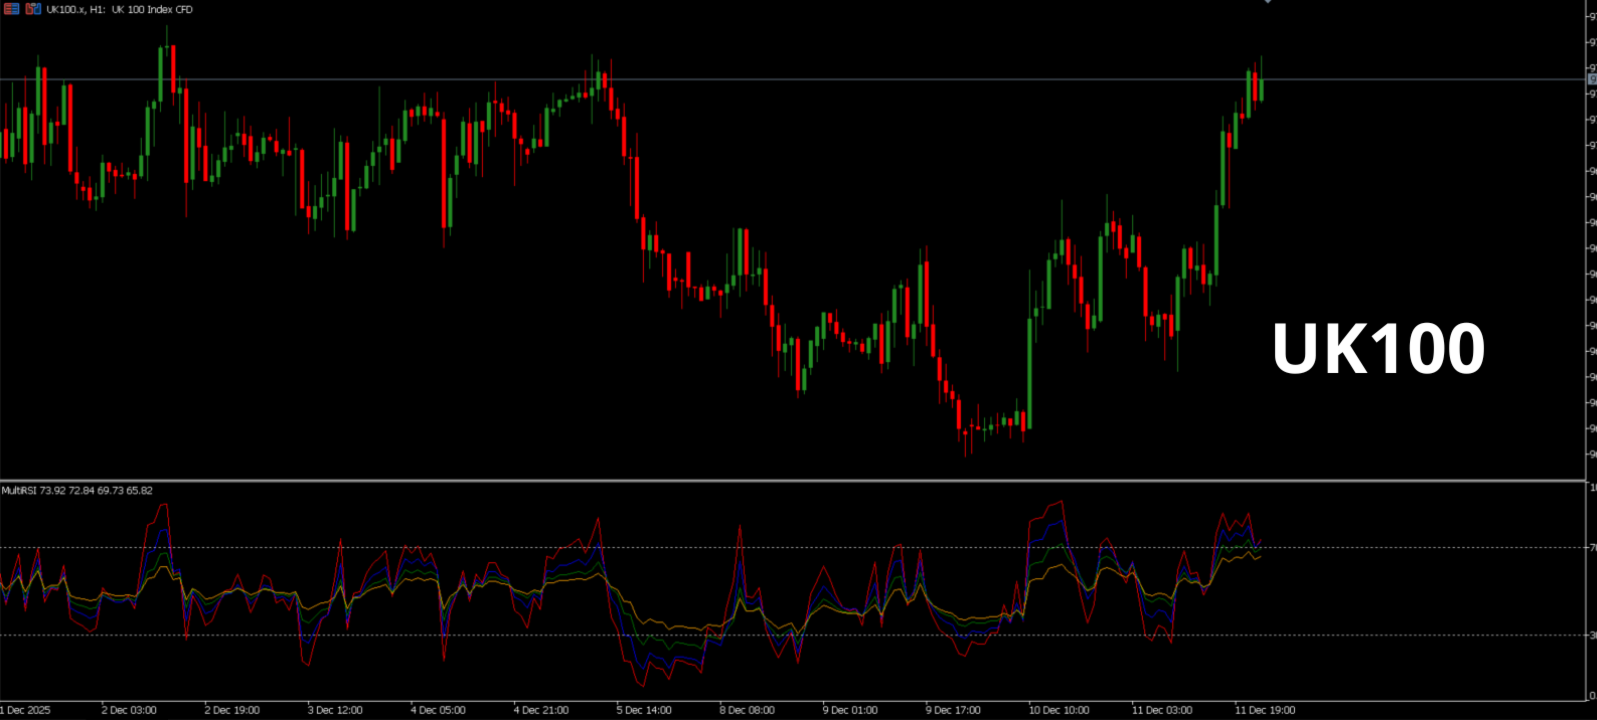
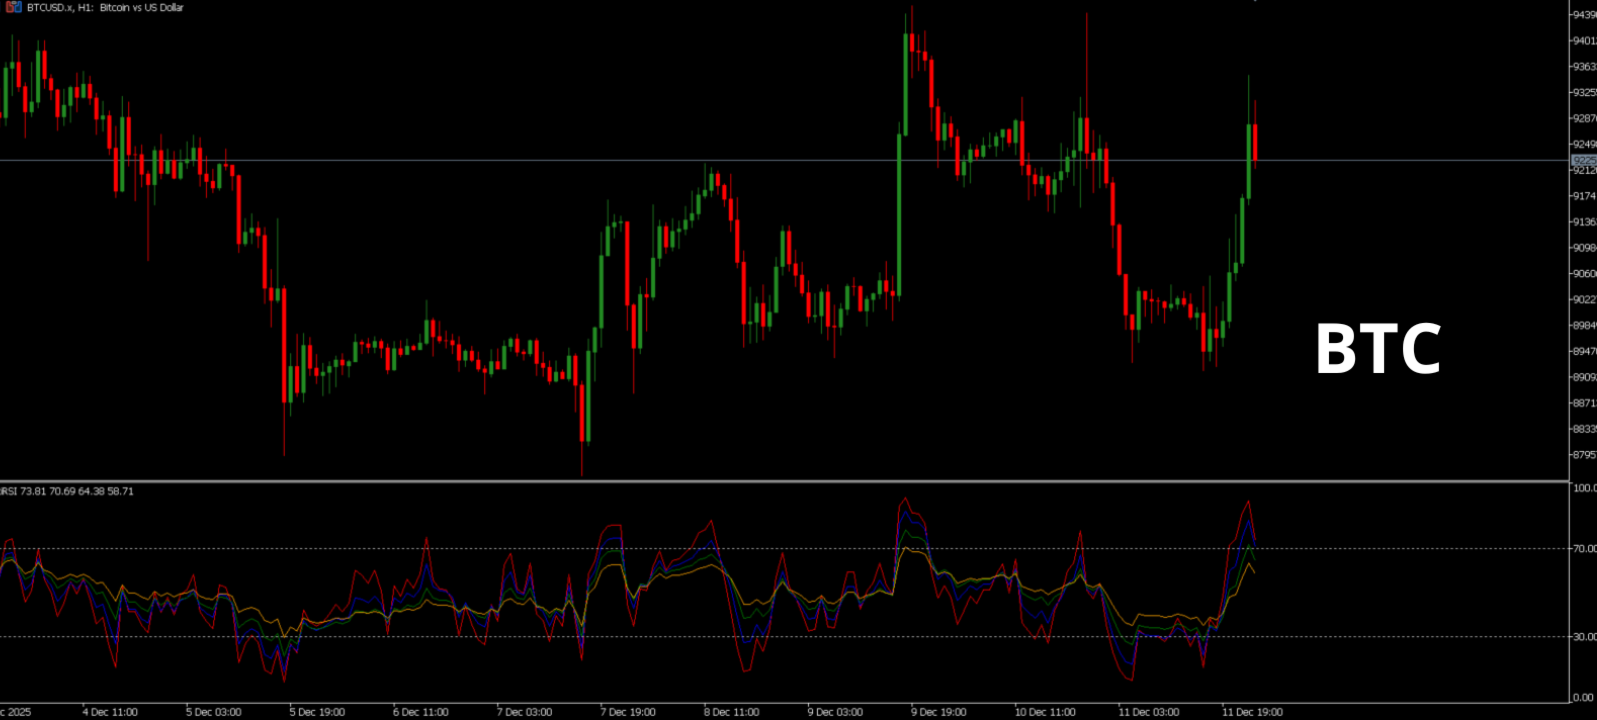
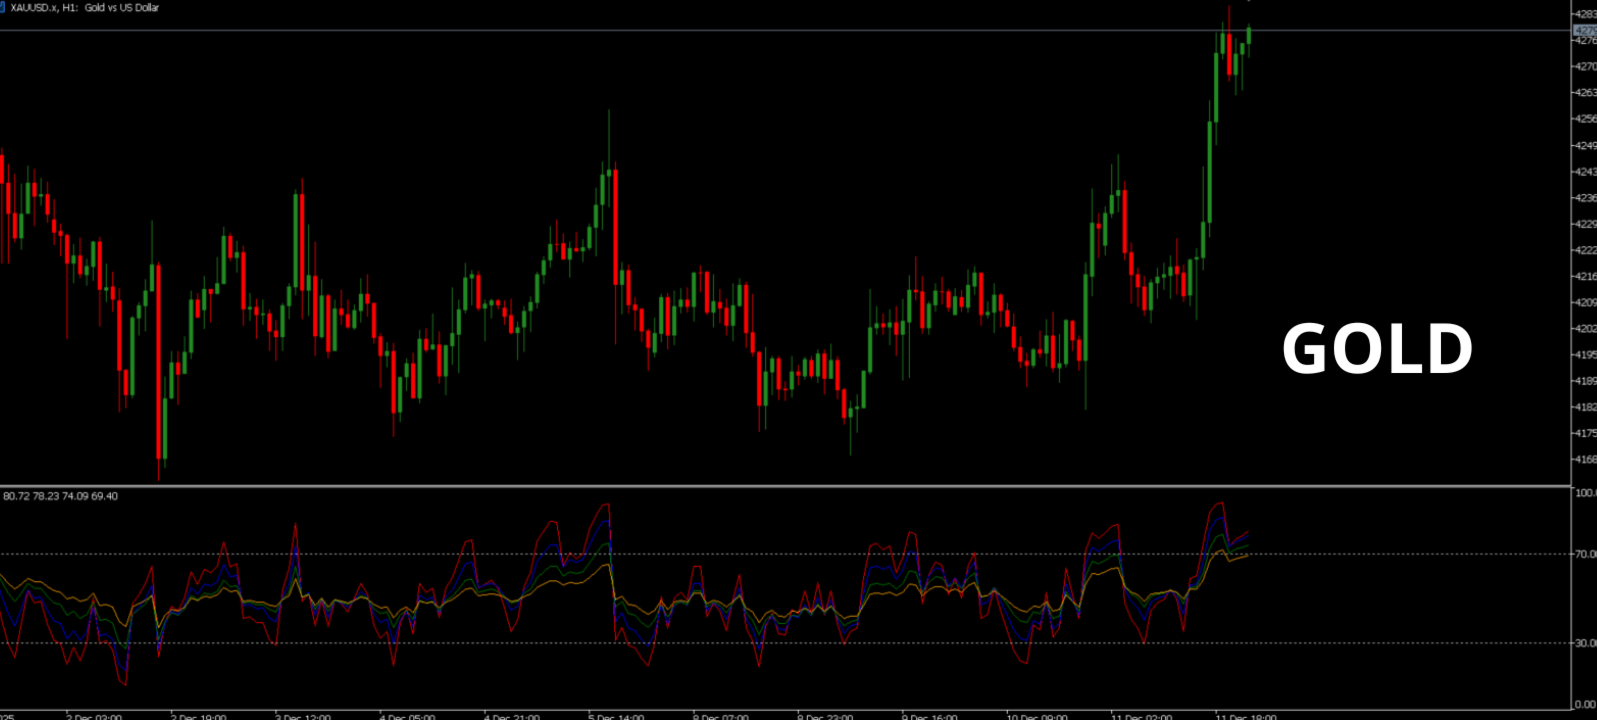
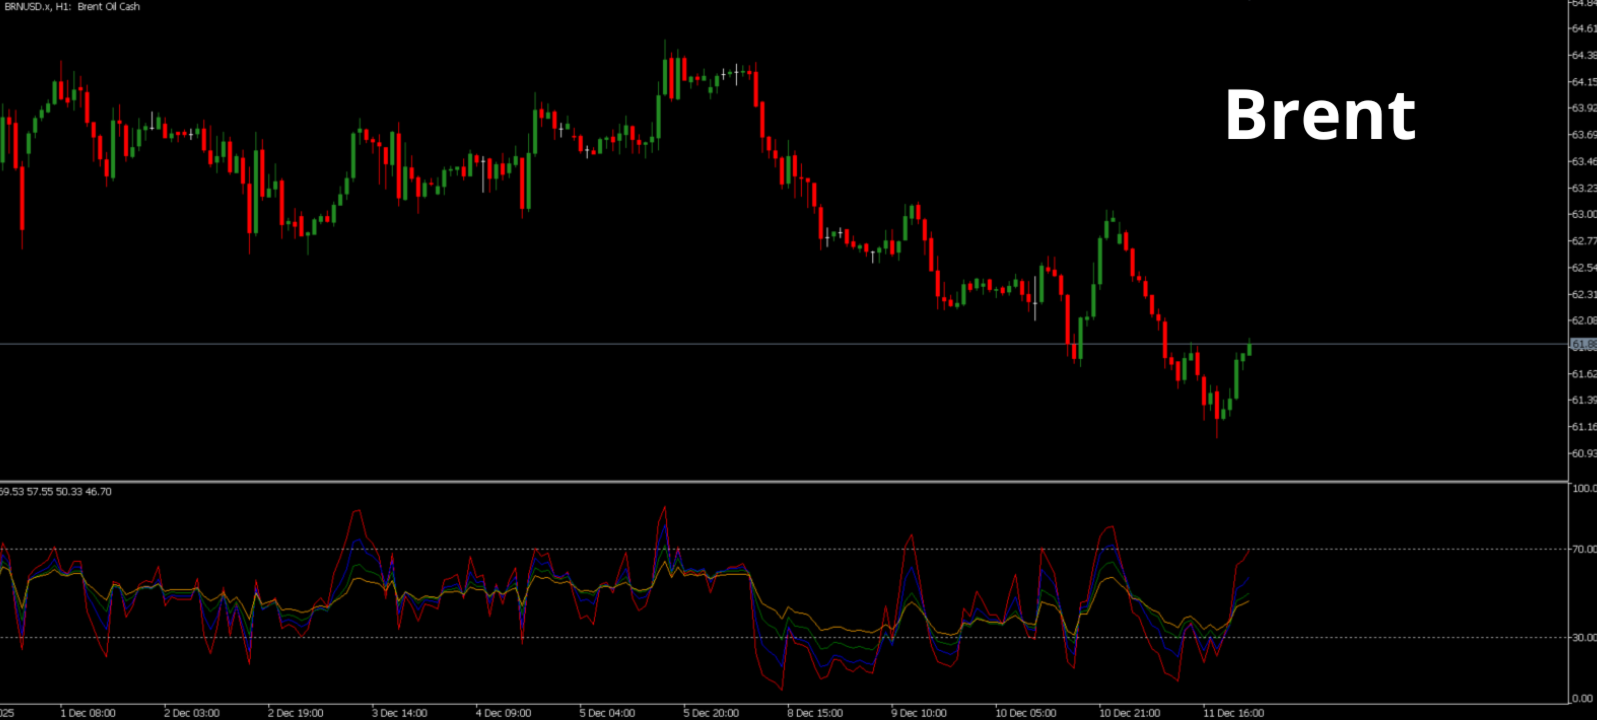
Multi-RSI: 4 RSI in 1 for Comprehensive and Fast Market Analysis
Analyze market strength and momentum like a professional. Multi-RSI combines four distinct RSI indicators into a single window, providing a clear view of market dynamics across multiple timeframes. Each RSI features a configurable period to adapt to your specific trading strategies and styles.
Key Features
-
4 RSI in one indicator: Track multiple timeframes simultaneously.
-
Fully customizable periods: Individually adjust each RSI to fit your strategy.
-
Clear display: Each RSI is assigned a unique color for instant readability.
-
Separate window: Keep your main charts clean and organized.
-
Optimized calculation: High performance even over long periods and large datasets.
Ideal Use Cases
-
Identify overbought and oversold conditions across multiple timeframes.
-
Compare short, medium, and long-term momentum simultaneously.
-
Confirm entry and exit signals with greater precision.
-
Conduct multi-period monitoring without cluttering your screen with multiple indicators.
Why Choose Multi-RSI?
Multi-RSI consolidates four powerful indicators into one tool, offering a comprehensive view of the market at a glance. With its flexible settings and streamlined display, Multi-RSI is an essential tool for any trader looking to quickly analyze relative market strength across diverse horizons.
Enhance your analysis and increase your precision today with Multi-RSI.