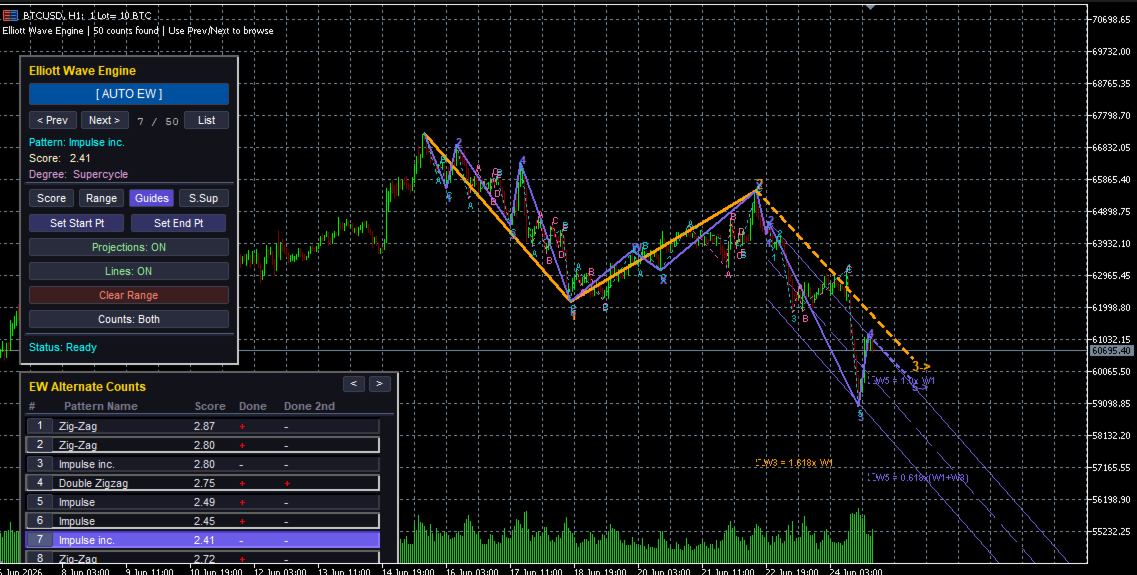
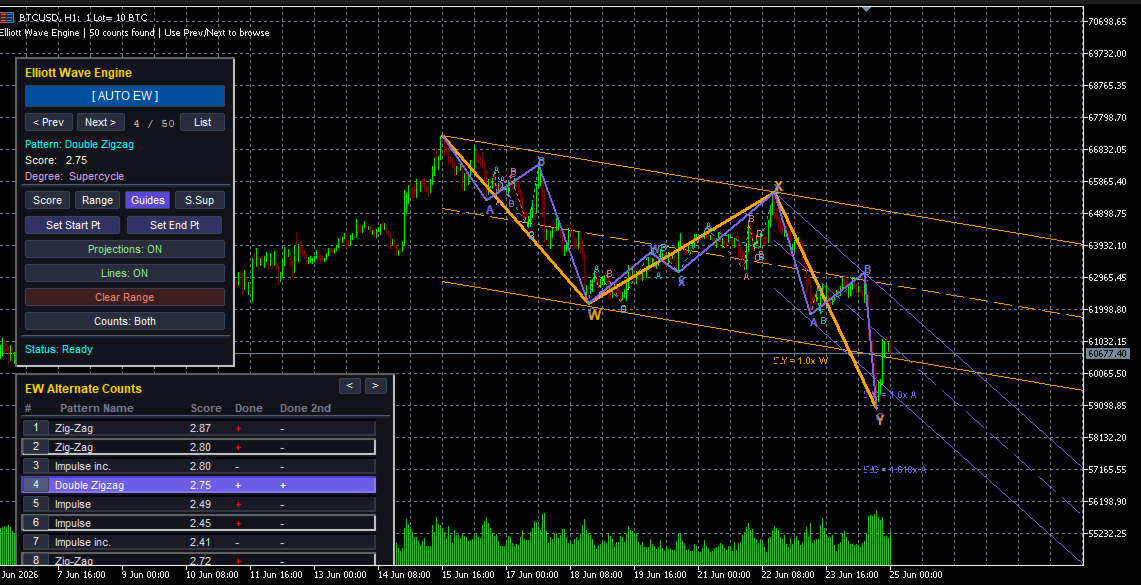
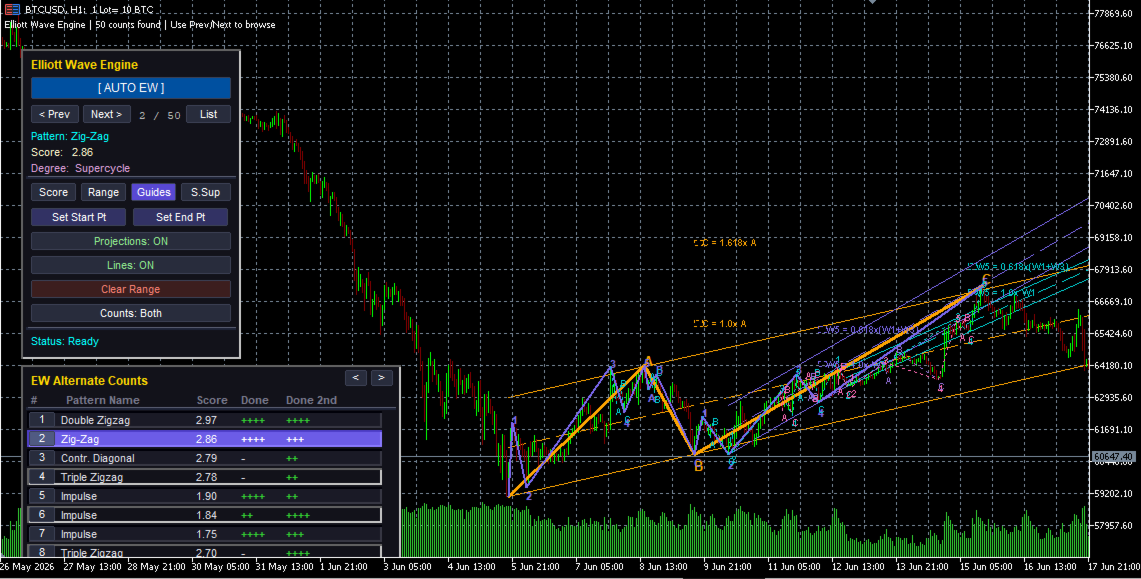
Elliott Wave Engine

Elliott Wave Engine

The Auto Elliott Engine is a tool designed for MetaTrader 5 that automates the identification, decomposition, and projection of price structures based on the Elliott Wave Theory.

Powered by a pattern-recognition engine, this indicator processes price action to identify market configurations, translating data into structured scenarios.

Key Features
  • Multi-Degree Recognition: Analyzes price action across multiple fractal levels. From higher degrees, such as Supercycle or Cycle, down to minor structures.

  • Pattern Decoder: Identifies impulsive formations (Standard Impulses, Contractive/Expanding Diagonals) and corrective patterns (Simple and Complex Zig-Zags, Regular/Expanded Flats, Triangles, and WXY/WXYXZ Combinations).

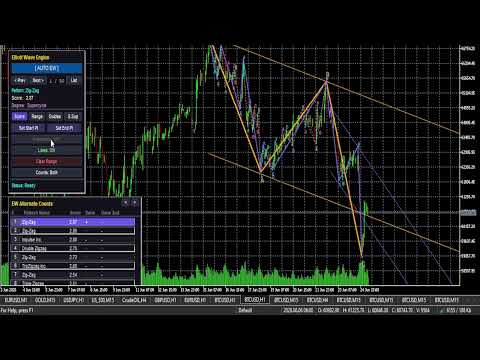
  • Fibonacci Projections: The system projects retracement and extension zones on the chart based on the active wave. The interface allows for toggling between visualizing key areas of the last wave or a mapping of all calculated ranges.

  • Scoring System: Each suggested count undergoes a qualification process. If a structure shows anomalies or exceeds the margins of classic Elliott behavior, such as excessive retracements or unusual proportions, the engine assigns penalties to prioritize others counts that adhere to classic wave theory.

- EW Alternate Counts List Panel:  
- Appears right below the main panel, stacked vertically.   - Aligns cleanly on left edges for left corners and right edges for right corners.   - Automatically shifts the main panel upwards in bottom-corner configurations to ensure both panels fit on screen.   - Lists up to 8 counts per page with index buttons, pattern names, scores, and completion checks (`+`, `++`, etc.).   - Features mouse-wheel scrolling.   - Click-to-Select: Clicking on any alternate count row instantly updates the chart drawing to showcase that specific pattern.
Ideal For

Technical market analysts and price-action specialists who seek to assist their wave counting and automate the mapping of price expansions and contractions.

Important Note: This indicator does not take into account all Elliott Wave guidelines; for example, it does not include "The Right Look".

How to Use
  • Start the Analysis: Click the "Start" button to select the starting point of the wave count. This should be an extreme point from which the count originates.

  • Historical Range: We recommend selecting a range of 100 to 200 historical bars. Calculating the wave structure is resource-intensive; while you can experiment with a larger historical range, please be aware that processing times will increase. If you require analysis over a larger historical range, we recommend switching to higher timeframes.

  • Run the Count: Click the "Auto EW" button to execute the count within your selected range.

  • Manage Projections: You can toggle the visual projections by clicking the "Projections: ON / Projections: OFF" button.

  • Navigation: Use the "< Prev" and "Next >" buttons on the interface to view alternative wave counts.

Filters: by Score, by Range, by Guides, and by S. Sup.

  • Score: Based on the overall point rating.
  • Range: Based on the price range covered.
  • Guides: Based on guidelines.
  • S. Sup: Based exclusively on the score of the higher-degree pattern.

The Vertical label spacing multiplier has been set to 1 by default. However, if you notice that labels overlap on the same vertex, we recommend increasing this value to 2 or 3 to resolve the issue (for example, in assets like BTC).


By default, the indicator is configured to perform a count automatically as soon as it is loaded onto the chart. But It works best when the user selects the range they want the indicator to process and then clicks "Auto EW".

Strategy Tester:

The interactive panel is now supported in the Strategy Tester. It performs almost identically to real-time Live Charts (only minor differences are expected due to the nature of the testing engine).

I have included the following useful settings to use in the Strategy Tester:
  1. Auto-analyze on load = true (by default)
  2. Analyze on new bar close = true (by default)


    推荐产品
    An all‑in‑one trading assistant that blends AI candle synthesis with a 15‑pattern Heat Map, ATR‑scaled S/R & pivots, and a Vigilant risk monitor (LOC/TF/SR/PAT gates, Ready%, EM points, SR‑distance bar). The Opportunity Advisor adds ETAs, checklists and gate status; Multi‑TF Confluence confirms alignment from M1–D1. The Professional Trade Suggestion panel shows regime, session filter, R:R presets, Partials and Quality Pause. Clean, readable UI with one‑click S/R toggles, scanners and a built‑in,
    Ultimate Double Top & Bottom (Pro Volume Matrix) Stop trading retail breakouts. Start trading Institutional Traps. The   Ultimate Double Top & Bottom   is not a standard, lagging pattern scanner. It is a highly advanced, non-repainting structural engine equipped with a proprietary   3-Leg Volume Matrix . Designed exclusively for Smart Money Concepts (SMC) and order flow traders, this indicator mathematically dissects the tick volume inside M and W patterns to reveal true institutional intent:  
    The  OBV MTF  is an Enterprise-grade On-Balance Volume indicator that transforms standard OBV into a complete trading system. It combines gradient-aware momentum analysis, divergence detection, multi-timeframe alignment, and dynamic customisable midpoint-filtering in a single intuitive professional volume analysis tool. Core Features 1. 5-State Momentum Engine Aqua (Strong Bullish) : OBV slope rising with positive acceleration SteelBlue (Weak Bullish) : OBV rising but losing momentum Gray (Neutr
    MFOP Market Forecast
    Oscar Josue Pin Bacuzoy
    Develop this indicator for periods of 30 minutes or more, focus on getting market trends right and making sure they are met. MFOP v8.1 gets straight to the point: it scans the market and tells you exactly when there is enough strength to enter a trade. This indicator doesn't do magic, it uses mathematical algorithms to filter out market noise, not enter into false breakouts and show you clear BUY (blue arrow) and SELL (red arrow) opportunities. It is designed and optimized specifically to take
    ICT Institutional Zones Pro
    Celestine Anyango Wabomba
    ICT Institutional Zones Pro — Trade with Institutional Precision Stop wasting time manually drawing key ICT levels every day. ICT Institutional Zones Pro is a professional-grade MT5 indicator built for traders who use ICT (Inner Circle Trader) and Smart Money Concepts (SMC) to read market structure with precision. This indicator automatically maps the most important institutional levels directly on your chart, helping you instantly identify where smart money is likely accumulating, distributing
    Ai Scalper Pro
    Dhiraj Shivprabhu Pattewar
    1. Precision Entry Engine (The Edge) True-Swing Breakout Technology: The EA doesn't rely on lagging indicators. It maps live market structure, identifying localized "True Swings" (fractal highs and lows) to anticipate explosive momentum breakouts. Pre-Emptive Stacking: Anticipates major moves by placing resting Stop orders exactly at critical levels. When Gold breaks out, you are already in the trade. Daily Clean-Sweep: Every day at rollover (23:50), the bot automatically purges all resting o
    Most traders buy oversold and sell overbought. This system does the exact opposite — on purpose. In strong trending markets, price can stay overbought or oversold for a very long time. We deliberately enter when the market is already “stretched” because that is exactly when the trend is strongest and most likely to continue. We put a tight Stop Loss (eg. 3 ATR) and hold the position till the trend ends. This is the same style of the famous Turtles traders.
    Anubi Terminal MT5
    Marco Maria Savella
    Anubi Terminal is a professional trade management assistant designed for manual traders who demand precision, speed, and strict risk control. Unlike automated bots, Anubi puts the trader in control, providing a sophisticated interface to execute and manage trades according to institutional-grade risk management rules. Why Anubi Terminal? Manual trading often fails due to calculation errors and emotional exits. Anubi eliminates these risks by automating position sizing and trade management based
    中文(简体)(粘贴到“Chinese”) H4 Structure Entry Dashboard 是一款专业的多周期交易辅助工具,将 H4 市场结构 与 H1/M15 入场确认 相结合,并通过简洁的 图表仪表盘 和清晰的 BUY/SELL 箭头 进行展示。 适用于希望快速、结构化决策的交易者: 先看结构(H4)→ 再找入场(H1/M15)。 核心功能 真正的多周期逻辑 由 H4 提供高周期方向/偏向 在 H1 或 M15 上进行入场确认 市场结构工具(H4) 自动识别并绘制 支撑/阻力区域 智能分组(聚合相近水平) 可选: 趋势线 、 斐波那契 、 供需区/订单块(Order Blocks) 入场确认(当前图表周期) 识别蜡烛图形态(如吞没、锤子/流星、晨星/暮星、多种十字星、inside bar) 假突破/拒绝逻辑(开启时) 仪表盘清单 清晰面板汇总当前环境与信号条件 帮助减少低质量信号、保持一致性 可视化信号 在图表上绘制清晰的 BUY/SELL 箭头 多种绘图与过滤可通过参数开关控制 推荐设置 建议加载周期: H1 或 M15 高周期分析: H4 (内部作为结构过滤器
    Professional VWAP Trading System with Advanced Signal Detection Transform your trading with the most comprehensive VWAP indicator available for MetaTrader 5. Magic VWAP Key Levels Pro combines multiple timeframe analysis, intelligent signal detection, and professional-grade visualization to give you the edge in modern markets. CORE FEATURES: Multi-Timeframe VWAP Analysis Session, Weekly, and Monthly VWAP calculations Previous 10-day VWAP support/resistance Dynamic anchor periods (Session/Week/Mo
    NEXY is a professional multi-timeframe trading system based on Market Structure (HH/HL/LH/LL) and Fibonacci Retracement zones.  CORE STRATEGY: The EA identifies pivot points (higher highs, higher lows, lower highs, lower lows) to determine the market structure. Once the main structure is established, it calculates Fibonacci retracement zones (0.618-0.786) where the price is likely to retrace before continuing in the direction of the trend. You can select which timeframes to align with the main
    XAU Amnesia Protocol
    Napat Puangjunkum
    XAUUSD AMNESIA PROTOCOL AI     Amnesia Protocol - Exploiting the chaotic moments when the market forgets all technical analysis.    XAUUSD Amnesia Protocol AI is a breakthrough trading system based on "The Market Amnesia Hypothesis". When high-impact news hits or panic ensues, the market experiences temporary "Amnesia". Support and resistance levels become meaningless, and chaos takes over. This EA is specifically designed to remain dormant during normal market conditions and instantly awaken th
    Aussenstab Markttechnik
    Alexander Josef Zeidler
    This indicator shows external bars ("Aussenstäbe") in the chart in candle form. The colors of the candles can be set individually. Also different colors for bearish and bullish bars are possible. In addition, the color of the wicks or outlines is also adjustable. Outside bars are mentioned e.g. by Michael Voigt in the book "Das große Buch der Markttechnik". All other candles are inner bars.
    Aurum mid quant pro
    N'da Lemissa Kouame
    AURUM MID-QUANT PRO v5.60 Quantitative Excellence for Gold (XAU/USD) & Volatility Trading Gain a professional edge over institutional markets with AURUM MID-QUANT PRO , an advanced Price Action Pattern Detection and Breakout Engine designed exclusively for MetaTrader 5 . Built specifically to capture the unique volatility of Gold (XAU/USD) and other major financial instruments, this powerful indicator combines high-precision algorithmic pattern recognition with real-time dynamic accumulation z
    这个多时间框架和多品种指标扫描 Pin bar、晨星/晚星、吞没、镊子、三线罢工、内线和三角旗。 该指标也可用于单一图表模式。请在产品的     博客 。     结合您自己的规则和技术,该指标将允许您创建(或增强)您自己的强大系统。 特征 可以同时监控您的市场报价窗口中可见的所有交易品种。将该指标仅应用于一张图表,并立即监控整个市场。 监控从 M1 到 MN 的每个时间范围,并在识别出模式时向您发送实时警报(弹出、推送或邮件)。 可以使用 RSI 和布林带作为 pin bar、晨星/晚星 、吞没和镊子形态的 过滤器,以便正确识别潜在的逆转。 可以使用移动平均线作为主要趋势过滤器,使用 ADX 作为波动率过滤器。 该指示器包括一个交互式面板。当单击一个项目时,将打开一个带有相关代码和时间范围的新图表。 该指标可以将信号写入一个文件,EA 可以使用该文件进行自动交易。比如 这个产品 。 Pennant 和三角形扫描可识别高概率的突破模式。它通过识别强大的、对称的三角旗和三角形来做到这一点。这种模式在更高的时间范围内不会经常出现。但是当它发生时,这是一个非常高概率的设置。请参见     截
    这个多时间框架和多品种指标识别双顶/双底、头肩、三角旗/三角形和旗形模式。也可以仅在颈线/三角形/旗杆突破发生时设置警报(颈线突破 = 顶部/底部和头肩的确认信号)。     该指标也可用于单一图表模式。请在产品的     博客 。结合您自己的规则和技术,该指标将允许您创建(或增强)您自己的强大系统。 特征 可以同时监控您的市场报价窗口中可见的所有交易品种。将该指标仅应用于一张图表,并立即监控整个市场。 可以监控从 M1 到 MN 的每个时间范围,并在模式被识别或突破时向您发送实时警报。支持所有 Metatrader 原生警报类型。 可以使用 RSI 作为趋势过滤器来正确识别潜在的逆转。 该指示器包括一个交互式面板。当单击一个项目时,将打开一个带有相关代码和时间范围的新图表。 该指标将信号写入一个文本文件,智能交易系统 (EA) 可以使用该文件进行自动交易。比如 这个产品 。   您可以在博客中 找到有关文本文件的内容和位置的更多信息 。 输入参数 输入参数的描述和解释可以在 这里 找到。 重要的 请注意,由于具有多功能性,既不会在安装指标的图表上绘制买卖建议,也不会绘制线条和箭
    Brilliant Reversals MultiCurrency Scanner MT5 是一款先进的交易指标,旨在帮助交易者识别多个货币对的潜在反转点。通过利用先进的算法,这个工具提供即时洞察,使其对希望优化交易策略的新手和经验丰富的交易者都极为重要。 该指标通过根据市场条件提供实时买入和卖出信号,增强了交易者的决策能力并改善了交易表现。凭借其全面的仪表板和警报功能,您可以轻松监控关键货币对,并迅速抓住市场机会。 MQL产品安装指南 | 在 MT4/MT5 上更新已购买的MQL产品 | 常见故障排除指南 | 指标设置 / 指南 主要特点 缓冲区集成:将指标值暴露为可访问的缓冲区,使 Expert Advisor 能够有效利用基于信号的交易。 可视化箭头信号:在您的图表上清晰地显示 BUY/SELL 箭头,方便您发现交易机会。 快速且可回测:基于 MetaTrader 的本地 OnCalculate() 引擎构建,确保快速计算并与策略测试器完全兼容。 弹出警报:在信号事件时触发警报弹窗,确保您不会错过潜在的交易设置。 推送通知:实时向您的 MetaTrader 移动应用发送推送通知,
    DoubleBB MARSI — 专为日内交易优化的全能图表工具 价格当前位置 · 市场情绪 · 入场信号 — 一屏掌握 一句话概述 DoubleBB MARSI 将日内交易所需的三大核心信息 — 每日参考价位 · RSI 市场情绪 · 双布林带信号 — 整合在同一张图表中,帮助交易者快速做出准确决策。 交易者获得的三大价值 DoubleBB MARSI 不仅是一个普通指标,而是覆盖整个日内交易周期的综合工具,所有信息一屏呈现。 1. "现在价格在哪里?" — 自动显示每日关键价位 图表上自动绘制三条关键线: · DO(Day Open · 今日开盘价) · PDH(Previous Day High · 前日最高价) · PDL(Previous Day Low · 前日最低价) 立刻判断当前价格处于多头还是空头优势区域。 "现在是在今日开盘价之上交易,还是之下?" "是否已突破前日高点,或跌破前日低点?" → 看一眼图表,1 秒钟内得出答案。 获得收益: · 节省判断方向的时间 · 设置止损 / 止盈时拥有清晰参考 · 立刻区分震荡区间与趋势行情 2. "现
    Institutional Intelligence
    Johan Adrian Nieto Resendiz
    Institutional Intelligence Institutional Intelligence is a modular market analysis indicator for MetaTrader 5. It combines structure, liquidity, institutional reference levels, price zones and two selectable signal strategies in one workspace. It is designed to organize market context, not replace execution or risk management. Every visual module can be enabled independently for a clean chart or a complete analytical view. Full Intelligence Panel The expandable Full panel provides a structured m
    Utilities
    Douglas Lucio De Araujo
    Indicator with 3 features - Clock : Clock independent of the chart, counting continues even when the market is closed. - Template : After setting up a configuration in any graphic, be it color patterns, indicators, zoom ... The configuration will be copied to all active graphics. - TimeFrame : Set the TimeFrame on a chart, and with just one click all the active charts will be changed to the same TimeFrame.
    Smart Money Structure & Precision Trading Indicator (MT5) Smart Money Structure & Precision Trading Indicator  is a powerful Smart Money Concepts (SMC) indicator for MetaTrader 5, designed to help traders identify high-probability entries with institutional logic . This indicator automatically detects market structure in real time , highlights key liquidity levels , and provides clear, non-repainting signals so you can trade with confidence and precision. Whether you are a scalper, day trader, o
    Slope MA with Tester
    Mohammad Taher Halimi Tabrizi
    Rule-compliant Description Category: Trend Indicator Platform: MetaTrader 5 Type: Level Indicator Timeframes: All Trader Styles: Scalping, Day Trading, Swing Trading Markets: All Description The Slope MA With Tester is a technical indicator that evaluates the slope of a moving average relative to volatility (ATR). It highlights directional bias through a color-coded slope line and plots entry arrows when slope conditions change. Main features: Slope-based Calculation – The slope of an EMA is nor
    Linear Trend Predictor — 结合切入点和方向支撑线的趋势指标。按照突破高/低价通道的原理运作。该指标算法过滤市场噪音,考虑波动性和市场动态。 指示器功能  使用平滑方法,显示市场趋势和开立买入或卖出订单的切入点。  适合通过分析任何时间范围内的图表来确定短期和长期的市场走势。  输入参数可适应任何市场和时间范围,允许交易者独立定制指标。  设定的指示信号不会消失,也不会重新绘制——它是在蜡烛收盘时确定的。  几种类型的通知以箭头组合。  该指标既可以作为独立的交易系统使用,也可以作为其他交易系统的补充。  可供任何经验水平的交易者使用。 主要参数 Volatility Smoothing Level - 指标的主要参数,允许您配置指标以实现舒适的操作。 它的数字范围是 1 到 100,从而增加了您可以获得更长趋势运动的平滑度。 通过少量的数字,您可以获得短期走势并快速退出交易。 使用指标进行交易的时刻:  红线和箭头表示下降趋势和卖出开盘信号。止损应根据前一个上分形来设置。  黄线和箭头表示上升趋势和买入开盘信号。止损应根据前一个下分形来设置。
    Neuro Poseidon MT5
    Daria Rezueva
    4.85 (54)
    Neuro Poseidon is a new indicator by Daria Rezueva. It combines precise trading signals with adaptive TP/SL levels - creating best possible trades as a result! Message me and get  Neuro Poseidon Assistant  as a gift to automize your trading process! What makes it stand out? 1. Proven profitability on all assets and timeframes 2. Only confirmed BUY and SELL signals present on the chart 3. Adaptive TP & SL levels generated by the software for each trade 4. Easy to understand - suitable for al
    Send me a message so I can send you the setfile 坚固的机器人,有多种配置可供选择, 使用 BTC 在 10 分钟时间范围内使用,设置如下图所示。 购买专家机器人时,您有权要求修改以继续改进机器人。 主要特点 移动平均线交叉策略: EA 使用两个移动平均线(MA1 和 MA2)来生成交易信号。 较快的 MA(MA1)与较慢的 MA(MA2)交叉会触发交易。 马丁格尔策略: 如果一笔交易导致亏损,则下一笔交易的手数将增加一个乘数(martingaleMultiplier)。 在交易获胜后或达到最大马丁格尔步数 (maxMartingale) 时,马丁格尔序列会重置。 风险管理: 止损(SL)和获利(TP)水平是可配置的。 包括追踪止损和盈亏平衡功能,以锁定利润并减少损失。 每日盈利/亏损限额:如果每日盈利或亏损超过指定的限额,EA 将停止交易。 筛选器: 波动率过滤器:使用 ATR 确保交易仅在指定的波动率范围内进行。 时间过滤器:将交易限制在特定的时间和星期几。 趋势过滤器:使用 ADX 确保交易按照趋势方
    Veltrion Smart Fibonacci   is a clean automatic Fibonacci structure overlay for MetaTrader 5. It automatically detects recent swing highs and swing lows, then draws key Fibonacci retracement levels directly on the chart. The indicator is designed to help traders visualize market structure, retracement zones, and the golden zone without manually drawing Fibonacci tools. Key Features Automatic swing high and swing low detection Clean Fibonacci retracement overlay Horizontal Fibonacci levels for a
    Anchored VWAP Trading Indicator Struggling to identify true market value and key support/resistance levels? The Anchored VWAP Trading Indicator helps you track price based on real traded volume, giving you a clear edge in your trading decisions. This tool allows you to anchor VWAP from any point on the chart, making it ideal for analyzing trends, reversals, and institutional activity. Key Features Anchored VWAP from any candle Accurate volume-weighted price calculation Works on all symbol
    Triplet Cloud MTF is an indicator for trend-following strategy. It presents the trend in HTF from the LTF Chart that allows traders focus on looking for trade entry in the right direction and increase striking rate. It comes with simple input setup. You will only need to choose HTF you want to follow its trend and set the alert setup, then all is set. Here are the mostly selected HTF setup for each of entry timeframe: M1 Entry   : M15 Trend M5 Entry   : H1 Trend M15 Entry   : H4 Trend H1 Entry  
    Trade Summary Pro
    Fatsani M Nkhono
    Trade Summary is a professional on-chart dashboard for MetaTrader 4 & 5 that provides a clear, real-time overview of your open trades. Monitor floating profit/loss, entry price, lot size, account risk, distance to stop loss, stop loss and take profit values, balance, and equity—all from one compact panel. Designed for traders who value speed and effective risk management, Trade Summary eliminates manual calculations and keeps essential information visible at a glance. It also includes a privacy
    Pure Diamond Trend Exhaustion Pure Diamond Trend Exhaustion 指标旨在识别市场动能枯竭区域及潜在的价格反转点。核心算法基于价格极值和蜡烛图影线结构分析,能够精准识别超买和超卖水平,且无需使用传统的滞后型振荡指标。 技术特性: 无重绘 (No Repaint): 指标信号(菱形)在当前蜡烛关闭后立即固定。一旦信号形成,不会随价格后续波动而消失或改变位置。 噪声过滤算法: 程序分析蜡烛实体与影线的比例,有效过滤既定价格区间内的虚假波动。 通用性: 指标适用于所有资产类型,包括外汇 (Forex)、加密货币、股指和商品。可在任何时间周期内使用。 极简界面: 采用图形化符号显示,避免占用交易者过多的图表空间,便于与其他技术分析方法结合。 使用方法: 该指标生成两种类型的信号: 粉色菱形 (Pink Diamond): 形成于局部高点,指示上涨动能枯竭。 蓝色菱形 (Blue Diamond): 形成于局部低点,指示下跌动能枯竭。 默认设置: 指标自带的预设参数已针对 M15 和 M30 时间周期进行了优化。这些设置在信号准确性与出现频率
    该产品的买家也购买
    UZFX {SSS} 超短线智能信号 v4.0 MT5 是一款无重绘的高性能交易指标,专为在快速波动的市场中需要精准、实时信号的超短线交易者、日内交易者和波段交易者设计。该指标由 (UZFX-LABS) 开发,融合了价格行为分析、趋势确认和智能过滤技术,可在所有货币对和时间周期内生成高概率的买卖信号、预警信号以及趋势延续机会。 别再对交易犹豫不决了,开始遵循这一专为追求清晰、精准和纪律性市场执行的交易者设计的结构化信号系统吧。 我的建议* 最佳时间周期:15分钟及以上。 {H1} 是我的最爱。而且效果令人惊叹……!! 更新后的主要功能 • 自动买入和卖出信号检测 • 先进的反转识别逻辑 • 潜在市场反转前的早期预警信号 • 趋势延续确认信号 • 内置风险管理功能,包含入场点、止损点、TP1、TP2和TP3水平 • 完全可自定义的风险回报比 • 实时警报、声音提醒和移动端推送通知 • 带交易建议的专业信息面板 • 适用于所有MT5交易品种和时间周期 • 界面简洁、轻量且用户友好 为什么交易者选择 UZFX SSS? 大多数交易者亏损的原因在于入场过晚、平仓过早,或者缺乏明确的交
    M1 Quantum MT5
    Hamed Dehgani
    4.27 (11)
    使用 M1 Quantum 的实盘交易信号 : 信号 (交易由 Quantum Trade Assistant 自动 执行,并作为本产品 免费 提供。) 最新消息: 版本 1.64 已发布。现在所有交易的止损都会设置在相应的支撑位/阻力位之后。Smart Close 功能也进行了改进,以提升此版本 EA 的性能。 自 8 月 9 日起,实盘信号一直运行在版本 1.64 上。 价格计划: 当前价格: $169 (早期用户优惠) 下一阶段计划价格: $189 计划零售价: $299 开发者提示: 购买后请联系我,以获取 最新推荐的参数设置文件(Set File) 、交易建议,以及加入 VIP 支持群组 ,与其他 M1 Quantum 用户交流经验。 常见问题 - 设置文件 - 安装指南 M1 Quantum 是一款专业的 M1 交易系统,提供快速且精准的交易信号,并内置止损(Stop Loss)、止盈(Take Profit)以及智能资金管理功能。 M1 Quantum 包含专业的资金管理系统,通过专注于 连续盈利交易 ,帮助交易者更快地增长账户资金。 M1 Quantum 指标 的主
    Azimuth Pro
    Ottaviano De Cicco
    5 (7)
    Azimuth Pro V2:MT5合成分形结构分析与确认入场 概述 Azimuth Pro 是 Merkava Labs 推出的多层级波段结构指标。四层嵌套波段层级、锚定波段的VWAP、ABC形态识别、三时间框架结构过滤以及收盘确认入场——一个图表,一个从微观波段到宏观周期的完整工作流程。 这不是盲目的信号产品。它是一个以结构为先的工作流程,专为重视位置、背景和时机的交易者打造。 ️ 夏季促销 — 庆祝夏至与 The Oracle Pro 上市:Azimuth Pro 七折优惠,现价 279 美元(原价 399 美元)。限时夏季优惠。 1. V2的变化 合成多时间框架引擎 高时间框架分析从零开始重建,采用与Meridian Pro相同的专有合成架构。更清晰的HTF背景、稳定的实时行为、无经典MTF同步问题。合成引擎还解锁了 固定比率时间框架级联 (x2、x3、x4、x6)——不再在经纪商的固定时间框架之间任意跳转,您可以按图表时间框架的固定倍数分析结构,在每个尺度上保持相同的分形关系。 确认入场箭头 作为稳定且可恢复的执行层而设计的收盘确认箭头。当ABC设置形成且自适应确认逻辑
    Btmm state engine pro
    Garry James Goodchild
    5 (4)
    BTMM State Engine Pro by G-Labs — Beat The Market Maker indicator for MetaTrader 5. Asian session range, London and New York kill zones, level progression (L1/L2/L3), peak formation detection (PFH/PFL), entry signals, and a multi-pair scanner from one chart. Stop scanning charts one pair at a time. The State Engine tracks the BTMM daily cycle automatically — Asian box, room boundaries, level blocks, peak formations, and filtered entries — while the scanner dashboard shows level, peak status, d
    The Oracle Pro
    Ottaviano De Cicco
    5 (1)
    The Oracle Pro:用于 MT5 的合成多周期偏向引擎 ️ 夏季上市优惠 — 早期买家可以 199 USD 获得 The Oracle Pro。价格将随关注度上升;最终价格 399 USD。 The Oracle Pro 是一款面向高要求与专业交易者的 MetaTrader 5 高级多周期 偏向引擎 。它以纪律回答一个问题:当前每个周期的方向偏向是什么、强度如何、各周期之间的一致程度如何?一切仅在已收盘的 K 线上计算——绝不重绘。 The Oracle Pro 是一套多因子共识系统。它将专有指标与优化算法整合为单一而精密的共识向量,并在单个指标实例内,跨当前周期与更高周期的堆栈进行读取——而不是在多个图表上堆叠互不相关的工具。 它是 Oracle 共识方法的专业进化版:完整重建为高级操作控制台,面向希望在一个纪律化工作流中获得深度、多周期背景与背离洞察的交易者。 是偏向引擎,而非信号生成器 The Oracle Pro 明确自身定位。它是一款提供纪律化方向背景的 多周期多因子偏向指标 。它 不是 信号生成器:不承诺入场、出场或盈利。偏向是背景——你在其方向上交易自己的设置
    ARICoins
    Temirlan Kdyrkhan
    ARICoin is a powerful trading companion designed to generate high-probability entry signals with dynamic TP/SL/DP levels based on volatility. Built-in performance tracking shows win/loss stats, PP1/PP2 hits, and success rates all updated live. Key Features: Buy/Sell signals with adaptive volatility bands Real-time TP/SL/DP levels based on ATR Built-in MA Filter with optional ATR/StdDev volatility Performance stats panel (Success, Profit/Loss, PP1/PP2) Alerts via popup, sound, push, or email Cust
    Smart Market Structure Toolkit
    Garry James Goodchild
    5 (1)
    Smart Market Structure Pro by G-Labs — ICT and Smart Money Concepts toolkit with built-in multi-symbol scanner for MetaTrader 5. Break of structure, change of character, order blocks, fair value gaps, liquidity sweeps, premium and discount zones, ICT sessions, confluence scoring, AI trade ideas, and a traffic-light scanner across up to 30 pairs and four timeframes from one chart. Map SMC and ICT on the active chart while the built-in scanner monitors your full watchlist. Each cell shows BUY, S
    Gem SIGNAL
    Shengzu Zhong
    5 (1)
    GEM Signal Pro GEM Signal Pro 是一款適用於 MetaTrader 5 的趨勢跟隨指標,專為希望在圖表上獲得更清晰訊號、更有結構的交易設定,以及更實用風險管理的交易者而設計。 它不僅僅顯示一個簡單的箭頭,GEM Signal Pro 還能以更清晰、更易讀的方式呈現完整的交易思路。當條件確認完成後,指標可在圖表上顯示進場價、止損價與止盈目標,幫助交易者更有效率地評估交易設定。 運作方式 該指標首先根據其內部邏輯識別有效的初始訊號。 當確認條件滿足後,GEM Signal Pro 會在圖表上顯示完整的交易設定。這讓交易者可以更清楚地看到交易結構,並減少手動分析與計算的工作量。 圖表上的交易價位 對於已確認的訊號,GEM Signal Pro 可顯示: 進場價 止損價 止盈 1 止盈 2 止盈 3 風險報酬比 這讓交易設定更容易理解,也有助於讓圖表分析更有條理。 內建風險管理 風險管理是此指標設計的重要部分。 止損位基於近期市場結構,結合附近的擺動高低點與可選的 ATR 緩衝距離。這能讓交易價位更貼近當前市場條件,而不只是依賴固定距離。 圖表資訊面板 GEM Si
    PrimeScalping
    Temirlan Kdyrkhan
    PrimeScalping is a powerful trading companion designed to generate high-probability entry signals with dynamic TP/SL/DP levels based on volatility. Built-in performance tracking shows win/loss stats, PP1/PP2 hits, and success rates — all updated live. Key Features: Buy/Sell signals with adaptive volatility bands Real-time TP/SL/DP levels based on ATR Built-in MA Filter with optional ATR/StdDev volatility Performance stats panel (Success, Profit/Loss, PP1/PP2) Alerts via popup, sound, push, or e
    RelicusRoad Pro MT5
    Relicus LLC
    4.96 (24)
    RelicusRoad Pro: 量化市场操作系统 终身访问限时 70% 折扣 - 加入 2,000+ 交易员社区 为什么大多数交易者即使拥有“完美”指标也会失败? 因为他们在真空中交易 单一概念 。没有背景的信号是赌博。要持续获胜,您需要 共振 (CONFLUENCE) 。 RelicusRoad Pro 不是一个简单的箭头指标。它是一个完整的 量化市场生态系统 。它描绘价格运行的“公允价值之路”,区分市场噪音和真实的结构性突破。 停止猜测。开始用机构级“路”逻辑进行交易。 核心引擎:“Road” (路) 算法 系统的核心是 Road Algo ,一个实时适应市场条件的动态波动率通道。它投射出 安全线 (平衡) 和价格可能反转的 扩展水平 。 Simple Road: 典型市场的标准结构映射。 Smooth Road: 针对震荡盘整的降噪计算。 Breakout Road: 专为识别波动率扩张和爆发性走势而调整。 1. 算法动量与确认 我们的“剥头皮箭头”不只是简单的交叉。它们利用 高阶多项式逻辑 过滤噪音,确保信号与主周期一致。我们检测动量、价格行为和 Road 结构汇聚的精确入场
    Ziva LSE Pro
    Hassan Abdullah Hassan Al Balushi
    ZIVA LSE Pro: Trade the Flow, Not the Noise ZIVA LSE Pro was developed around a simple belief: professional traders do not need more random signals; they need better context. This workflow reflects the ZIVA approach to filtering market noise and focusing on the liquidity and structural mechanics that influence price behavior. Most indicators treat the market like a static picture. ZIVA LSE Pro is built to read it as a dynamic environment where liquidity, structure, volatility, and execution con
    KURAMA GOLD SIGNAL PRO(MT5)— 7层过滤 · 自动止盈止损 · 质量评分 · 信号历史保存 | 完整的XAUUSD交易系统 实时不重绘。信号出现的瞬间,箭头、入场、止盈、止损当场锁定,之后绝不移动。你交易的就是这个实时信号。而且在v7.20中,每一个真正发出的信号都会自动保存,并在重启后精确还原。 购买者专属赠品 购买永久授权,即可免费获得 AI Zone Radar(价值$59)+ 完整PDF手册。在产品价格之外,额外附赠价值$59的赠品。购买后在MQL5上给我留言即可。 AI Zone Radar: https://www.mql5.com/en/market/product/175834 在黄金交易者社区中被实际使用,因精度与易用性而广受好评。 你的难题 —— 以及解决方案 黄金一天波动$30–$50。你知道机会就在那里。但这些情况是否似曾相识: - 入场太早,价格逆行$10后才朝你的方向
    TrendMaestro5
    Stefano Frisetti
    note: this indicator is for METATRADER4, if you want the version for METATRADER5 this is the link:  https://www.mql5.com/it/market/product/108106 TRENDMAESTRO ver 2.5 TRENDMAESTRO recognizes a new TREND from the start, he never makes mistakes. The certainty of identifying a new TREND is priceless. DESCRIPTION TRENDMAESTRO identifies a new TREND in the bud, this indicator examines the volatility, volumes and momentum to identify the moment in which there is an explosion of one or more of these da
    Precision Spike Detector
    Francisco Mandomo Simbine
    5 (2)
    Precision Spike Detector V3 – Institutional-Grade AI Trading System Attention: The price increases by US$50 for every 10 purchases.  Final price: US$599 Precision Spike Detector V3   is a   state-of-the-art, institutional-grade market analysis system   for   MetaTrader 5 , designed to detect   high-probability market movements   in synthetic indices such as   Boom, Crash, GainX, and PainX . After purchase, send me a private message to receive the optimized configuration files,  the installation
    Quant Direction MT5
    Georgios Kalomoiropoulos
    Quant Direction 是一款三维市场分析工具。它通过同时计算多个维度上的精确百分比偏差,提供完全客观的、基于算法的市场分析视角。该算法采用先进的人工智能建模工具开发,并经过全面测试,旨在以独特的精准度解读市场。它可以分析您平台上的任何货币对或金融工具。 无论您是短线 交易者、日内 交易者还是波段交易者,Quant Direction 都是您的理想之选。 交易者的真正优势 Quant Direction 的真正优势在于彻底消除情绪、屏幕疲劳和过度思考。它无需手动点击十几个图表来寻找方向并反复质疑自己的偏好,引擎即可在几毫秒内即时处理 8 个时间周期(从 5 个月到月线)。它能准确告诉你任何时刻谁在掌控市场,确保你始终朝着概率最高的方向进行交易。 市场分析的三个维度 该算法将市场分为三个不同的交易维度,为您提供完整的宏观和微观视角: 超短线交易分析: 捕捉即时、快速的动量变化和较低时间框架的执行点。 日内分析: 识别真实的、潜在的每日方向性偏差。 波动分析: 专注于宏观趋势,确保您不会与大盘机构的走势背道而驰。 独家评分引擎 Quant Direction 的底层采用了一套
    TPA True Price Action indicator reveals the true price action of the market makers through 100% non-repainting signals strictly at the close of a candle! TPA shows entries and re-entries, every time the bulls are definitely stronger than the bears and vice versa. Not to confuse with red/green candles. The shift of power gets confirmed at the earliest stage and is ONE exit strategy of several. There are available now two free parts of the TPA User Guide for our customers. The first "The Basics"
    ARIPoint
    Temirlan Kdyrkhan
    1 (1)
    ARIPoint is a powerful trading companion designed to generate high-probability entry signals with dynamic TP/SL/DP levels based on volatility. Built-in performance tracking shows win/loss stats, PP1/PP2 hits, and success rates all updated live. Key Features: Buy/Sell signals with adaptive volatility bands Real-time TP/SL/DP levels based on ATR Built-in MA Filter with optional ATR/StdDev volatility Performance stats panel (Success, Profit/Loss, PP1/PP2) Alerts via popup, sound, push, or email Cu
    Connix MT5
    Garry James Goodchild
    5 (1)
    Connix SMC Scanner by G-Labs — ICT and Smart Money Concepts multi-pair dashboard for MetaTrader 5. Order blocks, fair value gaps, break of structure, change of character, VWAP, premium and discount range, and multi-timeframe scanner from one chart. Connix scans multiple symbols across configurable timeframes and shows market structure status in an interactive table while drawing the same structures on the active chart. It is an analytical toolkit — you control every setting; it does not place
    SmartScalping
    Temirlan Kdyrkhan
    SmartScalping is a powerful trading companion designed to generate high-probability entry signals with dynamic TP/SL/DP levels based on volatility. Built-in performance tracking shows win/loss stats, PP1/PP2 hits, and success rates — all updated live. Key Features: Buy/Sell signals with adaptive volatility bands Real-time TP/SL/DP levels based on ATR Built-in MA Filter with optional ATR/StdDev volatility Performance stats panel (Success, Profit/Loss, PP1/PP2) Alerts via popup, sound, push, or e
    ScalpPoint
    Temirlan Kdyrkhan
    ScalpPoint is a powerful trading companion designed to generate high-probability entry signals with dynamic TP/SL/DP levels based on volatility. Built-in performance tracking shows win/loss stats, PP1/PP2 hits, and success rates — all updated live. Key Features: Buy/Sell signals with adaptive volatility bands Real-time TP/SL/DP levels based on ATR Built-in MA Filter with optional ATR/StdDev volatility Performance stats panel (Success, Profit/Loss, PP1/PP2) Alerts via popup, sound, push, or emai
    Spike detector Green V2
    Odete Argelio Simbine
    Obrigado por adquirir o Green Spike Detector V2. Caso precise de ajuda com a instalação, ativação, atualizações ou suporte técnico, entre em contato comigo pelo WhatsApp: +258 86 756 5485. Detector de picos Verde V2 Sistema de Detecção de Picos - Versão 2 Indicador que não repinta, otimizado para mercados de alta volatilidade, como Boom, Crash e Índices de Volatilidade. Detecta movimentos de momentum fortes (picos) com baixa latência. O que mudou na versão 2: O algoritmo é 47% mais preciso que
    KT Alpha Hunter Arrows MT5
    KEENBASE SOFTWARE SOLUTIONS
    大多数箭头指标只给你一个信号,然后让你自己去判断剩下的一切。KT Alpha Hunter Arrows 为你提供完整的交易计划。 每一个信号箭头出现时,都会同时绘制一套完整计划:入场线、止损位、四个止盈目标,以及实时优势判断,告诉你当前这个交易品种和时间周期是否值得交易。随附的 Trade Manager EA 会在你手动入场后负责后续执行,让你在市场波动剧烈、情绪干扰明显时也能保持交易纪律。不重绘。仅在K线收盘后确认信号。适用于 Forex、黄金、指数以及任何你在 MT5 上交易的品种。 核心功能 不重绘买入和卖出箭头,只在K线收盘后生成。 每个信号都会显示入场线、结构性止损位和四个止盈目标。 Edge Dashboard 会分别评估当前图表上的买入和卖出机会。 判断系统包括:No Edge、Marginal、Tradeable、Good 或 Strong。 一键 Auto Optimize 按钮可根据当前品种和时间周期自动优化设置。 完整套装包含 Trade Manager EA,并提供五种专为本指标设计的预设交易管理方案。 Prop Firm Risk Panel 可在图表上
    CISD Levels Pro automatically draws CISD Buy and Sell levels directly on your chart. It highlights pending levels while they are forming, then marks confirmed levels after the confirmation candle closes. Optional confirmation arrows help you spot the signal quickly. This tool is designed for traders who want clean, simple CISD level visualization without extra indicators or clutter. Key Features Draws Bullish (BUY) CISD levels and Bearish (SELL) CISD levels Shows Pending levels (dashed) and
    TrendProMaster
    Temirlan Kdyrkhan
    MasterTrend Indicator for MT5 A powerful trend-following and signal-evaluation tool MasterTrend   is a custom MT5 indicator that combines Moving Averages and ATR-based risk/reward logic to generate clear buy/sell signals. It visualizes dynamic SL/TP levels, evaluates past trade outcomes, and displays win/loss statistics in a clean on-chart panel. Key features include: Buy/Sell signals based on MA crossovers ATR-based SL/TP1/TP2/TP3 levels with visual lines and labels Signal outcome tracking wit
    MasterTrend
    Temirlan Kdyrkhan
    MasterTrend Indicator for MT5 A powerful trend-following and signal-evaluation tool MasterTrend   is a custom MT5 indicator that combines Moving Averages and ATR-based risk/reward logic to generate clear buy/sell signals. It visualizes dynamic SL/TP levels, evaluates past trade outcomes, and displays win/loss statistics in a clean on-chart panel. Key features include: Buy/Sell signals based on MA crossovers ATR-based SL/TP1/TP2/TP3 levels with visual lines and labels Signal outcome tracking wit
    Naked Forex Tweezer Pro Indicator Tweezer Pro Indicator is a pattern recognition indicator for Forex, Stocks, Indices, Futures, Commodities and Cryptos. The standard Tweezer is a two bar pattern. Our enhanced version is a multi-bar pattern. We filter the patterns for you so that you only get the     best and most effective patterns   and ignore the noise. The Tweezer pattern is a simple and effective pattern to trade. The strategy that comes with the Tweezer is based on price action. The Twe
    Transaction Speed MT5
    Ivan Stefanov
    5 (4)
    当然,以下是翻译成中文(简体)的版本: 该指标标出市场中显现出 交易兴趣 的区域,并随后显示 订单积累区域 。它的工作方式类似于大规模的订单簿。 这是为 大资金 打造的指标,性能卓越。市场中有任何兴趣,你都能通过它清晰看到。 (这是一个 完全重写的自动化版本 —— 不再需要手动分析。) 交易速度 是一个全新的概念指标,它显示了市场上大订单 何时 、 何地 聚集,并揭示了其背后的意义。它可以在 非常早期 就检测到趋势的变化。 在外汇市场,所谓的“交易量”实际上是误导性的,因为那指的是价格在单位时间内的变化,因此真正的名称应是“交易速度”。 一切都取决于我们如何思考、如何行动、如何分析。 改变分析范式至关重要。 该指标完全重构了外汇市场上“交易量”的概念,用逻辑方式重新定义并应用,从而成为一个 独特而精准的工具 。 使用方法: 默认情况下,指标处于 自动模式 ,可独立用于任何时间周期。如果你希望切换到手动模式,只需点击 Auto / Manual Mode 按钮即可。 在 手动模式 下,所有计算从 2025年1月1日 开始。你可以根据需要更改该日期,以查看不同的分析结果。 最优数据周期
    Ziva LSE System
    Hassan Abdullah Hassan Al Balushi
    ZIVA LSE System A Professional Liquidity & Structure Execution Framework Executive Overview ZIVA LSE System is a professionally engineered analytical framework designed to interpret market behavior through structural logic and liquidity dynamics. It is not positioned as a conventional indicator. Rather, it functions as a structured execution environment that organizes price action into a clear, disciplined decision-making model. The system is built to deliver consistency, clarity, and controlled
    AriX
    Temirlan Kdyrkhan
    1 (4)
    AriX Indicator for MT5 A powerful trend-following and signal-evaluation tool AriX is a custom MT5 indicator that combines Moving Averages and ATR-based risk/reward logic to generate clear buy/sell signals. It visualizes dynamic SL/TP levels, evaluates past trade outcomes, and displays win/loss statistics in a clean on-chart panel. Key features include: Buy/Sell signals based on MA crossovers ATR-based SL/TP1/TP2/TP3 levels with visual lines and labels Signal outcome tracking with real-time stat
    MetaTrader 5 智能多层突破与回调探测器 "智能 · 简单 · 快速!" 您是否厌倦了错过高概率的突破入场机会? 您是否花费数小时扫描多张图表,试图将突破与趋势方向和货币动能对齐——却仍然错过了行情? Break Pullback 用一个指标解决所有这些问题。 什么是 Break Pullback? Break Pullback 是一款专业级 MetaTrader 5 指标,专为交易市场结构、突破和趋势延续形态的交易者而设计。 它能实时自动检测多个货币对的突破与回调形态——并通过三层确认过滤每个信号: 结构突破检测——识别图表上的关键突破位 高时间框架日线偏向——将入场与主导日线趋势方向对齐 货币强弱指数——确认配对货币间的动能失衡 结果:更少的虚假信号,更强的信心,更快的执行——无需面对图表过载。 适合哪些交易者? Break Pullback 专为使用以下方法的交易者设计: 突破与回测策略 市场结构分析(BOS、 OB Order Block 、结构位) 聪明钱概念(SMC)或 ICT 风格入场 趋势跟踪与延续形态 跨外汇和黄金(XAUUSD)的多对扫描 日内和波段
    作者的更多信息
    Elliott Wave ABC
    Enrique Gauto Sand
    Elliott Wave ABC  Overview Elliott Wave ABC is an interactive indicator designed for MetaTrader 5 (MT5) that automates the detection, scoring, and visualization of Elliott Wave Zig-Zag (A-B-C) structures. It scans chart data to locate both completed and incomplete Zig-Zag patterns, offering structural analysis, Fibonacci projection targets, and a stacked dual-panel user interface. --- Key Features 1. Automated Zig-Zag Detection & Decomposition - Scans historical chart bars for Patterns dete
    FREE
    The Liquidation Zones Heatmap is a custom technical indicator designed for the MetaTrader 4 (MT4) platform. It calculates and visualizes estimated liquidation zones based on price action and internal algorithms, displaying them as a dynamic heatmap on the chart. These zones are known by several names, sometimes referred to as liquidity pools, liquidity levels, leverage levels, liquidation heatmap levels, leverage heatmap zones, or leverage heatmap levels. These zones represent potential areas of
    The Smart Liquidation Clusters  is a custom technical indicator designed for the MetaTrader 4 (MT4) platform. It calculates and visualizes   estimated liquidation zones   based on price action and internal algorithms, displaying them as a dynamic heatmap on the chart. These zones are known by several names, sometimes referred to as liquidity pools, liquidity levels, leverage levels, liquidation heatmap levels, leverage heatmap zones, or leverage heatmap levels. These zones represent   potential
    Auto Elliott Engine
    Enrique Gauto Sand
    Auto Elliott Engine The Auto Elliott Engine is a tool designed for MetaTrader 4 that automates the identification, decomposition, and projection of price structures based on the Elliott Wave Theory. Powered by a pattern-recognition engine, this indicator processes price action to identify market configurations, translating data into structured scenarios. Key Features Multi-Degree Recognition: Analyzes price action across multiple fractal levels. From higher degrees, such as Supercycle or Cycle,
    SMC Framework Pro
    Enrique Gauto Sand
    SMC Framework Pro is a technical analysis indicator developed for the MetaTrader 5 platform. It integrates multiple tools commonly associated with Smart Money Concepts (SMC) into a single environment, focusing on the visualization of price action, market structure, and selected price patterns. The indicator processes historical and incoming price data to identify structural points, price imbalances, and recurring formations. Its purpose is to assist in chart analysis by organizing this informati
    SMC Pattern Detector
    Enrique Gauto Sand
    SMC Pattern Detector (SMC形态检测器) 是一款基于聪明钱概念(Smart Money Concepts, SMC)的技术分析工具。该指标自动识别市场结构、供需区域以及 SMC 形态。基于无重绘(No-Repaint)架构开发,所有信号均在 K 线收盘时确认。 我们坚信 100% 的透明度。不要仅仅依赖屏幕截图;请观察该指标如何应对实时市场状况。查看我们录制的实时直播,亲眼见证剥头皮交易(Scalping)设置和信号的实时发生。 在这里观看直播: https://www.youtube.com/@toolsforscalping/streams 核心 SMC 基础 (CORE SMC FOUNDATIONS) BOS / CHoCH 检测: 追踪结构破位(Break of Structure)和特性改变(Change of Character)以识别趋势转换。 订单块 (OB): 识别供需区域并追踪其缓解(mitigation)状态。 公允价值缺口 (FVG) 与 IFVG: 检测流动性失衡及其反转(反转 FVG)。 流动性映射: 标记买方 (BSL) 和卖
    Gold Liquidation Momentum is a premium, volume and momentum indicator specifically optimized for Gold (XAUUSD) , Forex, and major Indices. It analyzes price-action dynamics and tick volume to model hypothetically the momentum of different market participants and visualizes hypothetically  buyer/seller dominance in real-time. How It Works The indicator tracks market volume across 5 distinct leverage tiers (100x, 50x, 35x, 25x, and 10x). Using an advanced mathematical decay formula tailored for no
    筛选:
    无评论
    回复评论