Trade Area

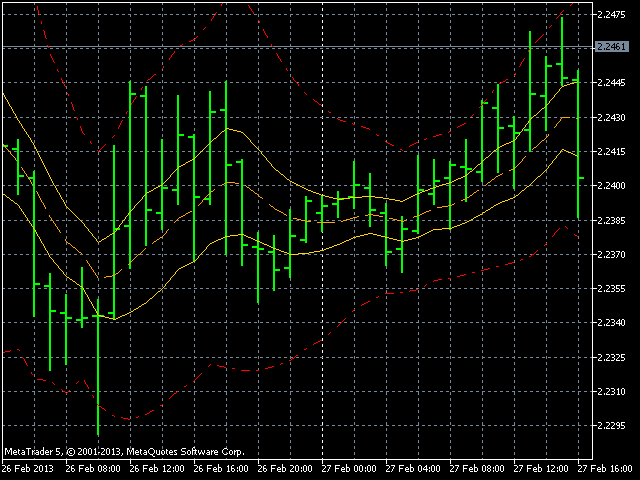
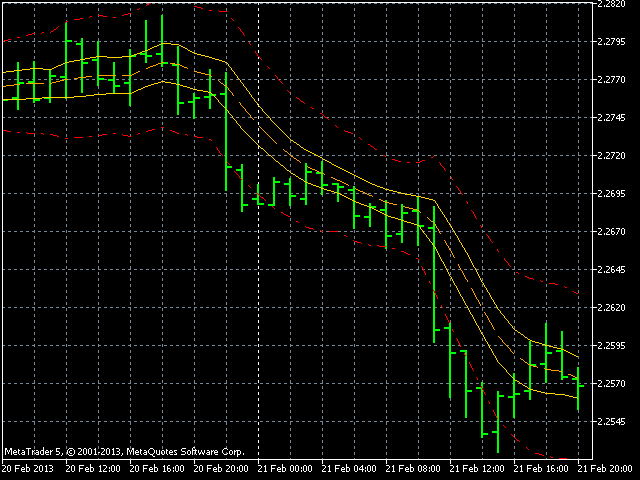
Most time the market is in a small oscillation amplitude. The Trade Area indicator helps users to recognize that time.

There are 5 lines in this indicator: Area_high, Area_middle, Area_Low, SL_high and SL_low.

Recommendations:

  • When price is between Area_high and Area_Low, it's time to trade.
  • Buy at Area_Low level and sell at Area_high level. The SL_high and SL_low lines are the levels for Stop Loss.
  • Change the Deviations parameter to adjust SL_high and SL_low.
推荐产品
Day Trade System
Nardus Van Staden
5 (1)
Introducing The Day Trader System: Your Shortcut to Day Trading Success! Are you a day trader seeking simplicity without compromising profitability? Look no further! We present The Day Trader System – your go-to solution for identifying lucrative opportunities in the fast-paced world of Forex. Simple Yet Powerful: The Day Trader System is a straightforward yet highly effective indicator designed exclusively for day traders. Say goodbye to complexity and hello to a system that simplifies
FREE
G FiboTrend
Lee Teik Hong
G-FiboTrend — Indicator Description G-FiboTrend is a trend-channel indicator for MetaTrader 5 that plots dynamic Fibonacci-based price zones over a rolling lookback period. How It Works The indicator scans a user-defined number of bars ( FiboPeriod ) to identify the highest high (HH) and lowest low (LL) within that window. From this range, it derives three key levels: Upper Band — Fibonacci level (default 61.8%) Mid Band — 50.0% midpoint Lower Band — Fibonacci level (default 38.2%) These levels
# SSL ST Strategy MT5 Indicator - Chinese (Simplified) Version SSL ST Strategy MT5指标是一个技术分析工具,旨在帮助交易者在交易图表上清晰地识别买卖信号。它提供视觉指标(如线条和箭头),以及声音、弹出和推送通知,在出现交易机会时及时提醒交易者。 ## 主要优势 - 在图表上直接提供清晰的视觉信号,使用彩色线条(SSL1和基线)和箭头表示买入(绿色三角形)和卖出(红色三角形)信号。 - 支持声音警报、弹出警报和移动推送通知,确保交易者即使不在屏幕前也不会错过重要信号。 - 允许反转信号逻辑,使其适应不同的交易策略或市场条件。 - 使用基于高点、低点和收盘价的指数移动平均线(EMA)以获得更响应和平滑的信号生成。 - 内置过滤功能可防止同一信号柱的重复警报,减少噪音和警报疲劳。 ## 输入参数 - **len**: 设置SSL1和基线EMA计算的周期长度(默认60)。 - **show_Baseline**: 选择在图表上显示或隐藏基线EMA线。 - **show_SSL1**: 选择在图表上显示或
FREE
Breakeven Line V2
Hoai Phuong Tran
Breakeven Line v2 Indicator   is a MetaTrader indicator that calculates breakeven level based on all open positions and displays it on your chart as a horizontal line. Additionally, it will calculate the total number trades, the total number of lots, and the distance to the breakeven line in points and profit/loss. The indicator is available for MetaTrader 5 . Why use Breakeven Line Indicator? When you have multiple trades opened on a single symbol, it can be difficult to tell where your averag
- This is an indicator of directional movement that allows you to determine the trend at the time of its inception and set the levels of a protective stop. Trailing can be carried out both from below, when the stop level is below the current price and is pulled up behind the price if it increases, and above, when stop levels are above the current price. Unlike trailing with a constant distance, the stop level is set at the lower boundary of the quadratic regression channel (in the case of tra
News Clock
Victor Klenov
The professional browser of News and Trading Sessions is now available in MetaTrader 5. Now all the most important market information is collected on one dial! News located on the Time scale. Planning your working time has never been so easy and convenient ... The news scale can be switched a day, two, a week, a month forward or backward (see the details in the short video). All news updates in real time. Thanks to the built-in filters, you can configure the display of news by importance, cou
MA7 Aster MT5
Andrey Minaev
Description of work The MA7 Aster indicator is based on the standard Moving Average indicator. Shows the price deviation from the moving average. Detailed information about the MA7 Aster indicator. Indicator settings General settings: Period ; Method ; Apply to ; Minimum distance – minimum distance from the moving average to the closing price of the candle. Message settings: Send message to the terminal (Alert) – permission to send messages to the terminal using the Alert function; Send messag
https://c.mql5.com/31/761/best-trend-indicator-logo-200x200-8493.png 该指标用一条红绿相见的实线来反映市场价格的万千变化。 绿线表明市场价格处于上 升期间 , 红线表明市场价格处于下跌期间。 实线颜色 的改变预示着市场已经发生变化行情极有可能会出现逆转!   建议您在日K线图上使用该指标。该指标不适合您做超短线交易! 众所周知,趋势线是技术分析家们用来绘制的某一证券 (股票) 或商品期货过去价格走势的线。目的是用来预测未来的价格变化。这条 趋势 线是通过联结某一特定时期内证券或商品期货上升或下跌的最高或最低价格点而形成的。它可以预测该证券或商品期货是处于上升的趋势还是处于下跌的趋势。但是,您一定要认识到每一个指标都有是有缺陷的,这个世界上没有任何一个指标可以精准的预测到市场未来的发展方向。因此,我建议您在使用这个指标的时候结合其他的技术分指标,以此获得更好 的 效果 。
Overview The Williams VIX Fix Indicator is a MetaTrader 5 tool designed to help traders identify potential market tops and bottoms. By analyzing price extremes relative to recent highs and lows, it highlights overbought and oversold conditions using two histograms displayed in a separate window. The indicator combines the Williams VIX Fix calculation with Bollinger Bands and percentile-based thresholds to provide clear signals for potential reversals.  Key Features Market Tops and Bottoms Market
ClearArrows MT5
Pavel Krysanov
For any trader, the result of market analysis is the correct determination of entry and exit points from the market. The ClearArrows indicator does not display any unnecessary information that may distract or mislead the trader, but only the most important thing. The indicator is very easy to use, when a down arrow appears, you need to open a SELL deal, when an up arrow appears you need to open a BUY deal. The ClearArrows indicator, despite its outward simplicity, has a large analytical algori
This indicator is a visual combination of 2 classical indicators: Bears and MACD. Usage of this indicator  could be the same as both classical indicators separately or combine.  Input parameters: input int BearsPeriod = 9;  input ENUM_MA_METHOD maMethod = MODE_SMA; input ENUM_APPLIED_PRICE maPrice = PRICE_CLOSE; input int SignalPeriod = 5.
The third indicator from the set for market analysis. The first one is here:  https://www.mql5.com/ru/market/product/65258 The second one is here: https://www.mql5.com/ru/market/product/65347 The indicator builds a channel of maximum price fluctuations for a specified period. Additionally, the middle of the channel is drawn. All color settings, line types are customizable. The indicator allows you to see the picture of price movement from a slightly different angle. You can use several indic
TheStrat Candles MT5
Robert Gerald Wood
This indicator will draw a label above or below each candle based on   Rob Smith's   The Strat   as they develop over time on your chart. As price evolves, a candle can switch between three states. When the candle first opens, if it sits completely within the previous candles high and low, then it will start as a Type 1. As time moves on, if it breaks either the high or low of the previous candle, it will be come a type 2, and should the price action be volatile and directionless, it may then
Mega Dashboard
Paul Anscombe
5 (4)
The Ultimate Dashboard New Year Sale - save $20   (normal price $79) Indicators are useful for traders, but when you put them into a dashboard that can scan 28 symbols at once they become even better, and when you can also combine different indicators and timeframes to give you synchronized alerts, then they become awesome. This easy to use dashboard provides you with 32 leading indicators, use them individually or together, to create powerful combination alerts. So when you want to know that RS
The Linear Regression Channel is a powerful technical analysis tool that helps visually identify the prevailing trend and potential price zones. Essentially, the indicator performs two main functions: It draws a trendline through the center of price action over a specified period. This line is calculated using the linear regression method, which results in the best possible "line of best fit" for the price data. From this center line, the indicator plots two parallel lines above and below, creat
FREE
Ultimate Double Top & Bottom (Pro Volume Matrix) Stop trading retail breakouts. Start trading Institutional Traps. The   Ultimate Double Top & Bottom   is not a standard, lagging pattern scanner. It is a highly advanced, non-repainting structural engine equipped with a proprietary   3-Leg Volume Matrix . Designed exclusively for Smart Money Concepts (SMC) and order flow traders, this indicator mathematically dissects the tick volume inside M and W patterns to reveal true institutional intent:  
IVolX 2 DPOC mt5
Denis Chebatarev
Vol2DPOC volume vol2DOC-任何时间段的动态水平音量指indicator 指标的主要设置: 交易量来源-为交易量选择数据(tick或real) DPOCOn-启用/禁用指标 DPOCFrom-计算开始日期 DPOCTo-结算结束日期 该指标允许您手动选择图表上的区域,以分析最大交易量随时间的变化。 您可以通过使用垂直线并沿图表移动它们来执行此操作。 或者通过在指标设置中设置特定日期。 这是一个非常有用的指标,以更精确地确定价格何时离开修正并恢复趋势运动。 该指标显示3个缓冲区,以便指标可以连接到ea交易。 该指标与水平交易量指标IVolX和其他趋势工具一起,将帮助您显着增加有利可图的交易数量,并将您的交易提升到一个全新的水平!
Quickview
Guilherme Emiliao Ferreira
Quickview The Quickview indicator instantly highlights asset variations, delivering crystal-clear market insights at a glance. Effortlessly track multiple assets with visual simplicity, enabling quicker, smarter, and more confident trading decisions daily. ️ Key Features Real-Time Asset Tracking: Instantly monitor multiple assets simultaneously, never missing a critical market move. Flexible and Intuitive Display: Personalize your view, displaying assets exactly as you want—clear, concise, c
FREE
TMA Centered Bands Indicator
Irina Cherkashina
5 (1)
The TMA Centered Bands Indicator for MT5 draws bands on the chart and shows the overall price trend. It displays three bands - the lower and upper boundaries of the channel and the median.   The bands are made up of moving averages, and each of them has an MA period. The name TMA comes from triangular moving averages, as the indicator draws triangular bands.   The price will fluctuate between these ranges whenever the trend changes direction, thus creating entry and exit points.   How to trade
FREE
This easy to setup indicator shows you the market volumes in a different way, with support and resistance as showed. You can setup: - Backdays volume to show - Heiken Ashi candle view It works for every kind of graph and every kind of period. The program shows the volumes based on the number of candles displayed in the chart: the more candles the more volumes. Enjoy this very useful indicator. Please feel free to message me to report any kind of improvements! :D
Veltrion Smart Fibonacci   is a clean automatic Fibonacci structure overlay for MetaTrader 5. It automatically detects recent swing highs and swing lows, then draws key Fibonacci retracement levels directly on the chart. The indicator is designed to help traders visualize market structure, retracement zones, and the golden zone without manually drawing Fibonacci tools. Key Features Automatic swing high and swing low detection Clean Fibonacci retracement overlay Horizontal Fibonacci levels for a
Crystal Quantum Flow
Muhammad Jawad Shabir
4.83 (6)
Crystal Quantum Flow 高级市场智能分析指标 Crystal Quantum Flow 是一款新一代专业交易指标,专为追求清晰度、精准度和机构级市场洞察的交易者而设计。 该指标被构建为完整的决策支持系统,将多维度市场流分析、多时间周期同步以及高级可视化解释整合到一个强大的图表环境中。 Crystal Quantum Flow 的内部架构完全专有并受到保护。 所有分析模型均作为封闭系统运行,并非基于常见的零售指标或公开公式。 核心理念 Crystal Quantum Flow 将市场行为解读为持续的压力、动量和方向主导流,而不是孤立的价格波动。 它不会对市场噪音做出反应,而是专注于已确认的市场状态和转换,帮助交易者始终与主导力量保持一致。 所有信号仅基于已确认的价格数据生成。 不存在重绘行为。 主要功能 非重绘信号引擎 所有买入和卖出信号仅在蜡烛收盘后确认 历史信号保持固定不变 适用于回测、前向测试和实盘交易的一致性 量子流蜡烛 高级蜡烛显示模式,增强趋势清晰度 可在专有蜡烛和标准蜡烛之间切换 用于过滤市场噪音并突出真实方向 智能趋势流线 根据市场条件自适应变
FREE
CandelTimer MT5
Kambiz Shahriarynasab
300 downloads without review ? !!!! If continued. I will not share any product for free. :( Small and very simple timer next to the current price to show the end time of the current candle Very useful and important for scalpers and those who work on price action.   We assure you that we welcome any suggestions to improve this indicator and make the necessary changes to improve this indicator. You can contact us via Instagram, Telegram, WhatsApp, email or here. We are ready to answer you.
First Dawn MT5
Innovicient Limited
The First Dawn indicator uses a unique mechanism to search and plot signals. This keeps searching for signals, making it a great indicator for scaping and identification of changes in direction, swing trading and trend trading. The    First Dawn     helps you get early signals. The backtest gives the true picture of how the indicator works with real/demo accounts. Although this is a tiny indicator it is packed with advantageous settings that will help you whether you desire to: Snap the Peaks a
The indicator is designed to close positions on the market in time. For example: to take profits ahead of schedule if the price has not reached TakeProfit, and the market is turning around. The indicator analyzes the momentum, not the trend. He does not give any information about the trend. The indicator is well suited for finding divergence. The Ershov 38 Parrots indicator dynamically adjusts to the market and detects price movement impulses of medium and high amplitude. It almost does not rea
TDI MTF: Comprehensive Market Sentiment & Trend Framework The TDI MTF  is a multi-layered (captures Trend, Channels, Oscillates, levels, multi-timeframe) technical indicator designed to provide a clear view of market structure. By combining RSI momentum with volatility analysis, it helps traders identify where price is relative to its "mean" and whether current momentum is sustainable. This tool is good for traders who want an  all-in-one separate window to filter out market noise and focus on h
FREE
Why the RSI Alert Indicator is Essential for Your Trading Toolkit In the fast-paced world of trading, timely and accurate information is crucial. The RSI Alert Indicator is a powerful tool designed to help you stay ahead of the market by providing real-time alerts when the Relative Strength Index (RSI) reaches critical levels. Whether you're a novice trader or a seasoned professional, this indicator can significantly enhance your trading strategy by pinpointing potential market reversals with
Over Trend MT5
Mansour Babasafary
Trend based indicator Identify trends with this indicator A simple-to-use trend indicator No complicated settings Attributes: Can be used in all symbols Can be used in all time frames Relatively high signals No complicated settings Specific to the trend Lifetime support Settings: Alarm Show Alert: By activating these settings, after receiving the signal, you will receive an alarm in Metatrader Alarm Show Notification: By activating these settings, after receiving the signal, you will receive a
Orderflow Super Candles - 简约足迹图指标 平台: MetaTrader 5 (MT5)  (最后一张截图是结合DOM工具配套使用的情况) 1. 产品简介 Orderflow Super Candles 是一款基于底层 Tick 数据分析的专业图表工具,旨在为交易者提供“市场X光”般的深度视角。 通过解析每一根 K 线内部的买卖成交量分布,该指标将隐蔽的市场微观结构可视化。它能帮助交易者透过价格表象,看清机构资金的真实博弈位置,精准识别支撑与阻力位的有效性,从而做出更具逻辑性的交易决策。 2. 核心功能 双重透视模式 买卖量分布 (Buy/Sell Volume): 经典足迹图模式。左侧显示主动卖单,右侧显示主动买单。直观对比每一价格档位的多空力量差异。 净买卖差模式 (Delta Profile): 显示每一价格档位的“买单减去卖单”的净值。绿色代表买方主导,红色代表卖方主导。 自适应缩放技术: 在 Delta 模式下,指标会自动计算当前视野范围内的 Delta 最大绝对值进行动态归一化,确保无论市场波动大小,色块显示都清晰可见。 关键价位自动标注 POC
Trande Candle
Alexandr Saprykin
趋势蜡烛图——即时趋势解读指标 趋势蜡烛图指标会自动为图表蜡烛图着色,将复杂的分析转化为直观易懂的图像。它能即时判断市场强弱和方向:绿色代表上升趋势,红色代表下降趋势,灰色代表中性阶段。该工具基于两个自适应滤波器的同步,提供清晰的信号,避免不必要的干扰。 主要优势 即时趋势可视化:市场方向一目了然。 不重绘算法:信号固定在蜡烛图收盘时,未来不会改变,确保对历史数据进行真实分析,从而实现可靠的交易。 双重信号过滤:快速和慢速滤波器协同工作,过滤掉虚假信号,突出高质量的趋势信号。 全方位警报:可通过弹出窗口、推送通知到您的移动终端、电子邮件或声音警报接收趋势反转通知。 通用性:该指标适用于所有金融工具和时间周期。 趋势蜡烛图指标的目标用户是谁? 适用于重视速度和决策便捷性的交易者。 适用于希望快速学习如何识别趋势的初学者。 适用于寻求可靠过滤器以验证交易策略的经验丰富的交易者。 时间框架建议 为了在反应速度和信号可靠性之间取得最佳平衡,我们建议使用 H1 或更高的时间框架。在这些时间框架下,该指标能够最有效地过滤市场噪音,并准确识别稳定的趋势走势。 如何开始使
该产品的买家也购买
Neuro Poseidon MT5
Daria Rezueva
4.96 (28)
Neuro Poseidon is a new indicator by Daria Rezueva. It combines precise trading signals with adaptive TP/SL levels - creating best possible trades as a result! Message me and get  Neuro Poseidon Assistant  as a gift to automize your trading process! What makes it stand out? 1. Proven profitability on all assets and timeframes 2. Only confirmed BUY and SELL signals present on the chart 3. Adaptive TP & SL levels generated by the software for each trade 4. Easy to understand - suitable for al
SuperScalp Pro
Van Minh Nguyen
4.65 (26)
SuperScalp Pro – 高级多重过滤剥头皮指标系统 SuperScalp Pro 是一款高级剥头皮交易指标,将经典 Supertrend 与多种智能确认过滤器结合,帮助识别交易机会。它可高效运行于 M1 至 H4 多个时间周期,并针对 XAUUSD、BTCUSD 及主要外汇货币对进行了优化。 该指标提供清晰的 Buy 和 Sell 信号,并基于 ATR 自动计算入场价、止损和止盈水平,帮助交易者更有效地管理风险。Fibonacci Take Profit 功能可在关键价格水平提前平仓,并在到达这些水平时发送通知,从而提升交易管理效率与稳定性。 默认配置已启用 Fibonacci Take Profit,专注于更稳定、更持续的交易体验。您只需将指标加载到图表即可立即开始使用,无需额外设置。对于高级用户,所有参数均可完全自定义,以适应不同交易策略和偏好。 完整使用文档可在产品博客查看: [User Guide] 支持通过 SuperScalp Pro Auto Trader EA 进行自动交易: [Auto Trader] SuperScalp Pro 集成了 EMA、RSI
Divergence Bomber
Ihor Otkydach
4.9 (90)
购买该指标的每位用户将额外免费获得以下内容: 原创工具“Bomber Utility”,该工具会自动跟踪每一笔交易,设置止损和止盈点,并根据策略规则自动平仓; 适用于不同交易品种的指标设置文件(Set 文件); 三种不同风险模式下的 Bomber Utility 设置文件:“最低风险”、“平衡风险” 和 “观望策略”; 一套详细的 视频操作手册,帮助您快速完成安装、配置并开始使用本交易系统。 注意: 要获取以上所有赠品,请通过 MQL5 的私人消息系统联系卖家。 我为您介绍原创的自定义指标 “Divergence Bomber”(背离轰炸机),它是一套基于 MACD 背离交易策略 的“全功能”交易系统。 该技术指标的主要任务是识别 价格与 MACD 指标之间的背离,并发出交易信号(包括推送通知),指示未来价格可能的运动方向。平均而言,这些信号的准确率超过 98%。有关该指标如何工作的详细说明,请观看本页面上的视频演示。 该系统使用 止损订单 和 动态回撤平仓机制 来管理交易。 Divergence Bomber 指标的主要特点: 支持交易的品种: AUDCAD、AUDCHF、AUDSG
SMC Intraday Formula
Kareem Abbas
5 (15)
让我们先坦诚一点。 没有任何一个指标可以单独让你实现盈利。如果有人告诉你可以,那他是在向你兜售一个梦想。任何显示完美买卖箭头的指标都可以被做得看起来毫无瑕疵——只需要放大历史中的某一段并截取成功交易的截图。我们不会这样做。 SMC Intraday Formula 是一个工具。 它为你读取市场结构,标记出概率最高的价格区域,并用简单直白的语言准确告诉你当前智能资金的行为轨迹。你仍然需要做决定。你仍然需要执行交易。但现在,你是带着精确性执行,而不是靠希望。 我们已经在黄金(XAUUSD)以及主要外汇货币对的日内剥头皮交易中使用该指标将近三年。这是我们在 M1、M5、M15 和 M30 上的日常主力工具。它之所以有效,是因为它不试图预测未来——它展示的是当前正在形成的高概率交易机会,并解释 为什么 。 它与其他所有指标有什么不同? 大多数交易指标只做一件事。移动平均线交叉。振荡指标触及某个水平。出现一个箭头。你进场交易。你亏损。你责怪指标。重复。 SMC Intraday Formula 将多个机构级概念整合为一个统一的市场解读: - 斐波那契共振引擎 不只是普通的斐波那契水平——该指标
Entry In The Zone and SMC Multi Timeframe is a real-time 2-in-1 market analysis tool that combines market structure analysis and a No Repaint BUY / SELL signal system into a single indicator, built on Smart Money Concepts (SMC) — a widely adopted framework used by professional traders to understand market structure. This indicator helps you see the market more clearly, make decisions based on structure rather than guesswork, and focus on high-probability zones where price is more likely to react
本产品已针对 2026 年市场进行更新,并针对最新 MT5 版本进行了优化。 价格更新通知: Smart Trend Trading System 目前价格为 $99 。 接下来的 30 次购买 后,价格将上涨至 $199 。 特别优惠: 购买 Smart Trend Trading System 后,请发送私信给我,即可免费领取 Smart Universal EA ,并将您的 Smart Trend 信号转换为自动交易。 Smart Trend Trading System 是一套完整的交易系统,具备不重绘、不回绘、不延迟的特点,专为希望获得更清晰信号、更准确趋势方向以及更有组织交易方式的交易者打造。 Online course , manual and download presets . 它将 10 多种交易工具 整合到一个系统中,包括趋势检测、反转区域、Smart Cloud、移动止损逻辑、支撑与阻力、K线着色、提醒以及多周期分析。 该系统旨在帮助您应对不同的市场环境: 趋势市场: 识别主要趋势,发现回调,跟随动能,并通过止损指导和移动止损选项寻找更清晰的入场机会。 震荡
Quantum TrendPulse
Bogdan Ion Puscasu
5 (25)
介绍 Quantum TrendPulse   ,这是一款终极交易工具,它将 SuperTrend   、   RSI 和 Stochastic 的强大功能整合到一个综合指标中,以最大限度地发挥您的交易潜力。该指标专为追求精准和效率的交易者而设计,可帮助您自信地识别市场趋势、动量变化以及最佳进入和退出点。 主要特点: 超级趋势整合: 轻松跟随当前的市场趋势并乘上盈利浪潮。 RSI 精度: 检测超买和超卖水平,非常适合把握市场逆转时机,可用作 SuperTrend 的过滤器 随机精度: 利用随机振荡在波动的市场中寻找隐藏的机会, 用作超级趋势的过滤器 多时间范围分析: 从 M5 到 H1 或 H4,在不同时间范围内关注市场动态。 可定制的警报: 当您的自定义交易条件得到满足时收到通知,这样您就不会错过任何交易。 无论您是新手还是经验丰富的交易员,   Quantum TrendPulse 都能为您提供所需的优势,帮助您增强策略并自信地进行交易。借助这一强大的指标,将洞察力转化为利润 — 掌控您的交易! ***购买 Quantum TrendPulse,即可免费获得 Quantum Tr
SignalTech MT5
Yue Wang
5 (26)
SignalTech is an unique fully rule based trading system delivers an Institutional approach for both Independent Traders and Prop Firm Challengers. Never Repaint. Push Notification available. No over-optimization. All the winning trades with chart setups are published on the comments page. 2026-05 4107 Pips (Until 05-29 NY Closed) 2026-04 2243 Pips 2026-03 2165 Pips 2026-02 2937 Pips 2026-01 2624 Pips 2025-12 1174 Pips It can generate signals with Buy/Sell Arrows, Push Notification (To Mobile) an
Power Candles MT5
Daniel Stein
5 (8)
Power Candles V3 - 自我优化的强度指标 Power Candles V3 把货币与品种的强度直接转化为图表上可执行的交易方案。指标不再仅根据强度给K线着色,而是在后台持续运行实时自动优化,为您正面对的品种给出最佳 Stop Loss、Take Profit 与信号阈值。一键采用,Entry、Stop Loss、Take Profit 线就以精确价格绘制在图表上,提醒消息中直接包含方向。 本工具是 Stein Investments 生态系统的一部分 - 18+ 款工具,加上 Max,您的一对一 AI 交易导师。  随时在线,深入了解每一款指标,在您需要梳理思路的那一刻就在那里。  立即认识他: https://stein.investments 每根收盘K线运行 3,000+ 次交易模拟。9 种强度状态。2 种策略并行测试。一键采用最优配置。 为什么需要这个 大多数强度指标只给您一个数值,然后留下三个问题:相信哪个阈值、用哪个 Stop Loss、走哪个交易方向。Power Candles V3 在每根收盘K线上自动回答这些问题。结果就是一个完整的交易方案 -
PrimeScalping
Temirlan Kdyrkhan
PrimeScalping is a powerful trading companion designed to generate high-probability entry signals with dynamic TP/SL/DP levels based on volatility. Built-in performance tracking shows win/loss stats, PP1/PP2 hits, and success rates — all updated live. Key Features: Buy/Sell signals with adaptive volatility bands Real-time TP/SL/DP levels based on ATR Built-in MA Filter with optional ATR/StdDev volatility Performance stats panel (Success, Profit/Loss, PP1/PP2) Alerts via popup, sound, push, or e
M1 Quantum MT5
Hamed Dehgani
5 (1)
M1 Quantum 是一款专业的 M1 交易系统,提供快速且精准的交易信号,并内置止损(Stop Loss)、止盈(Take Profit)以及智能资金管理功能。 M1 Quantum 包含专业的资金管理系统,通过专注于 连续盈利交易 ,帮助交易者更快地增长账户资金。 M1 Quantum 指标 的主要特点 专为 M1 时间周期 和所有 主要货币对 设计 所有交易均配备止损和止盈 内置 资金管理功能 ,并指导交易者轻松执行交易计划 高胜率,高比例的 连续盈利交易 无重绘,无延迟 适合各种类型的交易者,简单易懂 要使用 M1 Quantum ,您需要 M1 Quantum Assistant 。这款强大的工具对所有 M1 Quantum 用户 免费提供 。 下载 M1 Quantum Assistant 加入我的 MQL5 频道 ,获取最新更新和新产品发布信息。 价格将在下周上涨至149美元。
Trend Catcher ind mt5
Ramil Minniakhmetov
5 (5)
趨勢捕捉指標 趨勢捕捉指標結合了作者獨有的客製化自適應趨勢分析指標,用於分析市場價格趨勢。它透過過濾掉短期噪音,並專注於潛在的動能強度、波動性擴張和價格結構行為,來識別真實的市場方向。此外,它還結合了平滑和趨勢過濾等客製化指標,例如移動平均線、相對強弱指標 (RSI) 和波動率過濾器。 您可以在這裡查看實際運行情況以及我的其他產品: https://www.mql5.com/en/users/mechanic/seller 請注意,我不會在 Telegram 上出售 EA 或任何設置,那是騙局。所有設定都可以在我的部落格上免費取得。 重要提示!購買後請立即聯繫我,以獲取使用說明和額外獎勵! 請注意,我不會在 Telegram 上出售 EA 或任何設置,那是騙局。所有設定都可以在我的部落格上免費取得。
介绍     Quantum Breakout PRO   ,突破性的 MQL5 指标,正在改变您交易突破区域的方式!由拥有超过13年交易经验的资深交易员团队开发,     量子突破 PRO     旨在通过其创新和动态的突破区域策略将您的交易之旅推向新的高度。 量子突破指标将为您提供带有 5 个利润目标区域的突破区域的信号箭头,以及基于突破框的止损建议。 它既适合新手交易者,也适合专业交易者。 量子 EA 通道:       点击这里 重要的!购买后请私信我领取安装手册。 建议: 时间范围:M15 货币对:GBPJPY、EURJPY、USDJPY、NZDUSD、XAUUSD 账户类型:ECN、Raw 或 Razor,点差极低 经纪商时间:GMT +3 经纪商:IC Markets、Pepperstone with Raw 和 Razor 的点差最低 规格: 不重漆! 最多 5 个建议利润目标区域 建议止损水平 可定制的盒子。您可以设置自己的 Box Time Start 和 Box Time End。 接触 如果您有任何疑问或需要帮助,请通过私人消息与我联系。
GoldenX Entry MT5
Kareem Abbas
5 (10)
GoldenX Entry 是一款用于 MT5 的指标,包含自适应 Smart Entry Trend 算法、信号评分系统、市场状态识别器以及波动率过滤器。每个信号都包含计算得出的入场位、三个止盈位(TP1、TP2、TP3)以及止损位。它基于多个分析层构建,旨在适应不同市场条件,将多层分析系统与内置优化器及统计跟踪系统相结合。该指标基于风险收益比(RR)指标和历史交易行为提供量化分析。 开始使用非常简单——在所选时间周期上运行优化器,然后在图表上开始使用该指标。 核心功能 GoldenX Entry 将信号引擎与内置交易管理及历史统计跟踪整合在同一图表中: - 内置优化器: 优化器可在图表上单击运行。它通过两阶段搜索流程测试200种参数组合——先进行探索,再进行优化——并在完成后自动应用选定配置。结果会按时间周期缓存,因此当返回已优化的周期时,会立即恢复相同设置。 - 黄金品种自动周期识别: 将指标加载到任何 XAUUSD 图表(M1 到月线)。系统会自动识别当前周期并加载对应预设。共包含9个时间周期配置文件,专为黄金在标准周期上优化设计。切换周期时,参数会自动调整。 - 资金参考面
Gann Made Easy MT5
Oleg Rodin
5 (6)
Gann Made Easy   是一个专业且易于使用的外汇交易系统,它基于使用先生理论的最佳交易原则。 W.D.江恩。该指标提供准确的买入和卖出信号,包括止损和获利水平。您甚至可以使用推送通知在旅途中进行交易。 购买后请联系我,即可免费获得交易指导和超棒的额外指标! 您可能已经多次听说过江恩交易方法。通常 Gann 的理论不仅对于新手交易者而且对于那些已经有一定交易经验的人来说都是非常复杂的东西。这是因为江恩的交易方法在理论上并不那么容易应用。我花了几年时间来完善这些知识,并将最好的原则应用到我的外汇指标中。 该指标非常易于应用。您所需要的只是将其附加到您的图表并遵循简单的交易建议。该指标不断进行市场分析工作并寻找交易机会。当它检测到一个好的入口点时,它会为您提供一个箭头信号。该指标还显示止损和获利水平。 换句话说,当您像先生一样进行交易时,该指标会为您提供最佳江恩建议。江恩亲自告诉你此时此刻该做什么。但最好的部分是您不需要了解任何有关江恩交易原则的知识,因为该指标会为您完成整个市场分析工作。
FX Trend MT5 NG
Daniel Stein
5 (6)
FX Trend NG:新一代多市场趋势智能分析工具 概述 FX Trend NG 是一款专业的多时间周期趋势分析与市场监控工具,帮助您在几秒钟内全面了解市场结构。 无需在多个图表之间来回切换,您可以立即看到哪些品种处于趋势中、哪里动能正在减弱,以及哪些时间周期之间存在强烈共振。 限时发布优惠 – 仅需 $30(6个月) 或 $80 终身授权 即可拥有 FX Trend NG 。 已经是 Stein Investments 客户? -> 发送消息 以获取专属客户群访问权限。 需要帮助或安装指导? -> 请访问 Stein Investments 官方页面 。 1. FX Trend NG 的核心优势 三状态趋势逻辑 —— 不只是 Buy 或 Sell • 大多数指标仅显示两种状态:Buy 或 Sell。 • FX Trend NG 增加第三种状态: Fade 。 • Fade 表示趋势强度正在减弱,在完全反转之前提前发出信号。 这种结构化逻辑让您看到趋势变化过程,而不仅仅是简单方向信号。 多时间周期分析(M1 至 MN1) • 从短线交易到中长线交易全面覆盖。 • 快速识别趋势
Reversion King Indicator
Eugen-alexandru Zibileanu
5 (4)
全新王者降临 - 指标 + 订单管理提示(TP1 + TP2 + TP3)+ 可选 Telegram 信号发送器 INCLUDED(免费) (完整交易与信号系统) 我们最强的黄金 EA: Gold Slayer 该指标包含先进的交易策略、可自定义订单管理系统,以及结合 Envelope 扩展的均值回归系统,并通过 RSI 等多重智能确认过滤器进行验证,以捕捉高概率反转入场机会,提供 BUY 与 SELL 信号。 你不仅能够学习如何交易,还能学会如何高效管理多个仓位,并利用之前盈利的持仓来覆盖亏损交易。 专为 M5 周期打造并优化,在 BTCUSD 和 XAUUSD 上表现尤为出色,因为这些市场的流动性能够让信号更加干净、可靠。 该指标会自动生成清晰的多头(Long)与空头(Short)信号,同时基于 ATR 自动计算入场位、止损位和止盈位,让风险管理从一开始就融入系统之中。 多 TP 系统设有三个渐进式目标位,你可以在 TP1 锁定部分利润、在 TP2 继续持仓,并在更大的行情中将仓位持有至 TP3,而这正是平均风险回报比真正开始大放异彩的地方。 默认参数开箱即用,已经针对稳定表现进行
Meridian Pro
Ottaviano De Cicco
5 (2)
Meridian Pro 2.00:MT5 专业多周期趋势矩阵 Meridian Pro 2.00 是面向 MetaTrader 5 的专业自适应趋势矩阵。它结合了原始 Meridian 趋势引擎、清晰的图表 ribbon、收盘柱确认箭头、8 周期 dashboard、Fuel 动量、加权共识、合成 HTF 处理,以及直接显示在当前图表上的高周期环境线。 目标很简单:在一个有纪律的 workflow 中读取当前趋势、多周期结构、强度、动量和 EA-ready 状态,而不是在多个图表上堆叠互不关联的指标。 Meridian Pro 的不同之处 一个自适应引擎 - 同一套波动率感知 Meridian 逻辑应用于 M1 到 W1。 合成 HTF 架构 - 高周期行由低周期数据推导,减少传统零售 MTF 中常见的 repaint、同步延迟和 broker-dependent HTF 质量问题。 完整矩阵输出 - Bias、Strength、Fuel 和加权 Consensus 一起显示,而不是拆成独立工具。 图表执行层 - ribbon 和箭头专注于当前周期,选配 HTF 线在同一图表上增加高
UZFX {SSS} 短线智能信号 MT5 是一款无重绘的高性能交易指标,专为在快速波动的市场中需要精准、实时信号的短线交易者、日内交易者和波段交易者设计。该指标由 (UZFX-LABS) 开发,融合了价格行为分析、趋势确认和智能过滤技术,可在所有货币对和时间周期内生成高概率的买入和卖出信号。 我推荐*的最佳时间周期:15分钟及以上。 {1小时}是我的首选。效果令人惊叹……! 注意:与{ LTL 164343 }指标结合使用,可提高获胜信号率。 使用 LTL 信号判断趋势,利用 SSS 信号确定入场时机。 这种方法将最大化您的胜率,并有效规避虚假信号。 核心功能 智能信号检测——精准识别强劲的趋势反转与延续形态。 多周期短线交易——在所有时间周期内运行流畅。 可自定义提醒——针对每个信号接收弹出窗口、电子邮件及手机通知(可配置)。 清晰可视箭头——图表上醒目的蓝色(买入)和红色(卖出)箭头。 自适应信号强度——可调节信号强度,适用于短期、中期或长期交易。 用户友好界面——简洁的图表显示,无重绘或信号延迟。 工作原理 UZFX SSS指标通过扫描价格走势来检测: 看涨反转——价格
Atomic Analyst MT5
Issam Kassas
4.26 (35)
本产品已针对 2026 年市场进行更新,并针对最新 MT5 版本进行了优化。 价格更新通知: Atomic Analyst 目前价格为 $99 。 接下来的 30 次购买 后,价格将上涨至 $199 。 特别优惠: 购买 Atomic Analyst 后,请发送私信给我,即可免费领取 Smart Universal EA ,并将您的 Atomic Analyst 信号转换为自动交易。 Atomic Analyst 是一款不重绘、不回绘、不延迟的 Price Action 交易指标,专为手动交易、清晰信号和 EA 自动化而设计。 User manual: settings, inputs and strategy. 它分析价格行为、强度、动能、多周期方向和高级过滤器,帮助交易者减少噪音,避免弱势交易机会,并做出更有结构的交易决策。 该指标将复杂的市场计算转换为简单的视觉信号、彩色K线、趋势读数、止损水平和多个止盈区域,使交易者能够快速理解并应用于真实市场环境。 主要交易用途: 剥头皮和日内交易: 专为快速决策、清晰箭头、提醒、K线颜色和结构化进出场区域而设计。 日内交易和波段交易:
SmartScalping
Temirlan Kdyrkhan
SmartScalping is a powerful trading companion designed to generate high-probability entry signals with dynamic TP/SL/DP levels based on volatility. Built-in performance tracking shows win/loss stats, PP1/PP2 hits, and success rates — all updated live. Key Features: Buy/Sell signals with adaptive volatility bands Real-time TP/SL/DP levels based on ATR Built-in MA Filter with optional ATR/StdDev volatility Performance stats panel (Success, Profit/Loss, PP1/PP2) Alerts via popup, sound, push, or e
ARIPoint
Temirlan Kdyrkhan
1 (1)
ARIPoint is a powerful trading companion designed to generate high-probability entry signals with dynamic TP/SL/DP levels based on volatility. Built-in performance tracking shows win/loss stats, PP1/PP2 hits, and success rates all updated live. Key Features: Buy/Sell signals with adaptive volatility bands Real-time TP/SL/DP levels based on ATR Built-in MA Filter with optional ATR/StdDev volatility Performance stats panel (Success, Profit/Loss, PP1/PP2) Alerts via popup, sound, push, or email Cu
本产品已针对 2026 年市场进行更新,并针对最新 MT5 版本进行了优化。 价格更新通知: Smart Price Action Concepts 目前价格为 $200 。 接下来的 30 次购买 后,价格将上涨至 $299 。 特别优惠: 购买后,请发送私信给我,即可领取 免费赠品 + 礼物 。 首先需要强调的是,这款交易工具是不重绘、不回绘、不延迟的指标,因此非常适合专业交易使用。 Online course , and manual Smart Price Action Concepts 指标是一款非常强大的工具,适合新手和有经验的交易者使用。它将 20 多个实用指标整合到一个系统中,结合了 Inner Circle Trader Analysis 和 Smart Money Concepts Trading Strategies 等高级交易理念。该指标专注于 Smart Money Concepts,帮助交易者理解大型机构如何交易,并辅助预测其市场行为。 它特别擅长流动性分析,使交易者更容易理解机构交易逻辑。它也非常适合预测市场趋势并仔细分析价格走势。通过让交易与机构策略保
TrendProMaster
Temirlan Kdyrkhan
MasterTrend Indicator for MT5 A powerful trend-following and signal-evaluation tool MasterTrend   is a custom MT5 indicator that combines Moving Averages and ATR-based risk/reward logic to generate clear buy/sell signals. It visualizes dynamic SL/TP levels, evaluates past trade outcomes, and displays win/loss statistics in a clean on-chart panel. Key features include: Buy/Sell signals based on MA crossovers ATR-based SL/TP1/TP2/TP3 levels with visual lines and labels Signal outcome tracking wit
Crystal Heikin Ashi Signals
Muhammad Jawad Shabir
5 (2)
Crystal Heikin Ashi Signals - Professional Trend & Signal Detection Indicator Advanced Heikin Ashi Visualization with Intelligent Signal System for Manual & Automated Trading Final Price: $149 ---------> Price goes up $10 after every 10 sales . Limited slots available — act fast . Overview Crystal Heikin Ashi Signals is a professional-grade MetaTrader 5 indicator that combines pure Heikin Ashi candle visualization with an advanced momentum-shift detection system. Designed for both manual traders
Azimuth Pro
Ottaviano De Cicco
5 (7)
Azimuth Pro V2:MT5合成分形结构分析与确认入场 概述 Azimuth Pro 是 Merkava Labs 推出的多层级波段结构指标。四层嵌套波段层级、锚定波段的VWAP、ABC形态识别、三时间框架结构过滤以及收盘确认入场——一个图表,一个从微观波段到宏观周期的完整工作流程。 这不是盲目的信号产品。它是一个以结构为先的工作流程,专为重视位置、背景和时机的交易者打造。 V2上市优惠 — Azimuth Pro V2售价USD 399(接下来的100份)。最终价格:USD 499。 1. V2的变化 合成多时间框架引擎 高时间框架分析从零开始重建,采用与Meridian Pro相同的专有合成架构。更清晰的HTF背景、稳定的实时行为、无经典MTF同步问题。合成引擎还解锁了 固定比率时间框架级联 (x2、x3、x4、x6)——不再在经纪商的固定时间框架之间任意跳转,您可以按图表时间框架的固定倍数分析结构,在每个尺度上保持相同的分形关系。 确认入场箭头 作为稳定且可恢复的执行层而设计的收盘确认箭头。当ABC设置形成且自适应确认逻辑在收盘K线上验证方向时,箭头会写入下一根K线的
ScalpPoint
Temirlan Kdyrkhan
ScalpPoint is a powerful trading companion designed to generate high-probability entry signals with dynamic TP/SL/DP levels based on volatility. Built-in performance tracking shows win/loss stats, PP1/PP2 hits, and success rates — all updated live. Key Features: Buy/Sell signals with adaptive volatility bands Real-time TP/SL/DP levels based on ATR Built-in MA Filter with optional ATR/StdDev volatility Performance stats panel (Success, Profit/Loss, PP1/PP2) Alerts via popup, sound, push, or emai
RelicusRoad Pro MT5
Relicus LLC
4.96 (24)
RelicusRoad Pro: 量化市场操作系统 终身访问限时 70% 折扣 - 加入 2,000+ 交易员社区 为什么大多数交易者即使拥有“完美”指标也会失败? 因为他们在真空中交易 单一概念 。没有背景的信号是赌博。要持续获胜,您需要 共振 (CONFLUENCE) 。 RelicusRoad Pro 不是一个简单的箭头指标。它是一个完整的 量化市场生态系统 。它描绘价格运行的“公允价值之路”,区分市场噪音和真实的结构性突破。 停止猜测。开始用机构级“路”逻辑进行交易。 核心引擎:“Road” (路) 算法 系统的核心是 Road Algo ,一个实时适应市场条件的动态波动率通道。它投射出 安全线 (平衡) 和价格可能反转的 扩展水平 。 Simple Road: 典型市场的标准结构映射。 Smooth Road: 针对震荡盘整的降噪计算。 Breakout Road: 专为识别波动率扩张和爆发性走势而调整。 1. 算法动量与确认 我们的“剥头皮箭头”不只是简单的交叉。它们利用 高阶多项式逻辑 过滤噪音,确保信号与主周期一致。我们检测动量、价格行为和 Road 结构汇聚的精确入场
M30/H1/H4 波段版已上线 想抓住M5/M15无法捕捉的大行情? Gold Signal Swing Pro(M30/H1/H4)现已发售。 目标每笔$20-$80+。 https://www.mql5.com/en/market/product/177643 KURAMA GOLD SIGNAL PRO(MT5版)— 7层过滤器 XAUUSD完整交易系统 不重绘。不重画。不延迟。每个信号确认后永久固定。 买断版购买者专属福利:购买买断版许可证可免费获得 AI Zone Radar(价值$59)+ PDF使用手册。购买后请在MQL5上给我发消息。 AI Zone Radar: https://www.mql5.com/en/market/product/175834 在真实黄金交易员社区中使用,因精度和易用性获得高度评价。 你的问题 — 以及解决方案 黄金每天波动$30-$50。你知道机会就在那里。但你是否经历过: - 入场过早,价格反向运行$10后才朝你预期的方向走 - 每
FX Power MT5 NG
Daniel Stein
5 (32)
FX Power:分析货币强度,助您做出更明智的交易决策 概述 FX Power 是一款专业工具,帮助您全面了解主要货币和黄金在任何市场条件下的真实强度。通过识别强势货币用于买入,弱势货币用于卖出, FX Power 简化了交易决策,并帮助您发现高概率的交易机会。不论您是想跟随趋势还是通过极端的 Delta 值预测反转,这款工具都能完美适应您的交易风格。别再盲目交易——用 FX Power 让您的交易更加智慧。 1. 为什么 FX Power 对交易者极具价值 实时货币和黄金强度分析 • FX Power 实时计算并显示主要货币和黄金的相对强度,助您全面了解市场动态。 • 监控领先或落后资产,轻松识别值得交易的货币对。 全面的多时间框架视图 • 跟踪短期、中期和长期时间框架的货币和黄金强度,以便将您的交易策略与市场趋势保持一致。 • 无论是快进快出的短线交易还是更长期的投资策略, FX Power 都能为您提供所需的信息。 Delta 动态分析用于趋势和反转 • 极端 Delta 值常常预示反转机会,而平缓的 Delta 变化则确认趋势延续。 • 使用 Delta 分析,轻
作者的更多信息
Color Bollinger Bands
Jinsong Zhang
5 (3)
。。。。。。。。。。。。。。。。。。。。。。。。。。。。。。。。。。。。。。。。。。。 This indicator is based on Bollinger Bands indicator. It helps user clearly know the Band is expand or contract. The method of use is the same as the traditional Brin channel index. Users can use different color areas to distribute forest channel indicators in expansion or contraction stage. -------------------------------------------------------------------------------------------
FREE
Reverse TradeCopier for Followers can copy trades from an account that is running   Reverse TradeCopier for Source . Features: Copies trades from one source (master) account to multiple following (slave) accounts. Allow investor (read only) password for source (master) account. There are no complicated settings and input parameters, everything is easy. Works with different brokers. Works with different quotes symbols (EURUSD_FX, eurusd_m, etc.). Can copy orders from 4-digit quotes platform to 5-
FREE
If you want something as below: Sell FOREX trading signal. Manage multiple accounts. Follow the trading from somebody. "TradeCopier_follow" and   "TradeCopier_source"   can help you! Features: Copying from one source (master) account to multiple follower (slave) accounts. Allow investor (read only) password for the source (master) account. There are no complicated settings and input parameters, everything is easy. Works with different Brokers. Works with different symbols (EURUSD_FX, eurusd_m, e
FREE
本产品可以方便用户比较不同图表的K线,还可以方便地查看同一商品在不同时间周期中的K线形态。 将脚本附加到一个图表上,移动K线,或者改变显示比例,所有打开的图表上的K线将与当前的图表上的K线按照时间对齐,并且同步移动。 如果不同图表上的K线的周期不同,将会根据K线的起始时间进行对齐。 使用前请确保相关的历史数据已经下载到本地。 欢迎提出宝贵建议或意见,请与我联系。 。。。。。。。。。。。。。。。。。。。。。。。。。。。。。。。。。。。。。。。。。。。。。。。。。。。。。。。。。。。。。。。。。。。。。。 。。。。。。。。。。。。。。。。。。。。。。。。。。。。。。。。。。。。。。。。。。。。。。。。。。。。。。。。。。。
。。。。。。。。。。。。。。。。。。。。。。。。。。。。。。。。。。。。。。。。。。。。。。。。。。。。。 本产品用于检测外汇行情历史数据。 质量好的历史数据对于交易者作行情分析或回测非常重要。但是各家外汇券商提供的历史数据的质量参差不齐,有时我们会留意到K线序列有缺失,但有时不易察觉。本产品帮助用户定位这些缺失位置。如果某图表上某个时段出现许多缺口,你就要小心历史数据是否可靠,也许要考虑换一个更好的行情服务器。 这个产品用编号标记K线上出现的缺口,并计算出缺口大小,以及其他相关参数。 。。。。。。。。。。。。。。。。。。。。。。。。。。。。。。。。。。。。。。。。。。。。。。。。。。。。。。。。。。。。。。。。
有的交易策略适合波动较小的、安静的行情,而有的策略适合波动较大、剧烈的行情。不管是哪种策略,交易者都应当对行情的冷热程度有清晰的量化标准。 本产品方便交易者对比不同交易品种的冷热程度,或者同一交易品种在不同时间段的交易热度。 你可以将它放在不同图表上,获得直观的感受。哪个品种热度更高,哪个交易更淡静,一目了然。 下方的颜色指示器显示瞬时的价格跳动情况,而左上角的数字显示的是一段时间内的温度累积均值。 。。。。。。。。。。。。。。。。。。。。。。。。。。。。。。。。。。。。。。。。。。。。。。。。。。。。。。 。。。。。。。。。。。。。。。。。。。。。。。。。。。。。。。。。。。。。。。。。。。。。。。。。。。
该指标用于指示K线的最高价与最低价之差,以及收盘价与开盘价之差的数值,这样交易者能直观地看到K线的长度。 上方的数字是High-Low的差值,下方数字是Close-Open的差值。 该指标提供过滤功能,用户可以只选出符合条件的K线,例如阳线或者阴线。 ---------------------------------------------------------------- 该指标用于指示K线的最高价与最低价之差,以及收盘价与开盘价之差的数值,这样交易者能直观地看到K线的长度。 上方的数字是High-Low的差值,下方数字是Close-Open的差值。 该指标提供过滤功能,用户可以只选出符合条件的K线,例如阳线或者阴线。 ----------------------------------------------------------------
有些交易者不喜欢让他们头寸中的止盈/止损价格暴露出来,这个EA可以帮助他们。 把EA拖放在图表上,并设定止盈/止损点(0意味着忽略),如果图表上的商品有头寸,它会在图表上监察商品的价格,如果价格达到用户设定的止盈/止损水平,就关闭这个头寸。 这个工具可以有效隐藏用户的止盈/止损价格。止盈/止损价格由开仓价格与用户设定的止盈/止损点子所决定。 欢迎提出宝贵建议和意见。 。。。。。。。。。。。。。。。。。。。。。。。。。。。。。。。。。。。。。。。。。。。。。。。。。。。。。。。。。。。。。。。。。。。。。。。。。。 。。。。。。。。。。。。。。。。。。。。。。。。。。。。。。。。。。。。。。。。。。。。。。。。。
This script allows traders to easily close positions if their profit/loss reaches or exceeds a value specified in pips. The script allows users to easily close positions if their profit/loss reaches or exceeds a value specified in pips. Please set slippage value first. Sometimes some positions do not close due to high volatility of the market. Please set larger slippage or restart the script. ...................................................................................................
Script to Delete Pending Orders Sometimes you placed many Pending Orders and then you want delete certain kind of these orders, this script can help you! Usage: Download and drag and drop this script to the chart. Check "Allow AutoTrading" in "Common" tab and set input parameters in "Inputs" tab. Input Parameters: TypeOfPending: which type Order you would delete. mySymbol: which Symbol you would delete. The input format of the Symbol is such as "EURUSD" or "eurusd".
The script allows to easily watch the date and time of several cities selected by the user from more than 30 important cities all over the world. It also shows GMT, Server time and Local time. The cities on the screen are automatically sorted by the date and time. You can save your setting on the Inputs tab and use them in future. Notice: Daylight saving time is not considered.
有的交易策略适合波动较小的、安静的行情,而有的策略适合波动较大、剧烈的行情。不管是哪种策略,交易者都应当对行情的冷热程度有清晰的量化标准。 本产品方便交易者对比不同交易品种的冷热程度,或者同一交易品种在不同时间段的交易热度。 你可以将它放在不同图表上,获得直观的感受。哪个品种热度更高,哪个交易更淡静,一目了然。 下方的颜色指示器显示瞬时的价格跳动情况,而左上角的数字显示的是一段时间内的温度累积均值。 。。。。。。。。。。。。。。。。。。。。。。。。。。。。。。。。。。。。。。。。。。。。。。。。。。。 .......................................................................................................
Painting Deals
Jinsong Zhang
4.67 (3)
Painting Deals on active chart. It allows analyzing trade history on an account to which you have an investor (read only) password. Type of the arrow displayed indicated the deal type: Right Arrow means In and In/Out deals Arrow Left Left means Out deals. Blue arrows are for Buy deals and Red arrows are for Sell deals. The indicator displays deals in the real time mode, it also displays their Stop Loss and Take Profit levels. Put the mouse over the arrows to see the details of deals including op
The script shows statistics of trades for the specified period. For example, if you want to know the details of trades of the ATC2010 Winner ( bobsley ): Login with his account using the investor (read-only) password (MetaTrader5); Open the chart of his trading symbol (EURUSD); Run this script on the chart; Specify 2010.10.1 in "date from", and the diagram will be shown.
本产品可以方便用户比较不同图表的K线,还可以方便地查看同一商品在不同时间周期中的K线形态。 将脚本附加到一个图表上,移动K线,或者改变显示比例,所有打开的图表上的K线将与当前的图表上的K线按照时间对齐,并且同步移动。 如果不同图表上的K线的周期不同,将会根据K线的起始时间进行对齐。                       使用前请确保相关的历史数据已经下载到本地。 欢迎提出宝贵建议或意见,请与我联系。                                —————————————————————————————————————————————————————————————————————————————————————— 。。。。。。。。。。。。。。。。。。。。。。。。。。。。。。。。。。。。。。。。。。。。。。。。。。。。。。。。。。。。。。
该工具帮助用户轻松地一键平仓,当某个持仓头寸的损益达到或者超过用户设定的点子时。 使用时请先设置滑移值。 有时,由于市场的高度波动,一些头寸不能及时关闭,这时 请设置较大的滑移值,或重新按动平仓按键。 ...................................................................................................................................................... ===================================================================================================
This script notifies a user about different events by playing sounds, sending emails and text messages to a mobile device. The following events are supported: New deals (in/in out/out). Expiration of Pending orders. The terminal disconnected. The terminal or the script closed. Please set a notification type for each event separately. If you need notifications via Email, please make sure that the settings on the Email tab are correct. If you need to receive notifications on a mobile device, pleas
This script alerts a user via sounds and alert box at the end of a countdown. It is like an alarm clock. There are 2 ways to start counting down: Set a value of remaining minutes. Example: if you need an alert after 1 hour, set it to 60. Set countdown end time. If you like to use a custom sound for the alert, copy your sound files to "terminal_path\Sounds" folder and set the exact file name in the input parameters. The sound file must be in *.wav format.
本产品用于检测外汇行情历史数据。 质量好的历史数据对于交易者作行情分析或回测非常重要。但是各家外汇券商提供的历史数据的质量参差不齐,有时我们会留意到K线序列有缺失,但有时不易察觉。本产品帮助用户定位这些缺失位置。如果某图表上某个时段出现许多缺口,你就要小心历史数据是否可靠,也许要考虑换一个更好的行情服务器。 这个产品用编号标记K线上出现的缺口,并计算出缺口大小,以及其他相关参数。 。。。。。。。。。。。。。。。。。。。。。。。。。。。。。。。。。。。。。。。。。。。。。。。。。。。。。。。。。。。。。。。。。。。。。 ..................................................................................................
SmartMA
Jinsong Zhang
This is a trend indicator, as you can see here. When the white line is above the red, it means a bull market. Conversely, the white line below the red line is a bear market. This index is suitable for long - term trading and is suitable for most trading varieties. --------------------------------------------------------------------------------------------
This indicator let user clearly see Buy/Sell signals. When a bar is closed and conditions meet, arrow signal will come up at Close Price, up is Buy and down is Sell. It works on all Timeframes. And you can set sound alert when signals come up.
这个指标用于比较图表上的交易品种与其他几个所选交易品种之间的强弱相对关系。 根据每个交易品种基于相同基准日的价格走势进行比较,可以看到几条不同走向的趋势线,反映出几个不同交易品种之间的强弱关系,这样可以更清楚地了解市场的趋势。 例如,你可以在EURUSD图表上应用这个指标,将其与货币对EURJPY和EURGBP进行比较,看看哪个更强。 你需要为指标输入参数: 需要比较的几个交易品种的名称 您需要选择比较基准日期。 请注意,使用指标前应确保相关交易品种的历史数据已经下载。 免费模拟版本是: https://www.mql5.com/zh/market/product/63921 .............................................
.................................. This script is intended to help users to get information about ticks and spreads (e.g. ticks count, minimum/maximum/average spread). It can export reports in the CSV format with this information. Traders can see spread statistics in real time in the chart window It is useful for comparing spreads of different brokers. --------------------------------------------------------------------------
这是一款基于市场深度的可视化指标,它可工作于所有提供市场深度的品种。它显示每笔卖价/出价的交易量与总卖价/出价的交易量的比值,这样用户可以直观地判断买卖方向的瞬时强度。你可以同时在几个图表上应用这个指标,观察不同品种的买卖队列。 购买前请确认你的交易商有提供市场深度这个功能。 。。。。。。。。。。。。。。。。。。。。。。。。。。。。。。。。。。。。。。。。。。。。。。。。。。。。。。。。。。。。。。。。。。。。。。。。 。。。。。。。。。。。。。。。。。。。。。。。。。。。。。。。。。。。。。。。。。。。。。。。。。。。。。。。。。。。。。。。。。。。。。。。。。 。。。。。。。。。。。。。。。。。。。。。。。。。。。。。。。。。。。。。。。。。。。。。。。。。。。
这个指标用于比较图表上的交易品种与其他两个所选交易品种之间的强弱相对关系。 根据每个交易品种基于相同基准日的价格走势进行比较,可以看到三条不同走向的趋势线,反映出三个不同交易品种之间的强弱关系,这样可以更清楚地了解市场的趋势。 例如,你可以在EURUSD图表上应用这个指标,将其与货币对EURJPY和EURGBP进行比较,看看哪个更强。 你需要为指标输入参数: 您可以输入两个交易品种的名称 您需要选择比较基准日期。 请注意,使用指标前应确保相关交易品种的历史数据已经下载。 免费模拟版本是: https://www.mql5.com/zh/market/product/63888 .........................................
该指标用于指示K线的最高价与最低价之差,以及收盘价与开盘价之差的数值,这样交易者能直观地看到K线的长度。 上方的数字是High-Low的差值,下方数字是Close-Open的差值。 该指标提供过滤功能,用户可以只选出符合条件的K线,例如阳线或者阴线。 ---------------------------------------------------------------- 该指标用于指示K线的最高价与最低价之差,以及收盘价与开盘价之差的数值,这样交易者能直观地看到K线的长度。 上方的数字是High-Low的差值,下方数字是Close-Open的差值。 该指标提供过滤功能,用户可以只选出符合条件的K线,例如阳线或者阴线。
这个脚本允许比较来自不同交易服务器或者不同经纪商的报价和价差,以识别出一个提供最好的买价/卖价和最小价差的服务器/经纪商。 一次可与最多6个不同的服务器或经纪商进行比较,通过分数很容易就能找到最好的报价提供商。 用法:打开最多6个MetaTrader 客户端终端,分别登入不同的服务器/经纪商,然后在每个终端的图表上启动脚本。 。。。。。。。。。。。。。。。。。。。。。。。。。。。。。。。。。。。。。。。。。。。。。。。。。。。。。。。。。 。。。。。。。。。。。。。。。。。。。。。。。。。。。。。。。。。。。。。。。。。。。。。。。。。。。。。。。 。。。。。。。。。。。。。。。。。。。。。。。。。。。。。。。。。。。。。。。。。。。。。。。。。。。
Rocket Projectile
Jinsong Zhang
1 (1)
这是一个多货币配对交易系统。具体原理我就不详细解释了,用户需要关心的是它的实际表现。 强烈建议阁下下载此产品,并对它进行充分的检验,包括以历史数据进行回测、在模拟账户进行实测。 由于此EA交易多个货币对,在首次对其进行历史回测时,将会自动下载相关的历史数据,数据量约为每个月6GB左右,下载时间约一小时(如果电脑配置高,而且网速快,会节省下载时间)。 数据下载完成后,你可以在策略测试器中对其进行充分的测试。测试一个月的历史数据需要大约10分钟。具体测试方法在本网站的文章中有介绍。 由于市场上有很多交易商,同一交易商有多个不同的服务器,各有不同特性,会让本产品的测试结果有较大影响,建议用户多开不同账户对产品进行测试,以获得较佳结果。关于交易商的服务器,用户可以参考我在MQL5社区上的相关博客。 可以确定的是,服务器的延时越少、滑点越小、点差越低、报价越稳定,则本EA盈利机会越多。交易者需要做的是找到这样的服务器。如果你找到了,祝贺你!你可以利用VPS,对产品作进一步的实时测试。 祝好运!
这个工具用于产生某个货币对的K线倒影图表,适用于外汇交易。 例如货币对为EURUSD,则会生成一个名为EURUSD_ref的自定义货币对,并打开该货币对的图表。自定义货币对的价格是原来货币对的价格的倒数,即相当于一个新货币对USDEUR,其价格K线图看起来就象EURUSD图表的倒影或者镜像。 用法很简单,将它放到随便某个图表上,新的图表就会打开,然后实时地画出对应的价格K线图。但是不可以将应用加载到由指标生成的倒影图表上运行。  =================================================================================== ==========================================================================
这是一个会自我学习的指标。你需要设定一个起始时间,并下载相应的历史数据,让它进行学习。学习的规则限制尽量少,给予指标最大的自由度。因此,以学习期间的最佳结果为选取原则,并不保证每次交易都是盈利的。通常而言,学习时间越长,结果越可靠。 在策略测试器中,你需要设定时间参数,早于测试开始的时间,以便让指标有充足的学习时间。 指标会发出买入或者卖出的信号,以箭头的方向作出区分。指标亦会发出关闭信号,以不同颜色的圆点作区分。 *************************************************************************************************************************************
筛选:
无评论
回复评论