Volume Profile Order Flow

Volume Profile Order Flow - MQL5 Marketplace Description Preview

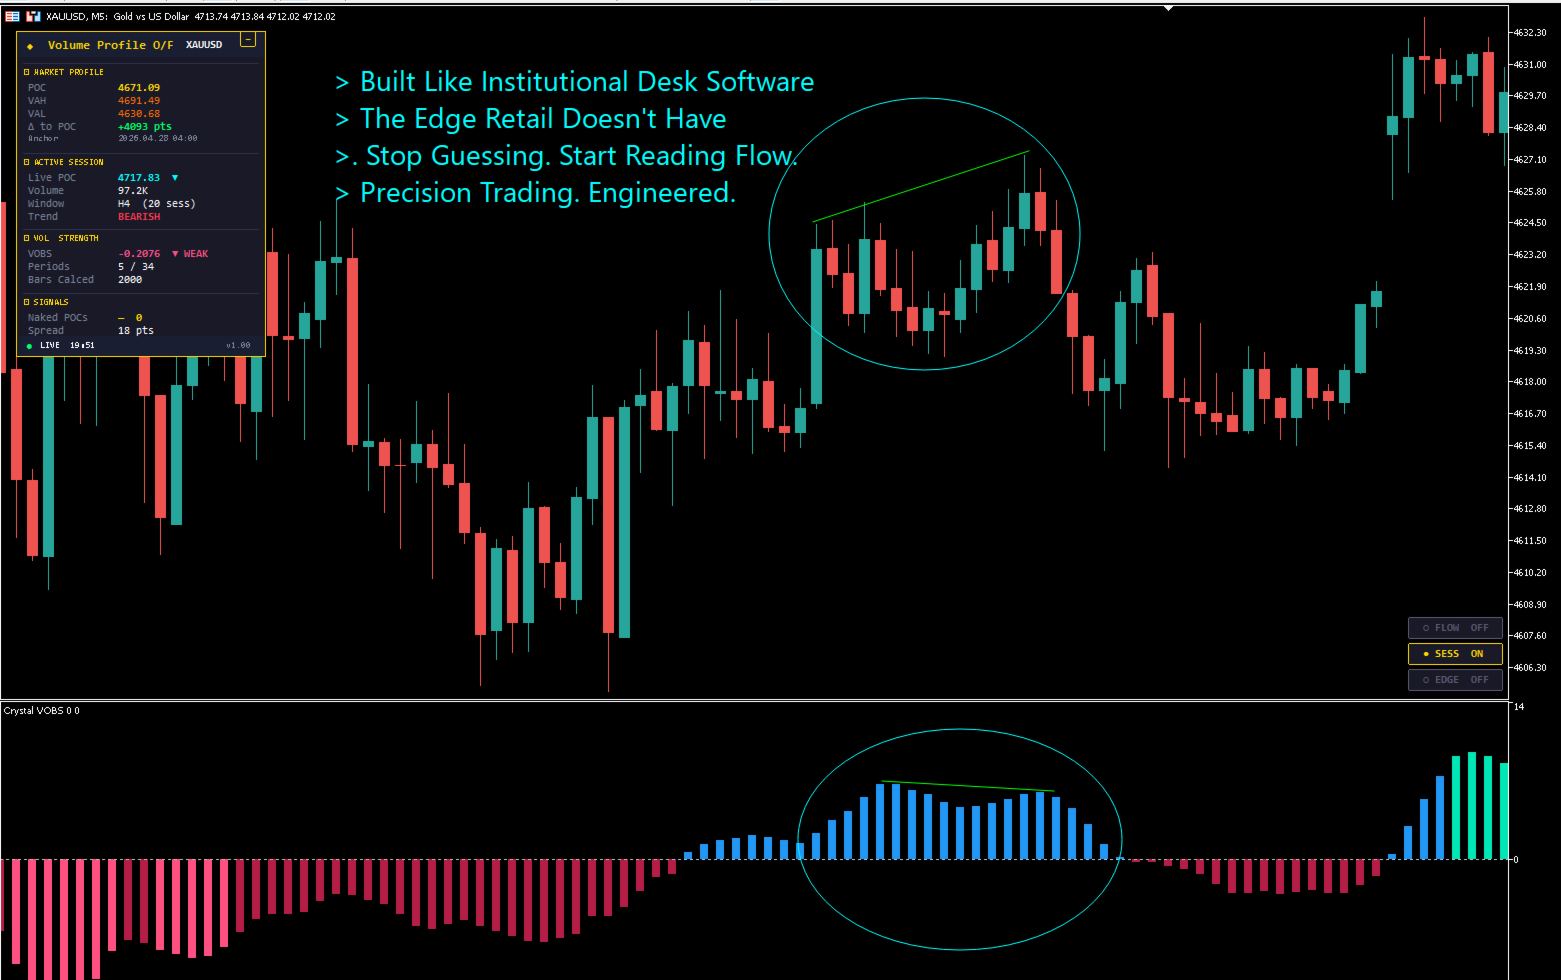
Volume Profile Order Flow — Institutional-Grade Analysis Suite for MetaTrader 5

Stop guessing where smart money is positioned. Start seeing it.

Volume Profile Order Flow is a complete order flow analysis suite engineered for serious traders who refuse to settle for generic indicators. Built around a proprietary multi-engine architecture that combines anchored volume profile, real-time strength oscillator, per-bar order flow footprint, premium 3D session rendering, and intelligent naked POC tracking, this is the most advanced volume profile tool available on MetaTrader 5.

Whether you trade Gold, Forex majors, indices, crypto CFDs, or any liquid instrument — this tool reveals the price levels where institutional capital is actually committed, the moments when momentum is shifting, and the unfilled volume voids that price will return to test.

Why Traders Are Switching to Volume Profile Order Flow

Every feature in this product solves a real problem that retail traders face daily. Compare:

Common Indicator Problem Volume Profile Order Flow Solution
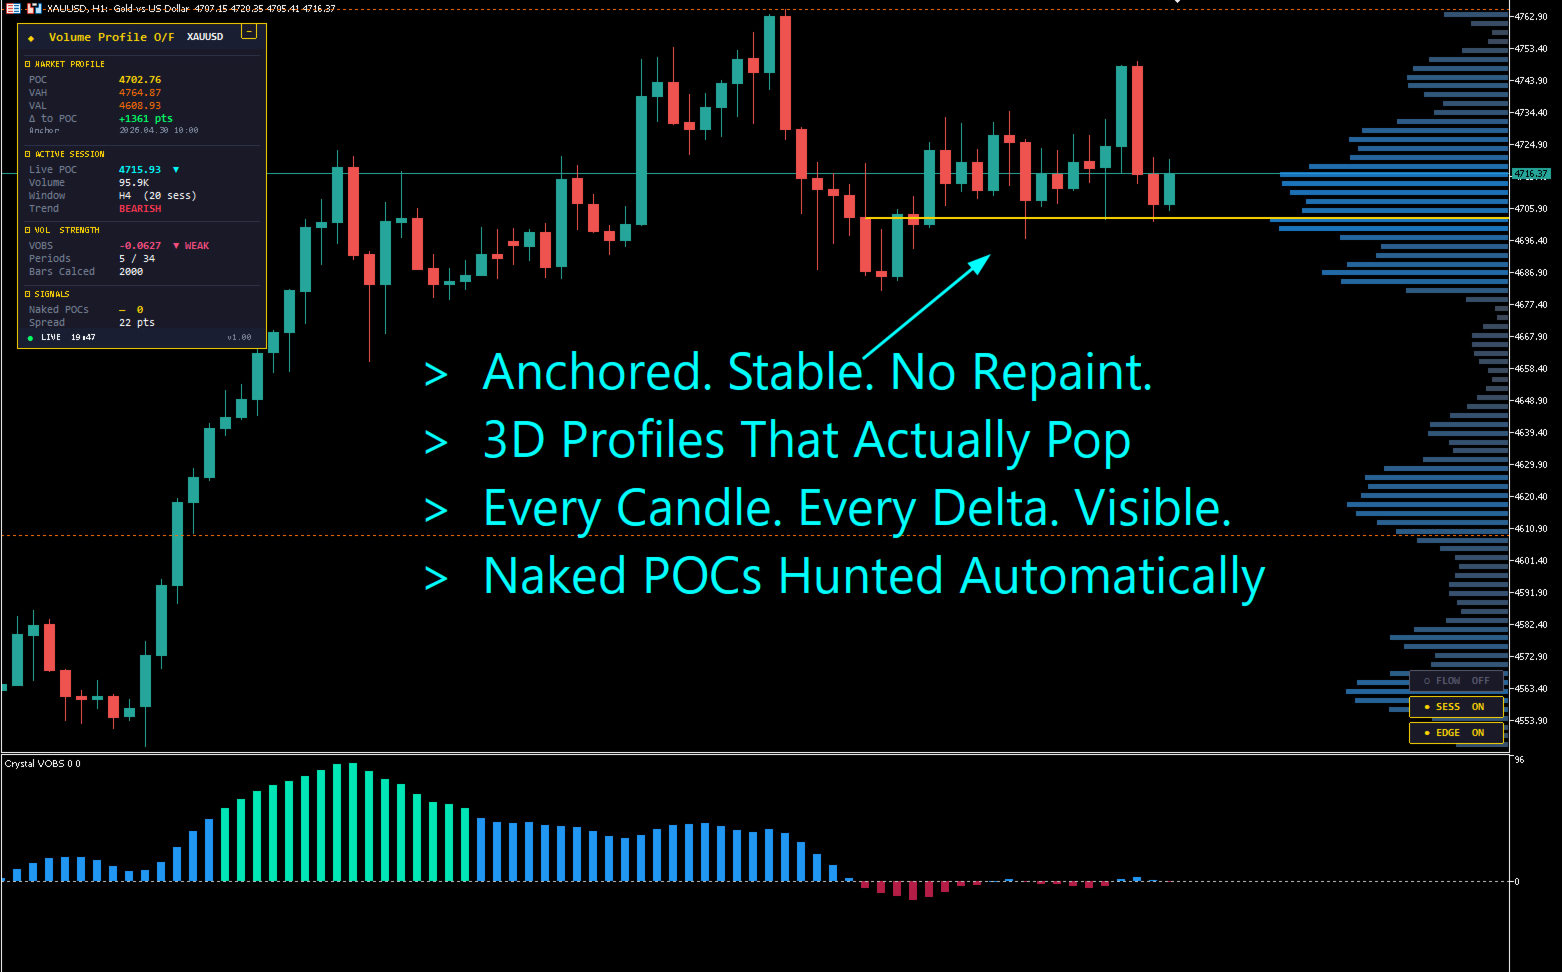
POC line jumps every bar, feels like repainting Anchored snapshot engine — POC stays stable, only refreshes on timeframe change
Single histogram view forces switching between modes Dual histogram architecture — right-edge composite and per-session histograms, side by side
Session histograms look flat and boring Premium 3D session rendering — volume-driven depth, beveled lighting, isometric projection
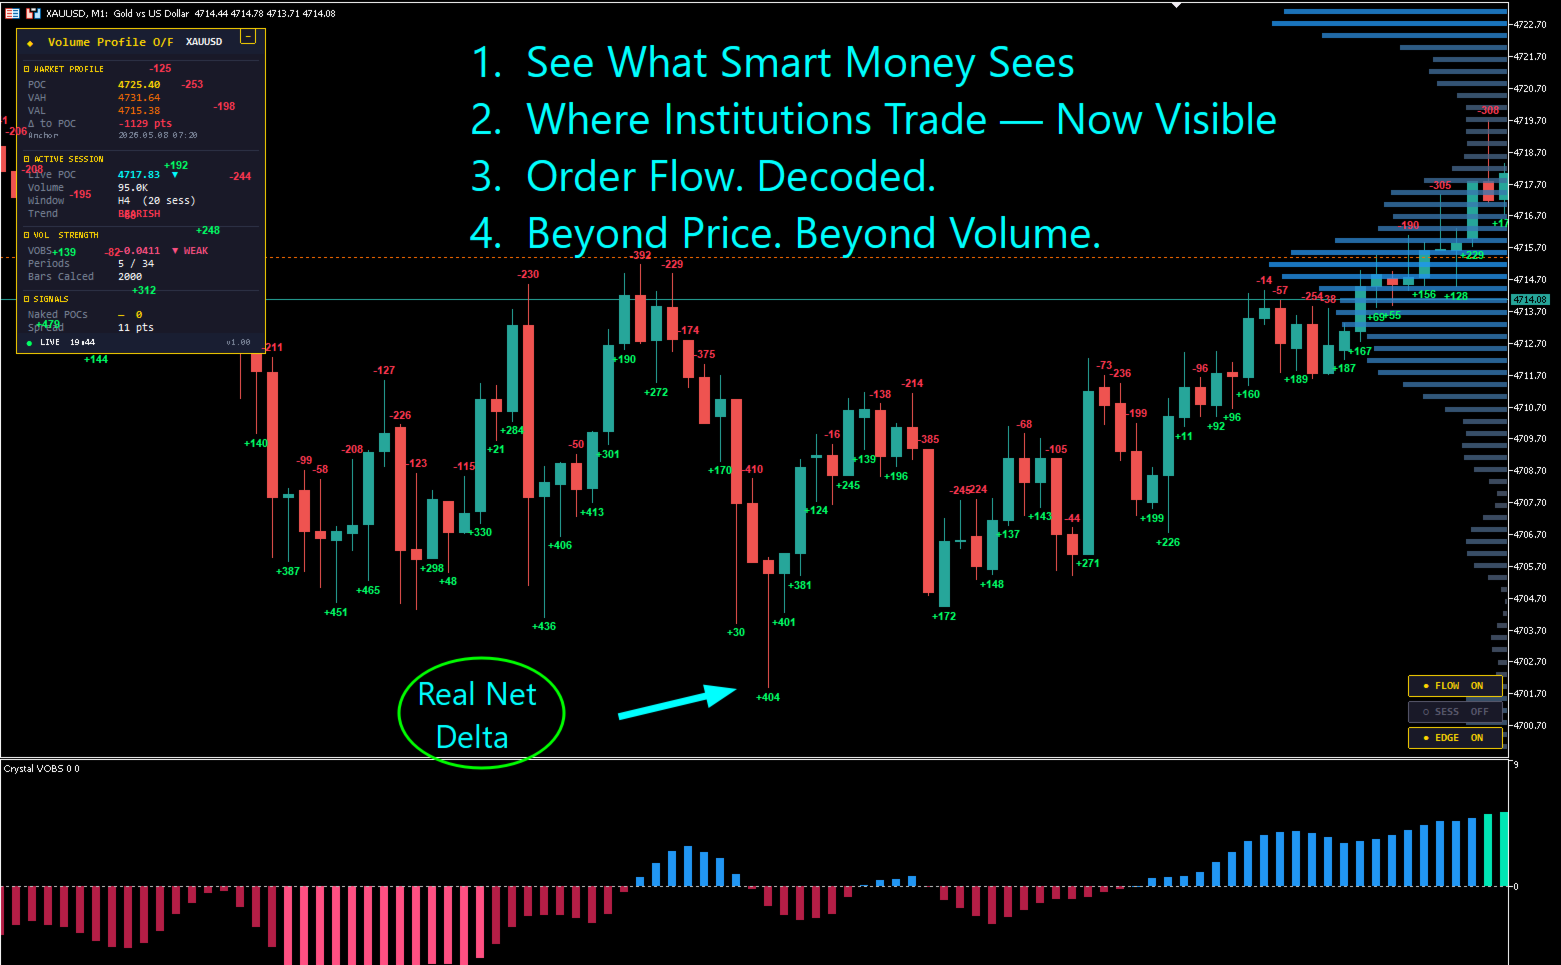
No way to see who actually won each candle Per-bar delta footprint — net order flow numbers floating above/below every running session bar
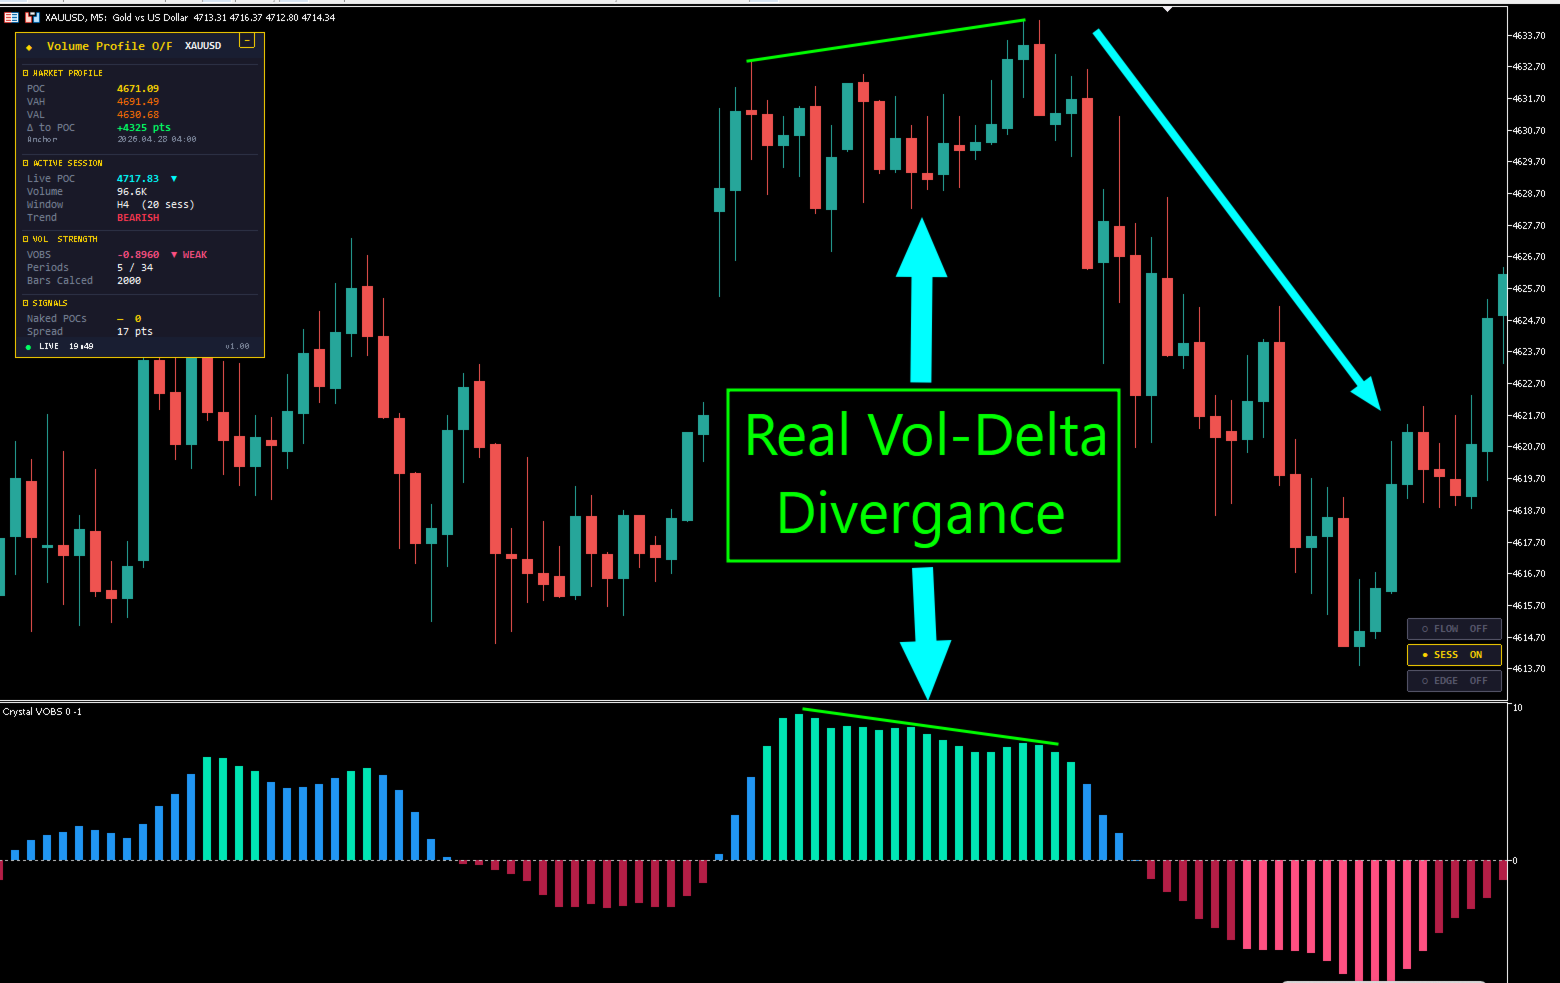
Cumulative delta drifts and hides divergences VOBS Strength Engine — bounded oscillator that exposes momentum shifts and divergences clearly
Untested key levels disappear from the chart Naked POC tracker — automatically marks unfilled prior-day POCs as gold dotted lines
Settings buried in cluttered menus One-click toggle buttons — instant control over major features, state remembered per symbol
Slow performance on Strategy Tester Tester-optimized engine — bulk-array calculations, smart phase rendering, runs in seconds not minutes

Core Engine — Seven Pillars of Edge

1. Anchored Right-Edge Volume Profile

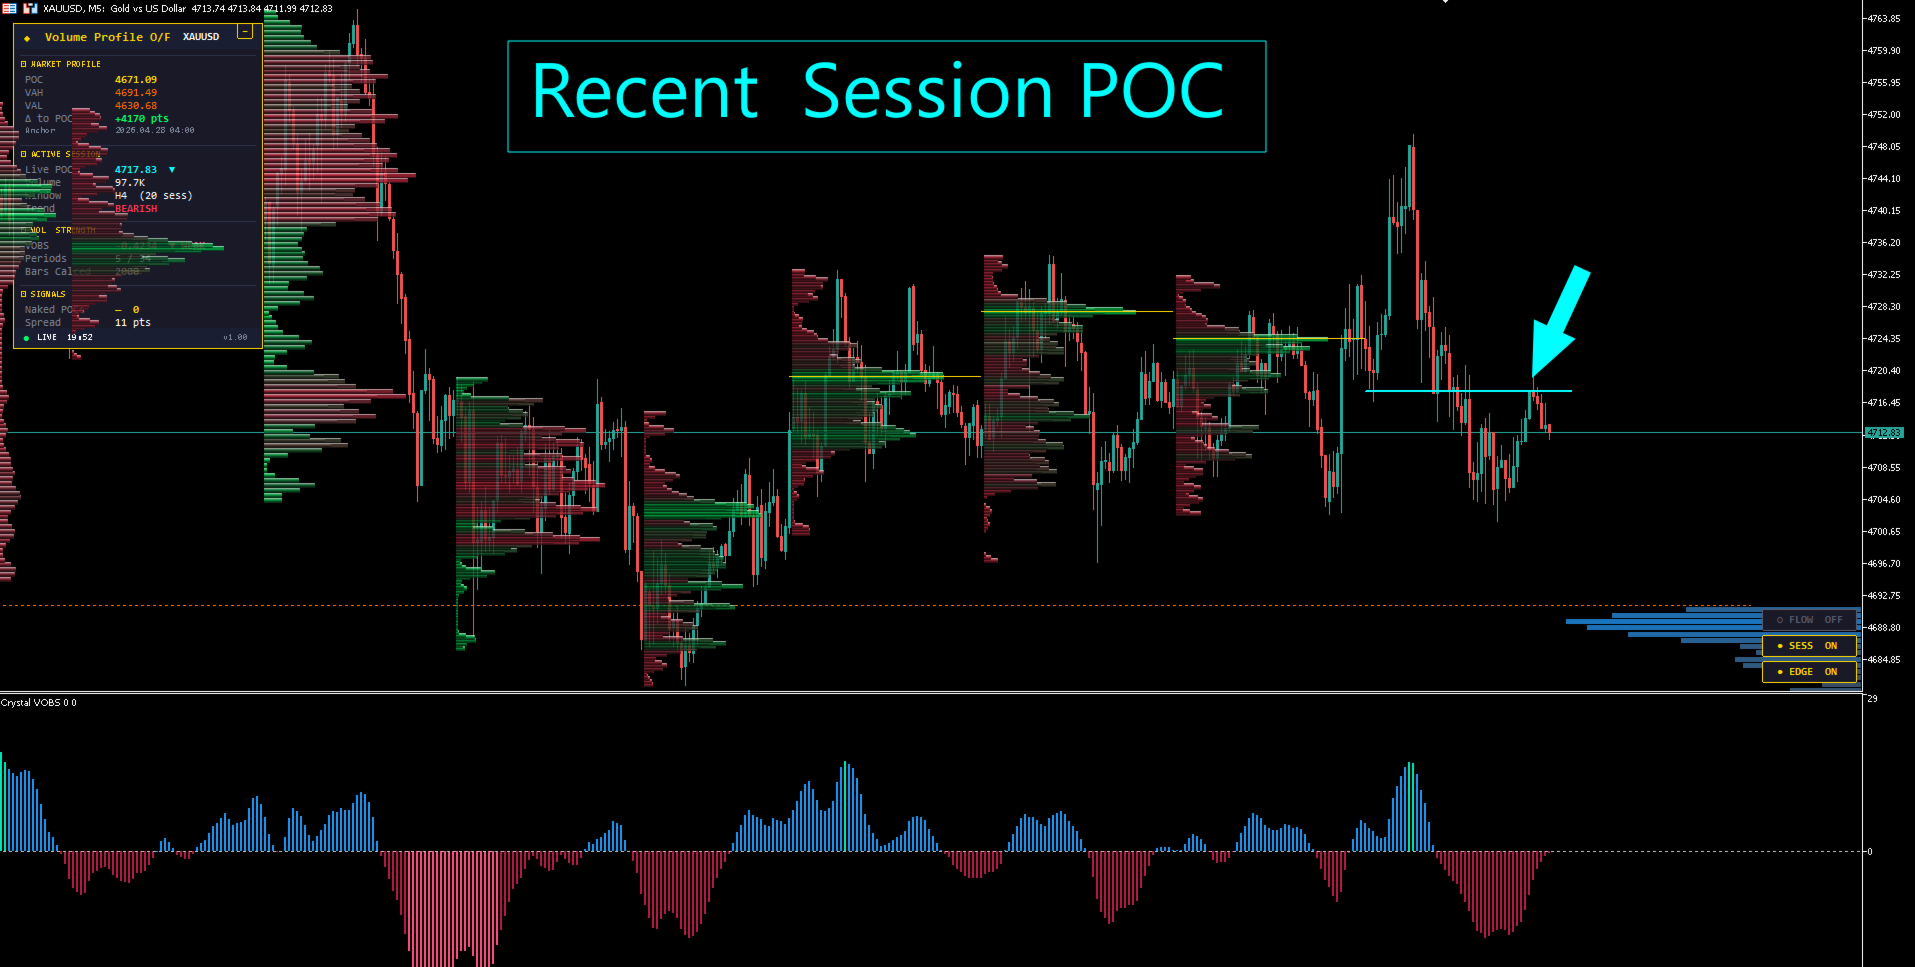
Composite volume distribution across all visible bars, displayed as a vertical histogram on the right side of the chart. Bars colored from subtle grey (low volume) to bright blue (high volume) — institutional positioning becomes visually obvious at a glance.

The profile is anchor-locked using a snapshot-plus-increment architecture identical in principle to professional desk platforms. POC, VAH, and VAL stay rock-stable on M1 charts — no jumping, no repainting, no recalculation on zoom or scroll. Only timeframe changes trigger a fresh snapshot.

2. Premium 3D Session Histograms

Independent volume distribution for each H4 (or H8 / H12) session block, rendered with industry-leading 3D depth visualization. Each bar features:

  • Five-tier brightness gradient creating natural beveled depth
  • Volume-driven extrusion — high-volume bars project further than low-volume bars
  • Pixel-precise highlighting — metallic sheen at top edges, shadow grounding at bottom
  • Direction-aware coloring — bullish sessions in cyan-green tones, bearish in coral-pink
  • Tail-end depth fade for the leading edge of high-volume bars

The result is a profile that looks like premium institutional desk software — not a hobbyist plugin.

3. VOBS — Volume Order Book Strength Engine

Proprietary momentum oscillator displayed in a separate subwindow. Measures the volume-weighted strength imbalance between buyers and sellers across two configurable lookback windows. Bars are color-graded by intensity:

  • Bright cyan-green — peak bullish strength (high-conviction buying pressure)
  • Deep blue — medium bullish strength
  • Bright pink — peak bearish weakness (high-conviction selling pressure)
  • Deep red — medium bearish weakness

The subwindow auto-scales to currently visible bars (true MACD/Awesome Oscillator behavior) — bars always look proportional, never overflow, never disappear. Zero line stays centered.

4. Per-Bar Delta Footprint

Net delta value displayed as text labels above or below each running session candle. Green numbers below bullish bars, red numbers above bearish bars. Engineered to appear ONLY on the live session for a clean chart — old completed sessions show histograms instead.

Reading the footprint is instant: 3+ consecutive large positive numbers signal aggressive buying continuation; sudden +200/-200 spike followed by reversal candle signals a stop hunt or absorption event.

5. Naked POC Tracker

Automatic detection and visual marking of untested Points of Control from prior days. These unfilled volume voids act as price magnets — statistically, price returns to test them with high reliability. Each naked POC appears as a gold dotted horizontal line, clearly labeled with timestamp.

Configurable maximum age (1–7 days) and maximum displayed count keeps your chart focused on the most relevant levels.

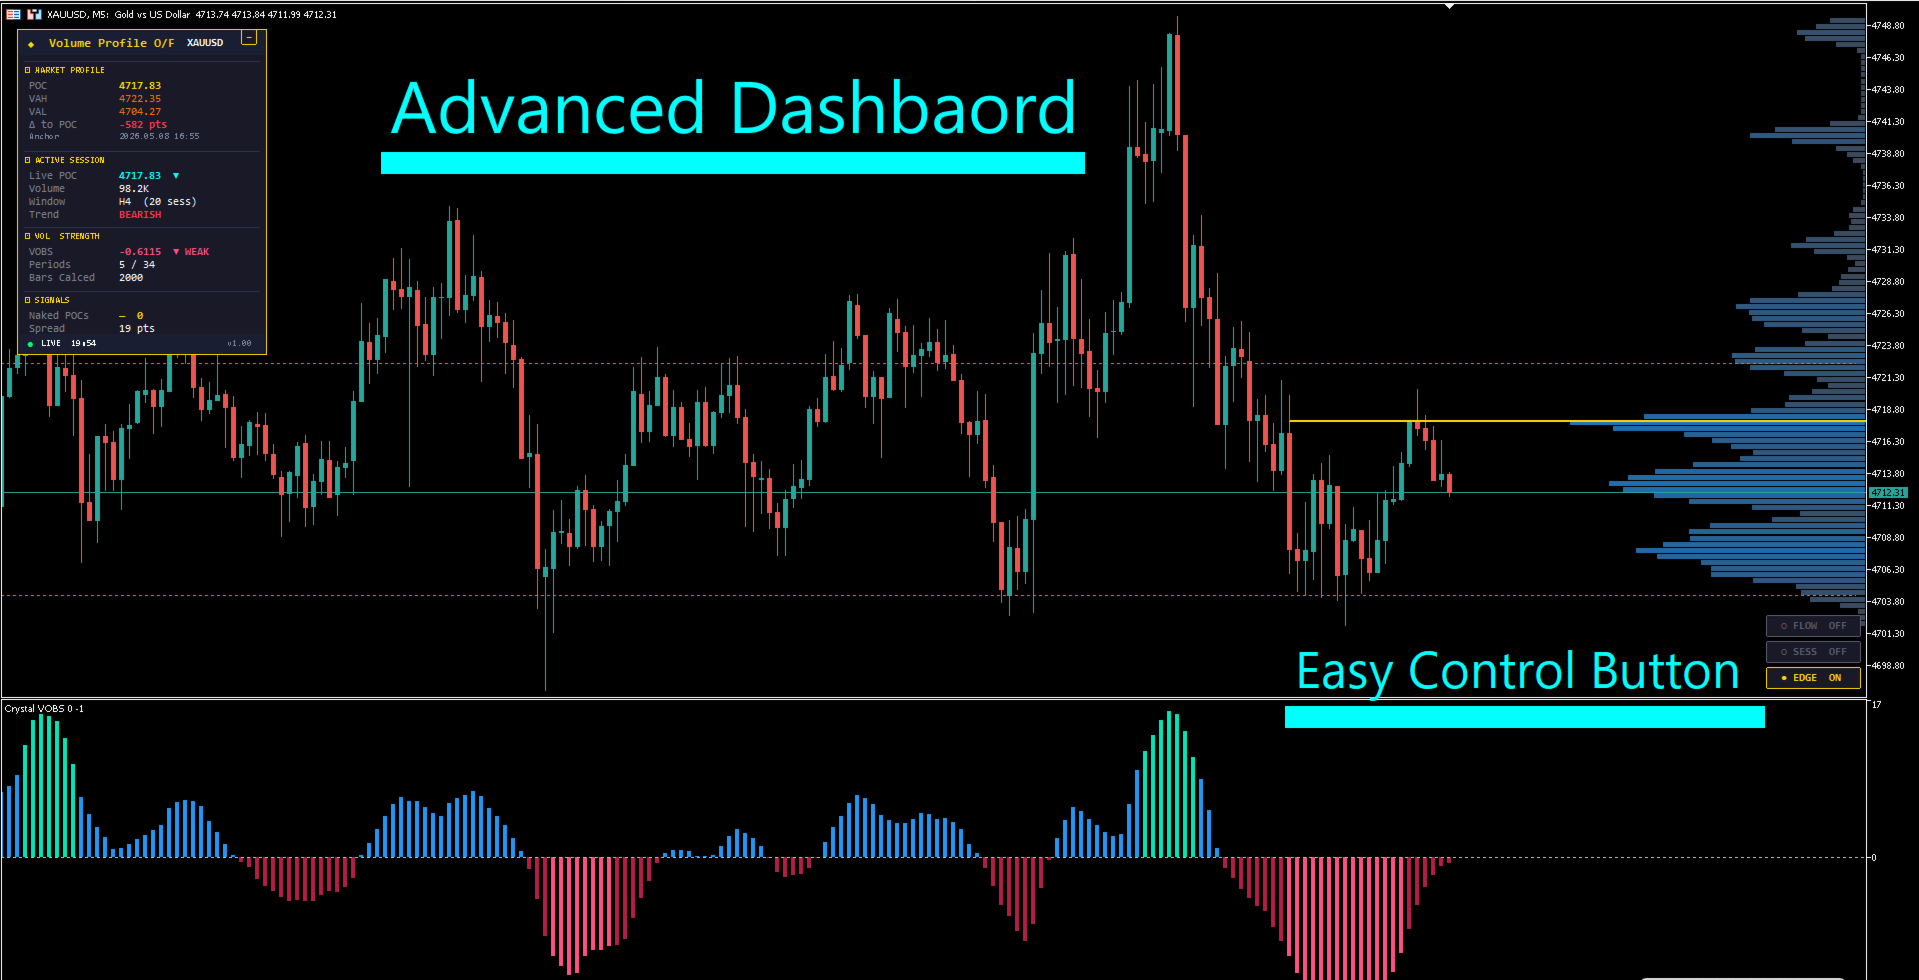
6. Statistics Dashboard

Information panel anchored in the upper-left corner. Four organized sections deliver every reading you need without scanning the chart:

  • Market Profile — Composite POC, VAH, VAL, distance to POC, anchor timestamp
  • Active Session — Live developing POC, session volume, session window, trend direction
  • Volume Strength — Current VOBS reading with strength/weakness label, lookback periods, bars calculated
  • Signals — Active naked POC count, current spread

The dashboard collapses with a single click and remembers its state across timeframe changes.

7. Strategy Tester Optimized

Unlike most volume profile indicators that crash or freeze in MetaTrader's Strategy Tester, Volume Profile Order Flow uses specialized tester architecture:

  • Bulk-array calculations replace 300,000+ native function calls per render
  • Two-phase rendering: catchup phase skips visuals, live phase renders smoothly
  • Tester-aware feature gating disables interactive elements automatically
  • VOBS buffers always populate so EAs can read via iCustom() during backtests

Result: backtest with this indicator attached at full broker speed.

One-Click Toggle Buttons

Three professional-grade toggle buttons in the lower-right corner deliver runtime control without opening the inputs panel:

Button Controls State Persistence
FLOW Per-bar delta numbers on the running session candles Saved per-symbol, survives timeframe changes and platform restarts
SESS Session histograms with 3D rendering on H4/H8/H12 blocks Saved per-symbol, survives timeframe changes and platform restarts
EDGE Right-edge composite anchored histogram Saved per-symbol, survives timeframe changes and platform restarts

Trading Style Compatibility

Volume Profile Order Flow is engineered to serve every active trading style. The default settings work universally; minor adjustments unlock peak performance for your specific approach:

Trading Style Recommended Timeframe Key Features to Use Best Setups
Scalping M1, M5 FLOW + SESS + EDGE all ON, per-bar delta visible POC magnet reversion, naked POC retest, VOBS divergence
Day Trading M5, M15 SESS + EDGE on, FLOW optional Open-drive vs open-rejection, range-day VAH/VAL rotation, POC migration
Swing Trading H1, H4 EDGE on, sessions auto-hide, longer history Multi-day naked POC magnets, value area breakout acceptance, range fade
Smart Money / ICT Any All features on, confluence stacking Order block + HVN confluence, FVG + LVN acceleration, liquidity sweep + VAH/VAL rejection

Universal Symbol Compatibility

Volume Profile Order Flow works on every symbol your broker provides. The volume engine automatically falls back from real volume to tick volume on instruments where exchange data is unavailable, ensuring full functionality on:

  • Precious Metals — XAUUSD (Gold), XAGUSD (Silver)
  • Forex Majors — EURUSD, GBPUSD, USDJPY, USDCHF, AUDUSD, USDCAD, NZDUSD
  • Forex Crosses — EURJPY, GBPJPY, EURGBP, AUDJPY, EURCHF, and more
  • US Indices — US30 (Dow), US500 (S&P), NAS100 (Nasdaq), US2000 (Russell)
  • Global Indices — GER40 (DAX), UK100 (FTSE), JPN225 (Nikkei)
  • Cryptocurrency — BTCUSD, ETHUSD, and major altcoins
  • Energies — USOIL (WTI), UKOIL (Brent), NGAS

The indicator adapts automatically to each symbol's price scale, point value, and tick size. No manual calibration required.

Six Premium Visual Themes

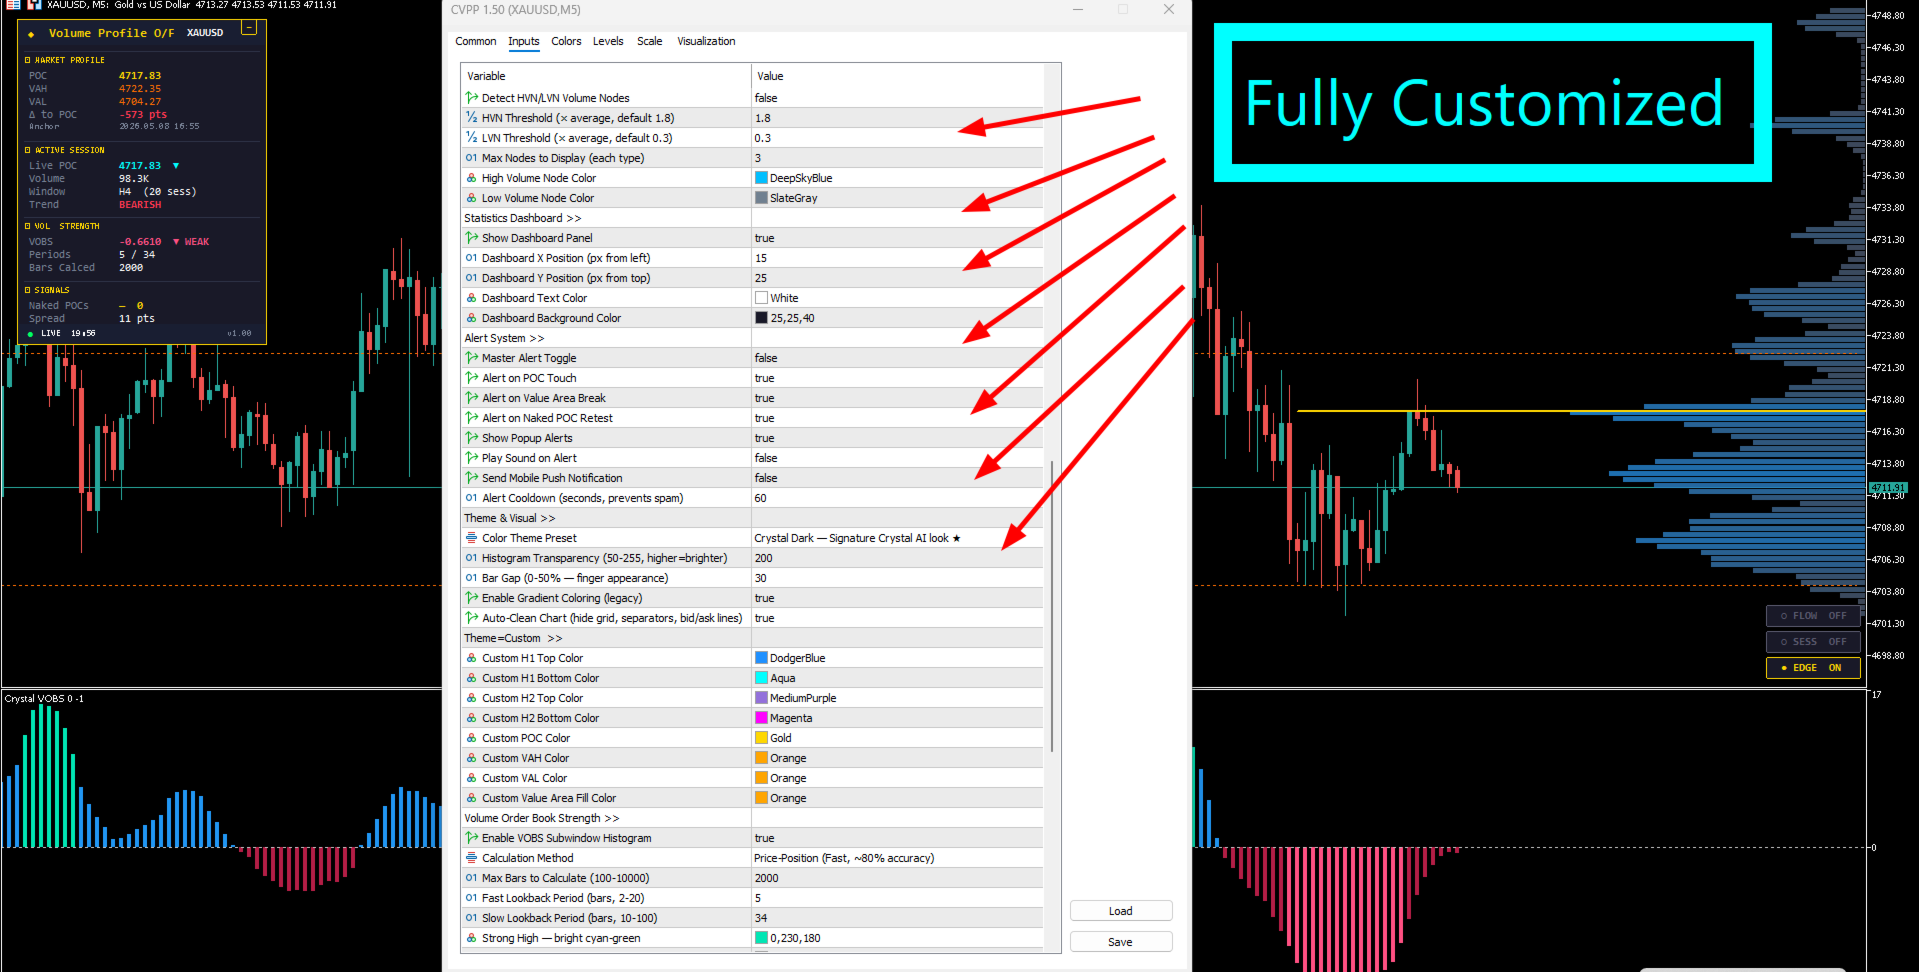
Match your chart aesthetic to your trading mindset. Every theme is professionally tuned for clarity in real trading conditions:

Theme Best For
Crystal Dark (default) The signature look. Deep blacks, vivid accent colors, gold POC. Recommended for dark chart backgrounds.
Crystal Light Bright daytime palette for traders using light chart themes.
Classic Blue Traditional financial industry tones — conservative and clean.
Neon Cyber Vibrant high-contrast palette for traders who want maximum visual impact.
Institutional Sober professional tones inspired by institutional desk software.
Custom Full color control via dedicated input fields. Build your own theme from scratch.

Real-Time Alert System

Never miss a critical volume profile event. The integrated alert engine triggers on:

  • POC Touch — price reaches the composite Point of Control
  • Value Area Break — price breaks above VAH or below VAL
  • Naked POC Retest — price returns to a tracked unfilled prior-day POC

Alerts can be delivered via popup, sound (alert.wav), or mobile push notification to MetaTrader Mobile. A configurable cooldown prevents spam during active price action. Alerts are automatically suppressed in Strategy Tester to prevent backtesting noise.

Performance Engineering

Every aspect of Volume Profile Order Flow is built for production-grade performance:

  • Bulk-array data fetching — replaces 300,000+ native function calls per render with single Copy* operations (50× speedup)
  • Snapshot-plus-increment architecture — eliminates redundant recalculation on every tick
  • Decoupled engines — VOBS recalculates only on timeframe change or new bar (never on zoom or scroll)
  • Optimized canvas rendering — smooth visuals even with hundreds of session profiles loaded
  • Two-phase tester rendering — catchup phase processes data, live phase renders visuals
  • Auto-scaling subwindows — VOBS panel never overflows regardless of resize or settings changes

What You Get

  • Volume Profile Order Flow indicator (.mq5 file, fully compiled)
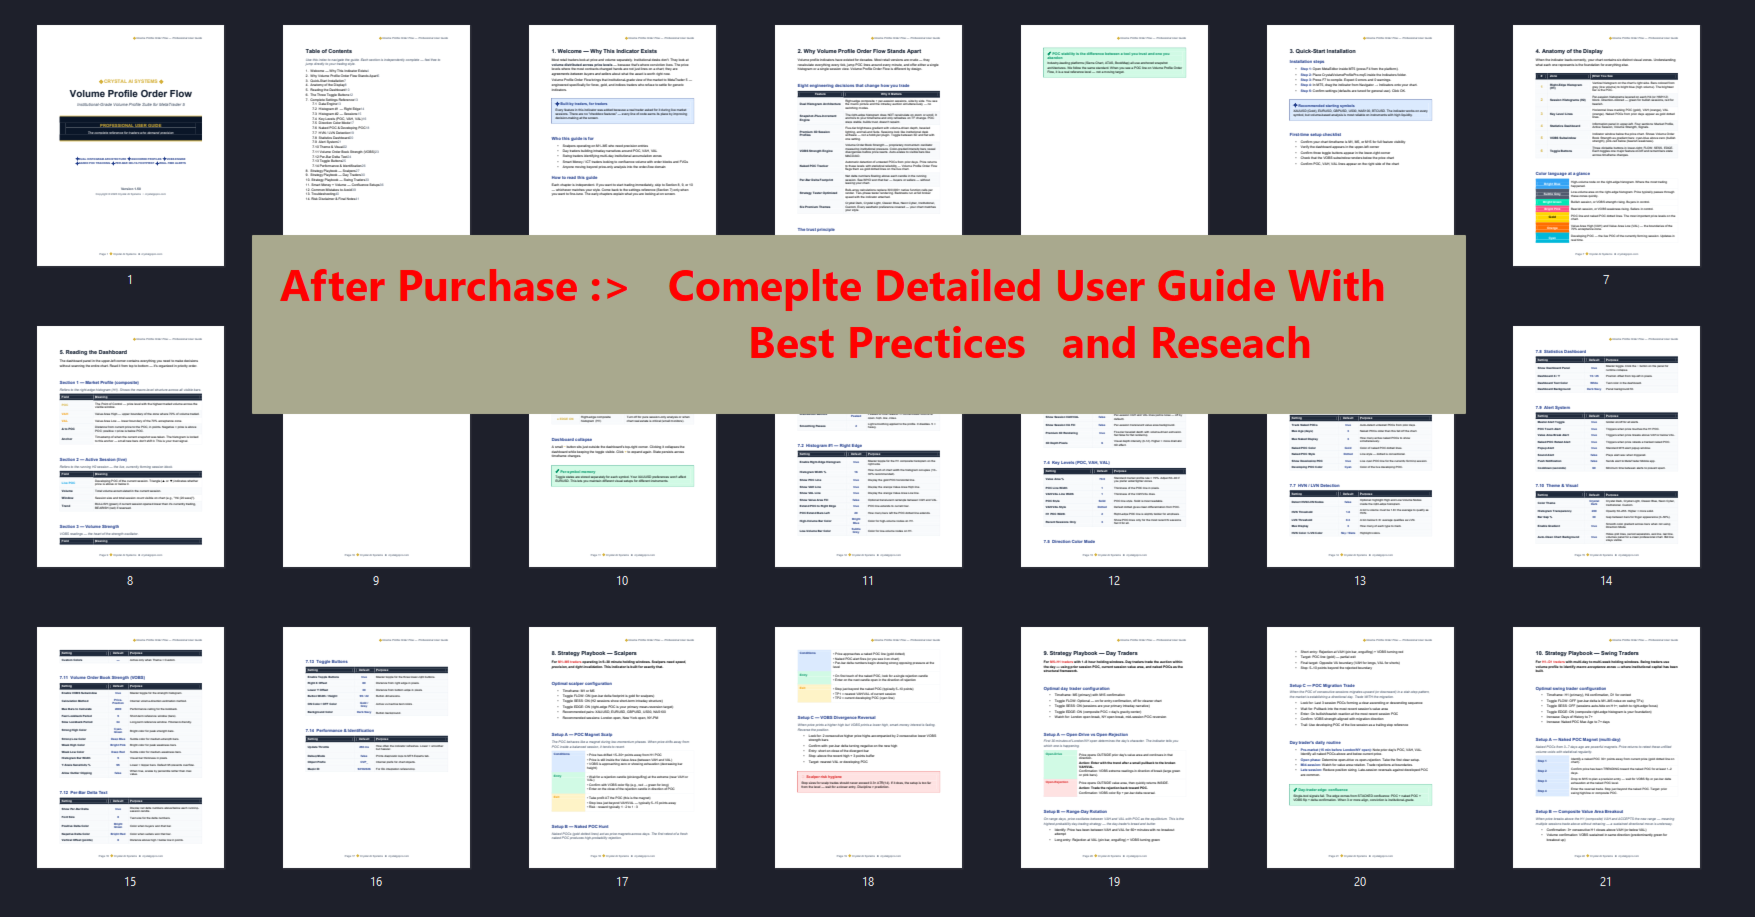
  • Comprehensive professional user guide (45-page PDF)
  • Strategy playbook for scalpers, day traders, swing traders, and SMC traders
  • Lifetime updates and improvements
  • Direct support from Crystal AI Systems

System Requirements

  • Platform — MetaTrader 5 (build 3815 or higher recommended)
  • Operating System — Windows 10 / 11, macOS via Wine, Linux via Wine, VPS deployments
  • Hardware — Any standard trading computer; the indicator is highly optimized
  • Account Type — Hedging or Netting (works with both)
  • Timeframes — All MetaTrader 5 timeframes from M1 to MN1

Frequently Asked Questions

Q: Does this indicator repaint?
A: No. The right-edge histogram uses an anchored snapshot architecture — POC, VAH, and VAL stay stable across bars. Only major events (timeframe change, symbol change) trigger a fresh anchor. Zoom and scroll never cause recalculation.

Q: Will it work on forex symbols where my broker only provides tick volume?
A: Yes. The engine automatically uses tick volume when real exchange volume is unavailable. Tick volume is statistically correlated with real volume on liquid forex pairs.

Q: Does it work in Strategy Tester?
A: Yes. Unlike most volume profile indicators, this one is specifically optimized for tester performance. Backtests run at full broker speed with the indicator attached. EAs can read VOBS values via iCustom().

Q: Can I run this alongside my Expert Advisor?
A: Yes. The indicator is purely analytical — it does not place orders or interfere with EA operation. Multiple EAs can read the indicator's data via global variables for confluence-based strategies.

Q: How is this different from free volume profile indicators?
A: Free indicators typically offer a single histogram view, recalculate aggressively, and lack order-flow features. Volume Profile Order Flow delivers dual histograms, anchored stability, premium 3D session rendering, VOBS strength engine, per-bar delta footprint, and naked POC tracking in one integrated suite.

Q: Do I need any other indicators alongside this one?
A: No. Volume Profile Order Flow is a complete suite covering volume profile, order flow, momentum, and key level tracking. It pairs naturally with price action analysis, but no additional indicators are required.

Q: Will my settings persist if I change timeframes?
A: Yes. Toggle button states are saved per-symbol via global variables and survive timeframe changes, indicator reloads, and even MetaTrader restarts.

Q: Can I disable the 3D rendering if I prefer flat bars?
A: Yes. A single setting (InpH2_3DMode) toggles between premium 3D and clean flat rendering. The 3D depth is also fully configurable via InpH2_3DDepthPx.

Q: Is there a free trial?
A: Demo version available for full testing in the MetaTrader Strategy Tester. Rent and purchase options are available through the standard MQL5 marketplace system.

About Crystal AI Systems

Crystal AI Systems develops institutional-grade trading tools for MetaTrader 4 and MetaTrader 5. Every product undergoes rigorous testing on live market data before release. Our development philosophy: build the tool we would want to trade with ourselves.

Visit crystalgopro.com for the complete product catalog, support resources, and trading insights.

Risk Disclaimer

Volume Profile Order Flow is a technical analysis tool, not a trading signal service or automated trading system. All trading decisions remain the sole responsibility of the user. Forex, CFD, and futures trading involves substantial risk of loss and is not suitable for all investors. Past performance of any indicator, methodology, or analysis is not necessarily indicative of future results. Trade only with capital that, if lost entirely, would not affect your financial wellbeing.

Lifetime free updates included with every purchase.

Crystal AI Systems — Engineered for traders who demand precision.
推荐产品
Better Volume MT5
Illia Zhavarankau
1 (1)
Description: The indicator of tick volumes Better Volume MT5 allows you to assess the general mood of the market and quite accurately catch the moments of the formation of large movements. The indicator is a color histogram in an additional window. In the calculation of Better Volume MT5 the Price Action combinations are taken into account, the values of the volumes with the height of columns and color marking are displayed. Input parameters: MAPeriod - period for calculating the moving average
MT4 版本: https://www.mql5.com/en/market/product/157433 MT5 版本: https://www.mql5.com/en/market/product/167286 成交量不平衡指标是一款轻量级的成交量分布图 + Delta 不平衡可视化工具,旨在帮助您在可配置的回溯范围内发现高成交量价格区域、方向性压力和“空位”价格区域。 与仅显示总成交量的传统成交量分布图不同,该指标将每个价格水平拆分为: 牛市成交量(买入压力)——根据阳线(收盘价 > 开盘价)估算 熊市成交量(卖出压力)——根据阴线(收盘价 ≤ 开盘价)估算 最终生成一个简洁的、类似 TradingView 风格的成交量分布图,绘制在图表右侧,此外还有一个 Delta 汇总面板,显示各个价格区间的不平衡百分比 (Δ%),方便您轻松识别买方或卖方主导的区域。 它还会突出显示零成交量区域(选定回溯期内成交量为零的价格区间),这些区域流动性较差,价格可能在此快速波动。 注意:对于外汇/差价合约交易品种,该指标使用逐笔成交量(由经纪商提供)。Delta 值是基于K线方向
BoxChart MT5
Evgeny Shevtsov
5 (7)
The market is unfair if only because 10% of participants manage 90% of funds. An ordinary trader has slim changes to stand against these "vultures". This problem can be solved. You just need to be among these 10%, learn to predict their intentions and move with them. Volume is the only preemptive factor that faultlessly works on any timeframe and symbol. First, the volume appears and is accumulated, and only then the price moves. The price moves from one volume to another. Areas of volume accumu
该指标建立当前报价,可以与历史报价进行比较,并在此基础上进行价格走势预测。指示器有一个文本字段,用于快速导航到所需日期。 选项: 符号 - 选择指标将显示的符号; SymbolPeriod - 选择指标从中获取数据的时段; IndicatorColor - 指示器颜色; HorisontalShift - 由指标绘制的报价移动指定的柱数; Inverse - true 反转引号,false - 原始视图; ChartVerticalShiftStep - 图表垂直移动(键盘上的向上/向下箭头); 接下来是文本字段的设置,您可以在其中输入日期,您可以通过按“回车”立即跳转到该日期。 接下来是文本字段的设置,您可以在其中输入日期,您可以通过按“回车”立即跳转到该日期。
Blahtech Market Profile MT5
Blahtech Limited
5 (10)
Was: $249  Now: $99   Market Profile defines a number of day types that can help the trader to determine market behaviour. A key feature is the Value Area, representing the range of price action where 70% of trading took place. Understanding the Value Area can give traders valuable insight into market direction and establish the higher odds trade. It is an excellent addition to any system you may be using. Inspired by Jim Dalton’s book “Mind Over Markets”, this indicator is designed to suit the
Deriv Boom and crash
Israr Hussain Shah
Here   our more valuable tools SMC Trend Trading   ,  Easy SMC Trading  ,  Institutional SMC Architect Volume Analysis Tools  ,  Volume flow Profile  ,  Market volume profile  , FVG with Volume  , Liquidity Heatmap Profile  ,  Volume Spread Analysis Boom: Take SELL signals only (price spikes up then crashes) Crash: Take BUY signals only (price drops then spikes up) SL goes beyond the line as labeled Interactive Market Watch Panel : A left-side sidebar showing real-time strength indicators (po
Boom Crash SMC
Israr Hussain Shah
Here   our more valuable tools SMC Trend Trading   ,  Easy SMC Trading  ,  Institutional SMC Architect Volume Analysis Tools  ,  Volume flow Profile  ,  Market volume profile  , FVG with Volume  , Liquidity Heatmap Profile  ,  Volume Spread Analysis Deriv boom and crash index spike killer system you can use it only on m5 timeframe  follow the structure and get signal with alert on phone open trade set sl tp and enjoy easy analysis and trading made simple 
Forex Volume MT5
KEENBASE SOFTWARE SOLUTIONS
KT Forex Volume 以彩色柱状图的形式显示货币对的买入和卖出成交量。成交量由某一资产的买入和卖出交易构成。 在外汇市场中: 如果买入量大于卖出量,该货币对的价格通常会上涨。 如果卖出量大于买入量,该货币对的价格通常会下跌。 功能特点 通过使用点差成交量数据进行确认,避免不良交易。 帮助您跟随市场上的大资金参与者。 集成所有 Metatrader 警报提醒功能。 关于 Tick 成交量的使用 与其他市场不同,现货外汇市场是一个非集中式市场,因此零售交易者很难获得真实准确的成交量数据。 资深外汇交易员 Caspar Marney 于 2011 年提交的一份研究报告指出,Tick 成交量与实际成交量之间存在高度相关性和准确性。 柱状图计算公式 KT Forex Volume 指标基于 Chaikin 振荡器计算得出。该振荡器由 Marc Chaikin 提出,通过测量快速和慢速移动平均线之间的累积/分布关系来构建。 N = [(收盘价 - 最低价) - (最高价 - 收盘价)] / (最高价 - 最低价) M = N * 成交量(周期) ADL = M(前一周期) + M
Liquidity HeatMap Profile
Israr Hussain Shah
5 (1)
Here   our more valuable tools MT4 VERSION SMC Trend Trading   ,  Easy SMC Trading  ,  Institutional SMC Architect Volume Analysis Tools  ,  Volume flow Profile  ,  Market volume profile  , FVG with Volume  , Liquidity Heatmap Profile  ,  Volume Spread Analysis 2. Key Features Dynamic Filtering : The core feature. As soon as the current price crosses a historical liquidity level, that level disappears. This reduces chart clutter and prevents you from trading off "dead" support/resistance. Liqu
Bastion Sentinel Core
Matthew David Cracknell
Bastion Sentinel Core — Daily Zones, 4-Hour Rejection Signals Overview Bastion Sentinel Core identifies supply and demand zones on the Daily timeframe — price levels where the market has previously attempted to break through and failed — and marks non-repainting BUY/SELL arrows when price re-tests and rejects those zones on the 4-Hour timeframe. Timeframes are fixed in this edition: zones are always mapped from Daily, and rejections are always confirmed on the 4-Hour close.  This is an analysis
Advanced ARFIMA Predictor Advanced ARFIMA Predictor is a predictive trading indicator built on the ARFIMA (AutoRegressive Fractionally Integrated Moving Average) model, designed to capture the structural memory embedded in financial markets and translate it into actionable Buy and Sell signals. Unlike traditional short-memory models, ARFIMA incorporates fractional integration to detect long-memory dynamics and persistent price behavior. This enables the indicator to anticipate regime shifts and
RAD Real Acummulation and Distribution
Jose Alejandro Jacome Jimenez
RAD CRITICAL LEVES RAD indicator tracks “Relevant Volume” in real time, identifying accumulation and distribution processes, projecting them in the chart as SUPPORT or RESISTANCE zones. Natural   support   and resistance levels are generated by Volume Accumulation and Distribution processes. As these processes evolve, levels at which the relevant volume in the market place is positioned, become difficult areas to cross upwards or downwards. By using this information, traders can identify very s
ICT Yoshi Pro
Le Quang Thanh
Market Structure, Liquidity and Price Action Analysis for MetaTrader 5 A chart can contain plenty of information and still leave a trader without a clear decision. A BOS label may appear, liquidity may be nearby, and an order block may remain active, yet the real challenge is understanding how those elements relate to one another. ICT Yoshi Pro organizes that process into a cleaner, more disciplined MetaTrader 5 workflow. What ICT Yoshi Pro Does ICT Yoshi Pro is a manual decision-support indicat
VDelta Profile Pro
Quang Vinh Huynh
VDelta Profile Pro Volume Profile + Order-Flow Context for XAUUSD, US100 (NAS100) and US500 (SP500) VDelta Profile Pro builds a live volume profile directly on your chart, showing where the market actually traded — the Point of Control (POC), Value Area (VAH/VAL), and High Volume Nodes (HVN). These structural levels act as natural support and resistance zones that price tends to respect, react to, and return to. The core of this tool is volume-at-price : it measures how much activity occurred at
本指标可以让您享受两个最流行的产品来分析在感兴趣的价位的请求量和市场成交量: 真实市场深度图表 真实报价足迹成交量图表 本产品结合两个指标的效力,并以单个文件提供。 反危机出售。今日低价。赶紧! 真实的 COMBO 市场深度功能和报价成交量图表,完全等同于原始指标。您将享受这两款产品结合为单一超级指标的力量!下面是您将得到的功能: 真实市场深度图表 股民专用工具现已在 MetaTrader 5 上可用。 真实市场深度图表 指标在图表上以直方条的形式显示可视化的市场深度,并在实时模式下刷新。 利用 真实市场深度图表 指标您可以正确评估市场请求并从图表上看到大的市场。这可以 100% 的精确剥头皮和设置持仓止损。 指标以两种相应颜色的水平直方条形式显示买和卖的请求 (买-卖)。价格图表上给定级别的显示条和它们的长度与请求的交易量相应。此外, 它指示买卖请求的最大交易量。 此指标显示买卖请求总数量作为堆积面积图。这可以评估当经过下一价位时将会执行的请求总量。买卖请求总数量也显示在图表上。 省缺, 指标显示在图表背景上, 且它不会干扰任何其它指标。当使用指标交易时, 建议使用实际交易量。 本
What if you could finally SEE where the market really wants to go? Most traders watch price. Pros watch VOLUME — where the money was actually traded. Volume Profile Fibo Confluence puts that reading right in front of you, in plain language, no jargon. WHAT YOU SEE ON YOUR CHART • The POC, the most-traded price: the market's natural magnet • The value area (VAH / VAL): the "house" where price spends its time • Automatic Fibonacci retracement + the golden pocket • Low-volume nodes
Game changer volume analysis and candle by candle also analysis   video link  https://youtu.be/oJgStY1xTlY for example 20 candle analysis 10 Candle also analysis even single candle also analysis  and buyers and sellers live showing in numbers  and fully customised panel   Strong selling activity    Market sentiment turning bearish Price continues rising Volume gradually decreases   Price ↑ + Volume ↑ = Strong Uptrend Price ↓ + Volume ↑ = Strong Downtrend Price ↑ + Volume ↓ = Weak Uptrend Price
Apex Trend Zone — 产品说明 Apex Trend Zone 是一款趋势跟踪信号指标,旨在捕捉市场的主要方向,并帮助您在整个趋势过程中持有仓位。它通过跟踪价格动能,使用简洁的箭头标记和一条自适应跟踪线,在图表上标示潜在的反转点和延续点。 该指标采用动态区域逻辑,能够根据市场波动性自我调整。随着趋势增强,跟踪区域会扩大,旨在减少在强劲行情中过早离场,并使您在趋势结束之前保持方向一致。 优势 它提供清晰、简洁无杂乱的视觉呈现;买入和卖出方向在图表上一目了然。它适用于所有交易品种(外汇、指数、商品、加密货币)以及所有时间周期。得益于这条自适应跟踪线,使您更容易在整个趋势过程中持有仓位,从而减少在震荡行情中不必要的离场。它使用简单,无需叠加大量其他指标,即可独立提供一个方向性框架。当在更高的时间周期(例如 1 小时、4 小时和日线)上使用时,错误信号会显著减少,这使其特别适合波段和持仓型的交易方式。 注意事项 与所有趋势跟踪工具一样,在横盘和无方向(震荡)市场中产生错误信号的可能性会增加。在较低的时间周期上,由于市场噪音,信号频率可能会增加,并可能出现误导性的反转。就其本质而言
Basic Volume Profile MT5
Mehran Sepah Mansoor
使用我们的 Metatrader 交易量曲线指标,探索交易量分析的威力!  /   MT4 版本 基本成交量曲线是专为希望优化交易的手动交易者设计的指标。对于任何希望更好地了解市场行为的严肃交易者而言,成交量曲线指标都是必不可少的工具。利用我们的创新解决方案,您可以清晰、简明地直观了解交易量在不同价格间的分布情况。这样,您就可以确定关键的关注区域,如支撑位和阻力位、累积区和分布区以及重要的控制点。与显示特定日期交易量的普通交易量指标不同,Basic Volume Profile 显示的是特定价格的交易量。 我们的指标具有直观和可定制的界面,让您可以根据自己的交易偏好进行调整。 特点 在价格图表上清晰显示成交量概况。 快速识别高低成交量活动区域。 完全自定义颜色和样式,以适应您的交易风格。 支持多时段综合分析。 专门的技术支持,确保体验顺畅。 配置参数 指标设置 Number of histograms:   要显示的成交量条数 Profile position:     是否希望在第一根蜡烛或侧面显示成交量曲线 Color mode:     是否希望将成交量曲线分为看涨/看
Overview Heiken Ashi CE Filtered MT5 is a technical indicator for the MetaTrader 5 platform. It integrates smoothed candlestick charting with a dynamic exit strategy and a customizable trend filter to deliver clear buy and sell signals. The indicator is designed to improve trend detection and signal reliability by reducing market noise. If you want to see more high-quality products or order the development/conversion of your own products, visit my partners' website: 4xDev Get 10% OFF on manual
Volume Profile Density v2
Vincent Jose Proenca
Volume Profile Density V2.40 显示按价格水平分布的成交量,揭示机构交易兴趣区域。 不同于按时间统计的传统成交量,它展示成交量真正集中的位置。 主要概念: 水平条 = 各价格成交量 条越长 → 成交量越大 红色区域 = 关键支撑/阻力 主要用途: 识别真实支撑与阻力 确定 POC (控制点) 定义 价值区域 (占总量的70%) 低成交量区用于止损或目标 颜色说明: 蓝色 = 低成交量(快速通过区) 黄色 = 中等成交量(平衡区) 红色 = 高成交量(机构活动区) 交易策略: 红区反弹买入 红区或VAH受阻卖出 POC突破配合成交量进场 回测POC时入场 目标设在蓝区 参数设置: 初学者:1.0 / 100% / 1.0 短线交易:0.5 / 200% / 0.5 波段交易:2.0 / 50% / 1.5 技术信息: 版本:2.40 平台:MT5 品种:外汇、CFD、贵金属、加密货币 时间周期:M1–M15 类型:实时自适应指标 总结: 成交量不会说谎——顺应成交量区域交易,而不是逆势而行。
FREE
Adjustable Consecutive Fractals  looks for 2 or more fractals in one direction and sends out a on screen alert, sound alert and push notification, for strong reversal points . Adjustable Consecutive Fractals, shows the fractals on chart along with a color changing text for buy and sell signals when one or more fractals appear on one side of price. Adjustable Consecutive Fractals is based Bill Williams Fractals . The standard Bill Williams fractals are set at a non adjustable 5 bars, BUT withe th
Volume Profile Multiple — 多区块成交量分布指标,带缓冲区数据接口,支持算法交易 还在为每次切换周期都要重新绘制、重新计算成交量分布图而烦恼吗? Volume Profile Multiple 可在图表上自动绘制多个连续的成交量分布区块,揭示机构资金在市场各个阶段的真实活动区域——而不仅仅局限于最近可见的价格区间。 功能说明 该指标将历史价格按每 N 根K线划分为若干区块(区块数量和每区块的K线数量均可自定义),并为每个区块计算完整的成交量分布数据:控制点(POC)、价值区上下沿(VAH/VAL),以及高成交量节点和低成交量节点(HVN/LVN)。最终呈现的是一幅逐区块的市场结构可视化地图,便于识别基于真实成交量的筹码集中区、支撑阻力位,以及价格在不同价值区之间的轮动情况。 同样为算法交易而设计 与大多数成交量分布指标不同,本指标不仅提供可视化功能:它还输出 3个数据缓冲区 (最新区块的 POC、VAH、VAL),完全兼容 StrategyQuant X 以及任何 MQL5 智能交易系统(EA)。这意味着您可以直接基于这些关键价位构建交易策略,无需重新编写成交量
Time And Sales Layout indicator shows traded buy and sell volumes right on the chart. It provides a graphical representation of most important events in the time and sales table. The indicator downloads and processes a history of real trade ticks. Depending from selected depth of history, the process may take quite some time. During history processing the indicator displays a comment with progress percentage. When the history is processed, the indicator starts analyzing ticks in real time. The l
Heatmap Volume Profile
Olexandr Savchuk
3.5 (2)
A Heatmap with a Volume Profile is like a thermal imager or x-ray machine. It will help you to estimate the relative distribution of volume during the price movement and to understand  the relationship between volume and price. Indicator Volume Profile "Volumos Maxima" is a powerful tool for analyzing this relationship. After simple experimentation with heatmap, you can find that each trading instrument has its own “ characteristic ” way of distributing volume. And this will help you to make a b
VEHI_v2_Improved 简介 VEHI_v2_Improved (波动性-熵混合指标)是专为 MetaTrader 5 (MT5) 设计的先进技术指标,基于 VWAP(成交量加权平均价),具备智能且不重绘的功能。以下是其主要优势: 1. 适应市场波动 根据市场波动性(ATR)调整 VWAP 窗口大小,确保: 在高波动性条件下快速响应。 在低波动性市场中保持信号稳定。 2. 不重绘 VWAP、UpperBand、LowerBand 以及买卖信号在蜡烛关闭后固定,提供: 手动和自动交易的高可靠性。 不变信号以提高准确性。 3. 新闻检测 利用 ATR 识别异常波动(新闻事件),在这些期间暂停更新,以: 避免虚假信号。 降低在波动市场中的交易风险。 4. 清晰的交易信号 通过图表上的箭头提供买卖信号: 买入 :价格从下向上穿越 VWAP 或触及 LowerBand。 卖出 :价格从上向下穿越 VWAP 或触及 UpperBand。 箭头颜色编码(绿色为买入,红色为卖出),便于识别。 5. EMA 平滑 支持通过 EMA(可自定义周期)平滑 VWAP 和带: 减少信号噪音。 提供更平
Mirror Chart MT5
Andrej Hermann
5 (1)
The Mirror Chart MT5 is a overlay indicator specifically designed to project a second financial instrument directly onto the main chart window. This tool is invaluable for traders who rely on correlation analysis, as it visualizes the price movements of two different instruments in real time. Unlike traditional overlays, this indicator utilizes intelligent, dynamic centering and scaling logic. It continuously analyzes the visible price range in the current window for both symbols and calculates
FREE
Risk Control Tool
Israr Hussain Shah
Here   our more valuable tools SMC Trend Trading   ,  Easy SMC Trading  ,  Institutional SMC Architect Volume Analysis Tools  ,  Volume flow Profile  ,  Market volume profile  , FVG with Volume  , Liquidity Heatmap Profile  ,  Volume Spread Analysis Overview (Short Description) A professional risk management indicator that helps traders calculate lot size, risk percentage, and reward ratio in real time. Perfect for Forex, Indices, Gold, and Synthetic Indices traders who want precise control ov
MR Volume Profile 5
Sergey Khramchenkov
The "MR Volume Profile 5" indicator is a charting tool that displays trading volume at different price levels rather than time intervals. A key concept in volume profile is the point of control (POC)—the price level with the highest volume traded during the session or time range. While tools like VWAP or OBV provide volume trends, the "MR Volume Profile 5" indicator offers granular detail about where the most market activity occurs at specific price levels. This makes it a more precise tool for
该产品的买家也购买
SMART TREND TRADING SYSTEM — 特别优惠 您的交易系统、自动化 EA,以及配套培训与支持。 以 99 美元购买适用于 MT5 的 Smart Trend Trading System,即可 免费获赠 Smart Universal Expert Advisor ,用于自动执行系统的交易信号。 STTS 将趋势方向、入场和出场信号、反转区域及重要价格水平集中呈现在图表上。您可以根据系统手动交易,也可以连接随附的 EA,按照您选择的设置自动执行交易。 当前 99 美元的价格适用于接下来的 30 次购买。此后,价格将上调至 149 美元。 您的完整产品套装 购买后,您将获得: • 适用于 MT5 的 Smart Trend Trading System。 • Smart Universal Expert Advisor — 免费赠送。 • 完整的 STTS PDF 用户手册。 • STTS 官方在线课程。 • 逐步安装与设置指导。 • 私人客户社区访问权限及支持服务。 您不仅能获得工具,还能按照清晰的步骤学习如何使用它们。 一套系统,四种交易思路 STTS
Trend Sniper X
Sarvarbek Abduvoxobov
4.9 (39)
Trend Sniper X 是一款适用于 MetaTrader 5 的多周期趋势跟踪指标,可帮助交易者清晰精准地识别趋势方向和潜在的反转点。 适用于 MT4: https://www.mql5.com/en/market/product/193245 价格信息: 当前价格为促销价,随着后续更新和新功能的推出,价格可能会有所变动。 赠品优惠: 购买后联系作者,即可免费获取该指标的 Auto-Trade Assistant EA(自动交易助手 EA)。 Code2Profit 频道 通过多时间框架分析掌控市场! 如何使用 Trend Sniper X 最大化您的胜率:核心规则与交易时段技巧 技术规格 平台 MetaTrader 5 指标类型 多时间周期趋势指标 运行时间周期 任何图表时间周期,可独立选择更高的时间周期 (M1–MN1) 主要交易品种 外汇、黄金 (XAUUSD) 及其他差价合约 (CFD) 推荐账户 任何账户类型 可视化 彩色趋势蜡烛 (买入/卖出/微弱/变化) + 买入/卖出箭头 附加模块 交易时段方框 (悉尼、东京、伦敦、纽约) 主要功能 多时间周期趋势分析: 直接在
ARIPoint
Temirlan Kdyrkhan
1 (4)
ARIPoint is a powerful trading companion designed to generate high-probability entry signals with dynamic TP/SL/DP levels based on volatility. Built-in performance tracking shows win/loss stats, PP1/PP2 hits, and success rates all updated live. Key Features: Buy/Sell signals with adaptive volatility bands Real-time TP/SL/DP levels based on ATR Built-in MA Filter with optional ATR/StdDev volatility Performance stats panel (Success, Profit/Loss, PP1/PP2) Alerts via popup, sound, push, or email Cu
SuperScalp Pro
Van Minh Nguyen
4.66 (35)
SuperScalp Pro - Professional Multi-Layer Confluence Scalping System SuperScalp Pro 是一款高级剥头皮交易指标,在经典 Supertrend 的基础上加入了多个智能确认过滤器。它可以帮助您识别概率更高的 Buy/Sell 交易机会,同时显著减少虚假信号。 清晰的 Buy 和 Sell 箭头会直接显示在图表上,基于 ATR 的 Stop Loss 和 Take Profit 水平会实时自动计算。 购买后,请联系我获取设置指导和推荐配置。 使用 SuperScalp Pro Auto Trader 轻松实现信号自动化: [Auto Trader] 下载推荐设置文件: [Set File] 完整文档请参阅产品博客: [User Guide] 加入官方频道获取最新更新: [Official Channel] SuperScalp Pro 如何工作? 只有当多个确认层同时一致时,指标才会生成交易信号(趋势 + 动能 + 成交量 + 波动率)。 您可以手动交易,也可以连接 SuperScalp Pro Auto Tr
Gann Made Easy MT5
Oleg Rodin
5 (10)
Gann Made Easy   是一个专业且易于使用的外汇交易系统,它基于使用先生理论的最佳交易原则。 W.D.江恩。该指标提供准确的买入和卖出信号,包括止损和获利水平。您甚至可以使用推送通知在旅途中进行交易。 购买后请联系我,即可免费获得交易指导和超棒的额外指标! 您可能已经多次听说过江恩交易方法。通常 Gann 的理论不仅对于新手交易者而且对于那些已经有一定交易经验的人来说都是非常复杂的东西。这是因为江恩的交易方法在理论上并不那么容易应用。我花了几年时间来完善这些知识,并将最好的原则应用到我的外汇指标中。 该指标非常易于应用。您所需要的只是将其附加到您的图表并遵循简单的交易建议。该指标不断进行市场分析工作并寻找交易机会。当它检测到一个好的入口点时,它会为您提供一个箭头信号。该指标还显示止损和获利水平。 换句话说,当您像先生一样进行交易时,该指标会为您提供最佳江恩建议。江恩亲自告诉你此时此刻该做什么。但最好的部分是您不需要了解任何有关江恩交易原则的知识,因为该指标会为您完成整个市场分析工作。
Neuro Poseidon MT5
Daria Rezueva
4.75 (52)
Neuro Poseidon is a new indicator by Daria Rezueva. It combines precise trading signals with adaptive TP/SL levels - creating best possible trades as a result! Message me and get  Neuro Poseidon Assistant  as a gift to automize your trading process! What makes it stand out? 1. Proven profitability on all assets and timeframes 2. Only confirmed BUY and SELL signals present on the chart 3. Adaptive TP & SL levels generated by the software for each trade 4. Easy to understand - suitable for al
SMC Intraday Formula
VividMind Digital Solutions
5 (26)
让我们先坦诚一点。 没有任何一个指标可以单独让你实现盈利。如果有人告诉你可以,那他是在向你兜售一个梦想。任何显示完美买卖箭头的指标都可以被做得看起来毫无瑕疵——只需要放大历史中的某一段并截取成功交易的截图。我们不会这样做。 SMC Intraday Formula 是一个工具。 它为你读取市场结构,标记出概率最高的价格区域,并用简单直白的语言准确告诉你当前智能资金的行为轨迹。你仍然需要做决定。你仍然需要执行交易。但现在,你是带着精确性执行,而不是靠希望。 我们已经在黄金(XAUUSD)以及主要外汇货币对的日内剥头皮交易中使用该指标将近三年。这是我们在 M1、M5、M15 和 M30 上的日常主力工具。它之所以有效,是因为它不试图预测未来——它展示的是当前正在形成的高概率交易机会,并解释 为什么 。 它与其他所有指标有什么不同? 大多数交易指标只做一件事。移动平均线交叉。振荡指标触及某个水平。出现一个箭头。你进场交易。你亏损。你责怪指标。重复。 SMC Intraday Formula 将多个机构级概念整合为一个统一的市场解读: - 斐波那契共振引擎 不只是普通的斐波那契水平——该指标
M1 Sniper MT5
Oleg Rodin
5 (7)
M1 SNIPER   是一款易于使用的交易指标系统。它是一个专为 M1 时间框架设计的箭头指标。该指标可以作为独立的系统在 M1 时间框架下进行剥头皮交易,也可以作为您现有交易系统的一部分使用。虽然该交易系统专为 M1 时间框架交易而设计,但它也可以用于其他时间框架。我最初设计此方法是为了交易 XAUUSD 和 BTCUSD。但我发现这种方法在其他市场交易中也同样有用。 指标信号既可以顺势交易,也可以逆势交易。我教授一种特殊的交易技巧,帮助您利用指标信号进行双向交易。该方法基于使用特殊的动态支撑位和阻力位区域。 购买后,您可以立即下载 M1 SNIPER 箭头指标。此外,我还为所有 M1 SNIPER 工具用户免费提供下方屏幕截图所示的 Apollo Dynamic SR 指标!这两个指标的组合可以帮助您更轻松、更准确地利用 M1 时间框架进行交易。 购买后请联系我,免费获取交易提示和奖励指标! 祝您交易成功!
Entry Points Pro for MT5
Yury Orlov
4.52 (151)
传奇回归:Entry Points Pro 10。 这款传奇指标曾 3 年稳居 MQL5 Market 前三,如今全面重启。 数百条热情好评(两个版本合计 589 条),每天有数千名交易者用它交易,演示版下载 31,000+   MT4+MT5  次。 五年来我读过你们的每一条评价——在第 10 版里,我没有给出许诺,而是把答案直接做进了产品。指标作者自 1999 年入市, 珍视诚信、自己的声誉和自己的客户 。 Entry Points Pro 给出的入场信号严格不重绘。 而且这一次不再只是作者的一面之词,而是可验证的事实:确认信号只在 K 线收盘后标出,自动化测试记录到 零重绘 (在 EURUSD、XAUUSD 和 BTCUSD 上共 2,486,568 次不变量检查——0 次违规)。测试方法完全公开——您可以在策略测试器中自行复现。 购买后请务必第一时间给我发私信。 我会发给您 扩展版说明书《交易者圣经》 ——使用本指标交易的完整指南——并告诉您如何免费获得 赠品:市场扫描器 ,它能同时分析多个品种和多个时间周期,并在一个界面上显示 Entry Points Pro 此刻在哪里表现
FiboSniper Pro
Van Minh Nguyen
5 (3)
FiboSniper Pro – Multi-Filter Fibonacci System with Auto SL/TP and Control Panel FiboSniper Pro 是一款技术指标,将动态 Fibonacci Envelopes 与多个确认过滤器相结合,以生成经过筛选的 Buy 和 Sell 信号。Fibonacci 水平基于 Moving Average 和 ATR 计算,然后通过 ADX、EMA、RSI、ATR、Volume、Time 和 Candle 结构进行过滤。该指标直接在图表上显示基于 ATR 自动计算的 Stop Loss 和 Take Profit 水平,并提供交互式控制面板,以便快速调整参数。 购买后,请联系我以获取推荐的设置文件和详细使用说明。 使用 Auto Trader X 自动执行 FiboSniper Pro 信号: [Auto Trader X] 用户指南和设置文件: [Click here] 加入官方频道获取最新更新: [Click here] 专为偏好结构化入场和清晰风险管理的交易者设计,适用于 Gold (XAUUSD)、B
全新王者降临 - 指标 + 订单管理提示(TP1 + TP2 + TP3)+ 可选 Telegram 信号发送器 INCLUDED(免费) (完整交易与信号系统) 我们最强的黄金 EA: Gold Slayer 该指标包含先进的交易策略、可自定义订单管理系统,以及结合 Envelope 扩展的均值回归系统,并通过 RSI 等多重智能确认过滤器进行验证,以捕捉高概率反转入场机会,提供 BUY 与 SELL 信号。 你不仅能够学习如何交易,还能学会如何高效管理多个仓位,并利用之前盈利的持仓来覆盖亏损交易。 专为 M5 周期打造并优化,在 BTCUSD 和 XAUUSD 上表现尤为出色,因为这些市场的流动性能够让信号更加干净、可靠。 该指标会自动生成清晰的多头(Long)与空头(Short)信号,同时基于 ATR 自动计算入场位、止损位和止盈位,让风险管理从一开始就融入系统之中。 多 TP 系统设有三个渐进式目标位,你可以在 TP1 锁定部分利润、在 TP2 继续持仓,并在更大的行情中将仓位持有至 TP3,而这正是平均风险回报比真正开始大放异彩的地方。 默认参数开箱即用,已经针对稳定表现进行
Auto Optimized SpeedAngle 是一款机构级的动量向量化系统,通过持续的前瞻优化(Walk-Forward Optimization, WFO)彻底消除了曲线拟合(curve-fitting)。该指标没有采用在市场 状态转换时容易失效的静态输入参数,而是利用出样外验证(Out-of-Sample, OOS) dynamically 动态重新校准设置,从而确保显示的 信号代表真正的统计优势,而非历史巧合。 核心机构级架构 前瞻优化引擎(Walk-Forward Optimization Engine): 核心算法持续扫描数千种回溯周期(lookback)与阈值组合,严格将数据划分为样本内(in-sample)和样本外(out-of-sample)。只有当参数配置在未知数据环境中证明具备数学优越性时,系统才会对其进行 adoption。 量化目标函数(Quantitative Objective Functions): 优化引擎不一味追求绝对毛利,而是聚焦于机构级的稳定性指标。用户可针对系统质量数(SQN)、期望值(每笔交易的平均 R 倍数)或净 R 值进行优化,从而优
Unix Scalper
Issam Kassas
4 (4)
UNIX SCALPER — 特别优惠 发现交易形态,看清交易计划,选择执行方式。 以 99 美元购买适用于 MT5 的 UNIX Scalper,即可免费获赠 Smart Universal Expert Advisor,用于自动执行指标的交易信号。 UNIX Scalper 将市场分析、BUY/SELL/WAIT 决策以及 Entry、Stop Loss、TP1 和 TP2 水平集中在一个清晰的面板中。您可以按照交易计划手动交易,也可以连接随附的 EA,按照您选择的设置自动执行交易。 当前 99 美元的价格适用于接下来的 30 次购买。此后,价格将上调至 149 美元。 您的完整产品套装 购买后,您将获得: • 适用于 MT5 的 UNIX Scalper。 • Smart Universal Expert Advisor — 免费赠送。 • 完整的 UNIX Scalper PDF 用户手册。 • UNIX Scalper 官方在线课程。 • 逐步安装与设置指导。 • 私人客户社区访问权限及支持服务。 您不仅能获得工具,还能按照清晰的步骤学习如何使用它们。 看清信号与交
Welcome to ENTRY IN THE ZONE AND SMC MULTI TIMEFRAME / SPECIAL BENEFIT FOR OUR MQL5 CUSTOMERS  FREE ACCESS TO THE NEW TOOL —COMING SOON —   Learn More on Our Official Website : https://www.fableedge.net Entry In The Zone and SMC Multi Timeframe is a real-time market analysis tool based on Smart Money Concepts (SMC), designed to analyze market structure, price direction, and key trading zones. It supports both Single-Timeframe Analysis and Multi-Timeframe Analysis, providing a clearer view of the
Tokyo mt5 Indicator
Vasiliy Strukov
5 (2)
Tokyo Indicator(东京指标)直观地展示了趋势方向、潜在交易信号及市场状况。 其采用颜色编码的阶梯式趋势线,以蓝色标识看涨阶段,以洋红色标识看跌阶段。配套的方向箭头会在趋势发生变化时,标示出潜在的买入与卖出机会。 内置的综合仪表盘将当前信号、市场倾向、动能、波动率及信号质量整合于同一视图中,方便交易者在观察价格走势的同时评估指标数据,无需在不同面板间切换。 凭借清晰的图表显示和简洁的市场概览,Tokyo Indicator 支持以系统化的方式进行趋势分析与交易确认。 适用于任何时间周期及各类交易品种,尤其适合黄金交易。 购买后请立即联系我,以获取专属赠品!您可以免费获得我们的“强力支撑与趋势扫描”(Strong Support and Trend Scanner)指标,请私信我! 设置说明与使用手册请见此处。 请注意:我不会在 Telegram 上出售我的 EA 或特殊参数设置(set files);我的 EA 仅在 Mql5 平台上提供,而参数设置文件仅在我的博客(此处链接)上发布。请务必警惕诈骗,切勿从他人处购买任何参数设置! 设置 ShowHUD —— 在图表上显示
Atomic Analyst MT5
Issam Kassas
4.47 (60)
ATOMIC ANALYST — 特别优惠 您的市场分析工具、自动化 EA,以及配套培训与支持。 以 99 美元购买适用于 MT5 的 Atomic Analyst,即可 免费获赠 Smart Universal Expert Advisor ,用于自动执行指标的交易信号。 Atomic Analyst 将价格行为、趋势方向、入场和出场信号、止损位及多个止盈位集中呈现在图表上。您可以参考其分析手动交易,也可以连接随附的 EA,按照您选择的设置自动执行交易。 当前 99 美元的价格适用于接下来的 30 次购买。此后,价格将上调至 149 美元。 您的完整产品套装 购买后,您将获得: • 适用于 MT5 的 Atomic Analyst。 • Smart Universal Expert Advisor — 免费赠送。 • 完整的 Atomic Analyst PDF 用户手册。 • Atomic Analyst 官方在线课程。 • 逐步安装与设置指导。 • 私人客户社区访问权限及支持服务。 您不仅能获得工具,还能按照清晰的步骤学习如何使用它们。 看清信号,理解交易形态 Atom
SMART PRICE ACTION CONCEPTS — 特别优惠 看清结构,识别区域,制定交易计划。 以49美元购买MT5版Smart Price Action Concepts,即可免费获得Smart Universal Expert Advisor。 在一张清晰有序的图表中整合Smart Money Concepts(SMC)、ICT风格分析与价格行为分析。识别市场结构、订单块、流动性参考价位和失衡区域,再通过Smart Panel选择要显示的内容。 当前49美元的价格适用于接下来的30笔购买。之后价格将上调至100美元。 完整套餐 • MT5版Smart Price Action Concepts。 • Smart Universal Expert Advisor — 免费赠品。 • 完整PDF用户手册及官方在线课程。 • 分步骤安装和设置指导。 • 私人客户社区访问权限及支持服务。 工具、培训和清晰的入门指引,均包含在购买中。 更有条理地分析市场 • 市场结构:内部与波段结构、HH/HL/LL/LH、BOS与CHoCH、高周期分析及多周期仪表板。 • 关键区域:内
Power Candles MT5
Daniel Stein
4.58 (12)
Power Candles V3 - 自我优化的强度指标 Power Candles V3 把货币与品种的强度直接转化为图表上可执行的交易方案。指标不再仅根据强度给K线着色,而是在后台持续运行实时自动优化,为您正面对的品种给出最佳 Stop Loss、Take Profit 与信号阈值。一键采用,Entry、Stop Loss、Take Profit 线就以精确价格绘制在图表上,提醒消息中直接包含方向。 本工具是 Stein Investments 生态系统的一部分 - 18+ 款工具,加上 Max,您的一对一 AI 交易导师。  随时在线,深入了解每一款指标,在您需要梳理思路的那一刻就在那里。  立即认识他: https://stein.investments 每根收盘K线运行 3,000+ 次交易模拟。9 种强度状态。2 种策略并行测试。一键采用最优配置。 为什么需要这个 大多数强度指标只给您一个数值,然后留下三个问题:相信哪个阈值、用哪个 Stop Loss、走哪个交易方向。Power Candles V3 在每根收盘K线上自动回答这些问题。结果就是一个完整的交易方案 -
FX Trend MT5 NG
Daniel Stein
5 (6)
FX Trend NG:新一代多市场趋势智能分析工具 概述 FX Trend NG 是一款专业的多时间周期趋势分析与市场监控工具,帮助您在几秒钟内全面了解市场结构。 无需在多个图表之间来回切换,您可以立即看到哪些品种处于趋势中、哪里动能正在减弱,以及哪些时间周期之间存在强烈共振。 限时发布优惠 – 仅需 $30(6个月) 或 $80 终身授权 即可拥有 FX Trend NG 。 已经是 Stein Investments 客户? -> 发送消息 以获取专属客户群访问权限。 需要帮助或安装指导? -> 请访问 Stein Investments 官方页面 。 1. FX Trend NG 的核心优势 三状态趋势逻辑 —— 不只是 Buy 或 Sell • 大多数指标仅显示两种状态:Buy 或 Sell。 • FX Trend NG 增加第三种状态: Fade 。 • Fade 表示趋势强度正在减弱,在完全反转之前提前发出信号。 这种结构化逻辑让您看到趋势变化过程,而不仅仅是简单方向信号。 多时间周期分析(M1 至 MN1) • 从短线交易到中长线交易全面覆盖。 • 快速识别趋势
Adaptive Price Action Engine 买指标,免费送EA 自适应多时间框架趋势与K线形态智能分析系统 市场环境始终在变化,不同的市场阶段中,并非所有 Price Action 形态都具有相同的参考价值。 Adaptive Price Action Engine 旨在适应不断变化的市场条件,将 趋势结构、多时间框架分析、K线形态与统计优化 整合到一个统一的分析框架中。 两种自适应模式 Dual Alpha Trend Mode(双 Alpha Trend 模式) 自动搜索适合的 Alpha Trend 参数,并结合低周期与高周期市场结构,使指标能够根据近期市场行为动态调整趋势识别。 Candlestick + Alpha Mode(K线 + Alpha 模式) 将 Alpha Trend 市场状态与 22种多空K线形态 相结合。系统不会简单地对所有形态一视同仁,而是对不同的形态组合进行统计评估,并识别在特定市场环境下表现出更强历史统计特征的配置。 主要功能 趋势参数自动优化 多时间框架市场状态分析 22种多头与空头 Price Action K线形态 对数千种可能
FX Power MT5 NG
Daniel Stein
5 (33)
FX Power:分析货币强度,助您做出更明智的交易决策 概述 FX Power 是一款专业工具,帮助您全面了解主要货币和黄金在任何市场条件下的真实强度。通过识别强势货币用于买入,弱势货币用于卖出, FX Power 简化了交易决策,并帮助您发现高概率的交易机会。不论您是想跟随趋势还是通过极端的 Delta 值预测反转,这款工具都能完美适应您的交易风格。别再盲目交易——用 FX Power 让您的交易更加智慧。 1. 为什么 FX Power 对交易者极具价值 实时货币和黄金强度分析 • FX Power 实时计算并显示主要货币和黄金的相对强度,助您全面了解市场动态。 • 监控领先或落后资产,轻松识别值得交易的货币对。 全面的多时间框架视图 • 跟踪短期、中期和长期时间框架的货币和黄金强度,以便将您的交易策略与市场趋势保持一致。 • 无论是快进快出的短线交易还是更长期的投资策略, FX Power 都能为您提供所需的信息。 Delta 动态分析用于趋势和反转 • 极端 Delta 值常常预示反转机会,而平缓的 Delta 变化则确认趋势延续。 • 使用 Delta 分析,轻
Market Structure Order Block Dashboard MT5 是一款专为希望直接在图表上解读市场结构和主要价格反应区域的交易者设计的MT5指标。它结合了BOS、ChoCH、订单块(Order Blocks)、公允价值缺口(FVG)、流动性、Kill Zones、成交量分布图以及一个紧凑的面板,便于快速分析。 本指标面向使用市场结构、ICT和Smart Money概念作为决策框架的交易者。它可以帮助以更结构化的方式识别趋势延续、可能的反转、价格失衡、流动性目标和关注区域。 面向买家的资源 购买后可通过MQL5私信申请获取完整的PDF使用指南和参数配置建议。通过MQL5私信提供直接技术支持。 1.20版本带来两项重要新增: Pending BOS / Pending ChoCH 检测 和 可拖动面板 (按住面板标题栏即可将其拖动到图表任意位置,不影响图表本身)。当K线收于前一摆动点之外时,Pending Breaks 立即显示待确认的结构突破,无需等待经典的摆动确认。 重要 本产品仅为指标。它不会自动开仓、平仓或管理仓位。它不是EA(智能交易系统)。 主要功能 市场
货币强度向导是一个非常强大的指标,为您提供成功交易的一体化解决方案。该指标使用多个时间范围内所有货币的数据来计算这个或那个外汇对的力量。此数据以易于使用的货币指数和货币电力线的形式表示,您可以使用它们来查看这种或那种货币的力量。 您所需要的只是将指标附加到您要交易的图表上,该指标将向您显示您交易的货币的真实强度。该指标还向您显示买卖量压力的极值,您可以在顺势交易时利用这些压力。该指标还显示了基于斐波那契的可能目标。该指标可用于各种交易时间范围。该指标支持各种货币对的交易。   该指标为您提供所有类型的警报,包括推送通知。 购买后请联系我。我将与您分享我的交易技巧,并免费为您提供丰厚的红利指标! 祝您交易愉快,获利丰厚!
M1 Quantum MT5
Hamed Dehgani
4.2 (10)
使用 M1 Quantum 的实盘交易信号 : 信号 (交易由 Quantum Trade Assistant 自动 执行,并作为本产品 免费 提供。) 最新消息: 版本 1.64 已发布。现在所有交易的止损都会设置在相应的支撑位/阻力位之后。Smart Close 功能也进行了改进,以提升此版本 EA 的性能。 自 8 月 9 日起,实盘信号一直运行在版本 1.64 上。 价格计划: 当前价格: $169 (早期用户优惠) 下一阶段计划价格: $189 计划零售价: $299 开发者提示: 购买后请联系我,以获取 最新推荐的参数设置文件(Set File) 、交易建议,以及加入 VIP 支持群组 ,与其他 M1 Quantum 用户交流经验。 常见问题 - 设置文件 - 安装指南 M1 Quantum 是一款专业的 M1 交易系统,提供快速且精准的交易信号,并内置止损(Stop Loss)、止盈(Take Profit)以及智能资金管理功能。 M1 Quantum 包含专业的资金管理系统,通过专注于 连续盈利交易 ,帮助交易者更快地增长账户资金。 M1 Quantum 指标 的主
PZ Trend Trading MT5
PZ TRADING SLU
3.8 (5)
许多盈利交易者不仅知道如何识别市场趋势,而且也能把握趋势建立后的交易机会。 Pz 趋势交易 指标设计用来在趋势行情中尽可能的赚取利润。 已建立的趋势提供了一揽子交易机会,但大多数趋势交易指标完全忽视了它们,让交易者在趋势行情时完全不知道该如何做!一般趋势指标只通知有关的趋势变化,但根本不足以得到卓越的回报. Pz 趋势交易 指标比一般趋势指标显示多达 20 倍的交易 , 因为它注重所谓的市场时机。它不仅显示当前的市场趋势,也有回调,内柱线的突破和调整。它令您在趋势回调之后介入,安全的柱线内突破金字塔加仓,以及发现潜在的反转,和已知的调整。 趋势改变 一个趋势改变在市场方向变化时发生。趋势变化在图表上用带数字的彩色圆圈显示。蓝色 (1) 信号为上涨开始, 而红色 (1) 信号为下跌开始。趋势变化并非评估当前价格动作的结果, 它意味着交易设置是不定时地。如果您正确使用本指标, 在趋势变化时, 您将将已经入场 (参看下面的调整)。 回调 但凡趋势在运动中,行情上下抖动,盈利者收割利润,且其它参与者入场。趋势回调代表好的买入机会,通常是由主力获利离场导致。如果行情在回调后回归上行, 指标将
Scalper Vault   是一个专业的剥头皮系统,为您提供成功剥头皮所需的一切。该指标是一个完整的交易系统,可供外汇和二元期权交易者使用。推荐的时间范围是 M5。 该系统为您提供趋势方向的准确箭头信号。它还为您提供顶部和底部信号以及江恩市场水平。无论您拥有何种交易经验,该系统都易于使用。您只需要遵循简单的规则并每天重复该过程。 建议将此系统用于主要货币对。感谢您的关注! 请注意,该指标在策略测试器中可能无法正常工作。因此,我建议仅在模拟或真实账户的真实交易条件下使用该系统。 指示器提供所有类型的警报,包括推送通知。 购买指标后请与我联系。我将免费与您分享我的个人交易建议和出色的奖励指标! 祝您交易愉快,盈利!
Smc Pro ToolKit
Talal N Z Aljarusha
5 (13)
SMC PRO TOOLKIT — 智能资金分析与结构化交易规划 SMC Pro ToolKit 是一款面向 MetaTrader 5 的专业智能资金概念(Smart Money Concepts / SMC)分析工作空间。 它将市场结构、多周期分析、机构级价格区域、交易机会评估、确认工具、成交量背景、提醒系统和风险规划整合在一个结构清晰的图表环境中。 一个工作空间,多层确认,一套结构化交易计划。 打开完整用户指南 多条件交易机会引擎 SMC Pro ToolKit 的核心是一套 多条件交易机会引擎 。 该引擎不会依赖单一指标或单一市场事件,而是通过多个层面的市场信息,对潜在交易机会进行综合评估。 系统会分析市场结构和背景条件,将各项结果整合为 交易机会质量评分 ,并且只有在所需确认框架完整成立后,才会展示相应的交易思路。 市场背景 → 多周期一致性 → 智能资金区域 → 确认信号 → 质量评分 → 交易计划 当交易机会满足条件时,SMC Pro ToolKit 可以直接在图表上生成完整的交易计划,包括: 买入 / 卖出方向 入场价 止损价 止盈价 风险回报比 交易机会质量
Divergence Bomber
Ihor Otkydach
4.89 (94)
购买该指标的每位用户将额外免费获得以下内容: 原创工具“Bomber Utility”,该工具会自动跟踪每一笔交易,设置止损和止盈点,并根据策略规则自动平仓; 适用于不同交易品种的指标设置文件(Set 文件); 三种不同风险模式下的 Bomber Utility 设置文件:“最低风险”、“平衡风险” 和 “观望策略”; 一套详细的 视频操作手册,帮助您快速完成安装、配置并开始使用本交易系统。 注意: 要获取以上所有赠品,请通过 MQL5 的私人消息系统联系卖家。 我为您介绍原创的自定义指标 “Divergence Bomber”(背离轰炸机),它是一套基于 MACD 背离交易策略 的“全功能”交易系统。 该技术指标的主要任务是识别 价格与 MACD 指标之间的背离,并发出交易信号(包括推送通知),指示未来价格可能的运动方向。平均而言,这些信号的准确率超过 98%。有关该指标如何工作的详细说明,请观看本页面上的视频演示。 该系统使用 止损订单 和 动态回撤平仓机制 来管理交易。 Divergence Bomber 指标的主要特点: 支持交易的品种: AUDCAD、AUDCHF、AUDS
Axiom Matrix
Issam Kassas
5 (8)
Axiom Matrix — 特别优惠 以 49 美元购买 Axiom Matrix,免费获赠 Smart Universal Expert Advisor。 扫描市场。比较机会。选择下一张图表。 Axiom Matrix 将多品种、多周期分析整合到一个面板中。无需逐一检查所有图表,即可找到值得关注的市场。 扫描市场报价中的品种或自选品种,覆盖多个周期。 比较趋势、动量、成交量、波动率及市场质量信息。 通过 Best Axiom Pick、信号状态及可点击单元格查看交易机会。 Axiom Matrix 是分析面板,不执行交易。 您的产品组合 Axiom Matrix Smart Universal Expert Advisor PDF 用户手册和在线课程。 设置指导及客户社区访问权限。 Smart Universal Expert Advisor 是独立赠品,并不承诺可直接自动执行本产品的分析结果。 查看截图,了解界面,并阅读客户评价。 简单三步即可开始 在 MQL5 购买 Axiom Matrix。 在 MQL5 给我发送私信。 获取免费的 Smart Universal Exper
IX Power MT5
Daniel Stein
4.92 (13)
IX Power:解锁指数、大宗商品、加密货币和外汇市场洞察 概述 IX Power 是一款多功能工具,可分析指数、大宗商品、加密货币和外汇市场的强弱表现。 FX Power 提供针对货币对的最高精度,利用所有可用货币对数据进行分析,而 IX Power 专注于基础资产的市场数据。这使得 IX Power 成为非外汇市场的理想选择,同时在需要简单外汇分析时也非常可靠。它可以无缝适用于任何图表,提供清晰的、有行动价值的洞察,帮助提升您的交易决策。 1. 为什么 IX Power 对交易者非常有价值 多市场强弱分析 • IX Power 分析指数、大宗商品、加密货币和外汇市场的强弱表现,为每个市场提供量身定制的洞察。 • 监控 US30、WTI、黄金、比特币等资产的表现,发现交易机会。 适用于更广泛的市场 • 对于外汇交易, FX Power 提供无与伦比的精度,通过分析所有相关货币对。 • IX Power 专注于基础资产的市场数据,非常适合非外汇市场及简化的外汇分析。 实时适应性 • 借助自适应算法, IX Power 实时响应市场数据变化,保持分析的最新性。 • 实时更新
作者的更多信息
Crystal Heikin Ashi
Muhammad Jawad Shabir
4.72 (36)
CRYSTAL AI PRO v7.21 — MT5 智能交易系统(EA) 概述 适用于 XAUUSD(黄金) 与主要外汇品种的自动交易系统;管理入场、SL/TP、跟踪止损与回撤控制,遵循规则执行。不承诺盈利;请阅读风险提示。 运行要求 平台:MetaTrader 5 账户类型:ECN/RAW 推荐 连接:24/7 运行(建议 VPS) 周期:M1–H4 初始设置 启用 Algo Trading 。 将 EA 挂到图表(每个品种单独图表)。 在 Inputs 中设置 AI_Access_Mode = ON ,然后重新加载 EA。 根据资金/杠杆/经纪商条件调整风险参数。 建议条件 充足保证金与稳定执行(低点差/低延迟)。 黄金建议起始资金 $5,000+ (1:500);多品种交易时降低风险。 先在模拟或 cent 账户验证。 核心功能 规则化入场与 SL/TP 、 保本 、 跟踪止损 。 回撤控制 :在劣势阶段降低交易频率。 多品种支持(每品种一张图表)。 适配不同波动与交易时段。 在模拟/cent 账户可完整评估逻辑。 Inputs(要点) AI_Access_Mode 开启完
FREE
Crystal Heikin Ashi Pro
Muhammad Jawad Shabir
Crystal Heikin Ashi Pro Ultimate - Professional Trading Automation System Revolutionary Dual-Mode Trading Strategy with Advanced Risk Management Crystal Heikin Ashi Pro Ultimate represents the pinnacle of automated trading technology, combining the proven effectiveness of Heikin Ashi candle analysis with cutting-edge algorithmic trade management. This sophisticated Expert Advisor is designed for serious traders who demand precision, reliability, and professional-grade automation in their trading
Crystal Heikin Ashi Signals
Muhammad Jawad Shabir
5 (4)
Crystal Heikin Ashi Signals—Professional Trend & Signal Detection Indicator Advanced Heikin Ashi Visualization with Intelligent Signal System for Manual & Automated Trading Final Price: $149 ---------> Price goes up $10 after every 10 sales . Limited slots available — act fast . Overview User Guide PDF Crystal Heikin Ashi Signals is a professional-grade MetaTrader 5 indicator that combines pure Heikin Ashi candle visualization with an advanced momentum-shift detection system. Designed for both m
Crystal Volume Profile Auto POC
Muhammad Jawad Shabir
4.45 (20)
Crystal Volume Profile Auto POC — 精准交易的成交量分布分析工具 概述 Crystal Volume Profile Auto POC 是一款 MetaTrader 5 指标,用于显示成交量分布并自动标记控制点 (POC)。它帮助交易者识别关键支撑与阻力区域,揭示市场中成交量最集中的价格水平。 主要功能 动态成交量分布(适用于可见图表区域或自定义区间) 自动检测 POC(成交量最大的价格水平) 可自定义直方图大小、颜色和线型 固定区间成交量分析 支持实时更新(每根K线自动刷新) 内置按钮:Reset VP(重算分布)和 Hide VP(隐藏/显示) 支持浅色和深色背景 优势 识别市场累积与分布区 揭示机构资金活跃的关键区域 提高入场和出场的时机选择 适用于突破与反转交易策略 使用方法 将指标加载到任意图表 使用 Reset VP 计算可见区间分布 拖动垂直线可手动选择范围 使用 Hide VP 隐藏或显示分析结果 兼容性 平台:MetaTrader 5 市场:外汇、股票、加密货币、指数 时间周期:全部支持 优化结构,降低 CPU 占用 关键词 成交量
FREE
Crystal Quantum Flow
Muhammad Jawad Shabir
4.86 (7)
Crystal Quantum Flow 高级市场智能分析指标 Crystal Quantum Flow 是一款新一代专业交易指标,专为追求清晰度、精准度和机构级市场洞察的交易者而设计。 该指标被构建为完整的决策支持系统,将多维度市场流分析、多时间周期同步以及高级可视化解释整合到一个强大的图表环境中。 Crystal Quantum Flow 的内部架构完全专有并受到保护。 所有分析模型均作为封闭系统运行,并非基于常见的零售指标或公开公式。 核心理念 Crystal Quantum Flow 将市场行为解读为持续的压力、动量和方向主导流,而不是孤立的价格波动。 它不会对市场噪音做出反应,而是专注于已确认的市场状态和转换,帮助交易者始终与主导力量保持一致。 所有信号仅基于已确认的价格数据生成。 不存在重绘行为。 主要功能 非重绘信号引擎 所有买入和卖出信号仅在蜡烛收盘后确认 历史信号保持固定不变 适用于回测、前向测试和实盘交易的一致性 量子流蜡烛 高级蜡烛显示模式,增强趋势清晰度 可在专有蜡烛和标准蜡烛之间切换 用于过滤市场噪音并突出真实方向 智能趋势流线 根据市场条件自适应变
FREE
Crystal Volume Profile Auto POC MT4
Muhammad Jawad Shabir
5 (5)
Crystal Volume Profile Auto POC (MT4) — 自动POC成交量剖面指标 概述 Crystal Volume Profile Auto POC 是一款轻量化、性能优化的 MetaTrader 4 指标。它通过可视化成交量分布来帮助交易者识别市场关键价位,并自动标记成交量最大的价格水平 (POC)。该工具揭示了隐藏的支撑/阻力区域、机构交易活动和累积/分配区域。 另有 MT5 版本: Crystal Volume Profile Auto POC (MT5) 。 主要功能 自动POC检测 动态成交量分布 (可见范围或自定义区间) 固定剖面选项用于详细分析 灵活设置直方图大小、颜色和线条样式 每根K线实时更新 内置按钮:Reset VP 和 Hide VP 自动适配浅色/深色主题 为什么使用本指标? 快速识别累积与分配区域 找到高成交量突破/反转区 跟踪机构资金活动 将POC用作精确进出场的参考 提高反转与延续策略的准确性 使用方法 (MT4) 将指标加载到图表 点击 Reset VP 生成剖面 使用 Hide VP 开关显示 拖动垂直线设定分析区间 观
FREE
Crystal Supply Demand Indicator
Muhammad Jawad Shabir
5 (4)
Crystal Supply Demand Pro (SD Pro) 不要在每根K线中交易 – 等待机构级别的供需区间. Crystal Supply Demand Pro (SD Pro) 是一款适用于 MetaTrader 5 的专业供需区间指标。 它为希望在图表上看到 干净、机构级别的区间 的交易者而设计,而不是杂乱无章的方框。 通过高时间框架优化、动态更新和专业视觉效果,SD Pro 确保您的图表只显示真正重要的水平。 功能特点 机构级供需区检测。 区分“新鲜”与“已测试”区域。 针对 H1, H4, D1, W1 优化。 实时更新,无重绘。 专业可视化(颜色、透明度、50%中线、标签)。 实时统计面板。 时间框架提醒系统。 高效轻量运行。 为什么选择 SD Pro? 大多数供需指标会在图表上充满随机区域。 SD Pro 只过滤真正有意义的区域,并以专业方式呈现。 用户指南 购买后,您将获得完整的使用指南,包括: 设置与参数推荐。 入场策略(触及区间、50%中线回调、共振方法)。 风险管理技巧。 风险免责声明 此指标仅为技术分析工具。 不保证利润,交易存在风险。 强烈建议在真
FREE
Crystal Heikin Ashi MT4
Muhammad Jawad Shabir
4 (2)
Crystal Heikin Ashi – 高级可视化 Heikin Ashi (MT4 版本) 概述 Crystal Heikin Ashi for MetaTrader 4 是一款专业级别的 Heikin Ashi 指标,为价格行为交易者、剥头皮交易者和分析师提供清晰的图表可视化。 此 MT4 版本专注于纯净的 Heikin Ashi 蜡烛与智能样式,同时保持轻量化和高速性能。 提示: 趋势着色和高级动能检测仅在 MT5 版本提供: MT5 版本 → https://www.mql5.com/en/market/product/142042 主要功能 (MT4) 原生 Heikin Ashi 蜡烛。 可自定义多头/空头颜色。 可隐藏默认蜡烛。 支持浅色/深色主题。 高速计算,适合长周期历史。 清晰显示价格走势和反转。 参数 蜡烛样式:标准。 图表主题:浅色/深色。 适合人群 价格行为交易者。 剥头皮交易者。 希望在 MT4 使用简洁 Heikin Ashi 图表的交易者。 风险提示 该指标仅为技术可视化工具,不提供投资建议,也不能保证盈利。请在模拟账户测试后再用于真实交易,并做好风
FREE
Crystal Buy Sell Liquidity — MT5流动性扫单指标 概述 Crystal Buy Sell Liquidity 是一款专业的 MetaTrader 5 指标,用于识别基于流动性扫单模式的高概率买卖机会。该指标分析日内市场结构,检测机构的流动性狩猎行为,并在零售流动性被扫后出现价格反转时提供清晰信号。 主要功能 自动检测高点/低点的流动性扫单 反转确认后生成买卖信号 融合 SMC (Smart Money Concepts) 思路 日内结构分析(会话高低点) 推荐在 H1、M15、M5 时间框架使用 简洁清晰的图表显示 工作原理 识别价格突破会话高/低点 检测零售流动性被吸收后的反转条件 生成买卖信号 使用方法 将指标加载到 MT5 图表 选择时间周期(M5、M15、H1) 关注会话高低点附近的信号 与市场结构或订单流结合使用 兼容性 平台: MetaTrader 5 市场: 外汇、指数、大宗商品、加密货币 时间周期: 推荐 H1, M15, M5 轻量化设计 关键词 流动性指标, buy sell liquidity MT5, 智能资金, 流动性扫单,
FREE
Crystal Smart Pro
Muhammad Jawad Shabir
4 (2)
Crystal Smart Pro — 自适应双模式智能交易系统 概述 Crystal Smart Pro 是由 Crystal AI Systems 开发的智能自适应型 MT5 智能交易系统(Expert Advisor) 。 该系统将精准入场与先进的恢复算法相结合,提供两个独立的工作模式: Sharp 模式 和 Smart 模式 。 系统会根据市场波动性、账户资金以及趋势状况进行动态调整,从而保持稳定的表现和风险控制。 核心交易模式 Sharp 模式 – 精准与速度 • 基于 MACD 趋势变化执行单向交易。 • 内置动态利润保护机制与即时止损逻辑。 • 适合喜欢“一次入场,一次出场”简洁操作的日内交易者。 Smart 模式 – 自适应恢复与目标利润管理 • 采用高级恢复算法,逐步增加仓位以优化收益。 • 支持基于 MACD 或 MACD 背离信号的智能加仓机制。 • 达到预设美元利润目标后,自动关闭全部恢复交易循环。 主要功能特点 • 双模式运行:Sharp(单笔交易)与 Smart(多阶段恢复)。 • 固定手数或基于权益(Equity-Based)自动计算手数。 • 动态追
FREE
Crystal Smart Volume
Muhammad Jawad Shabir
5 (4)
Crystal Volume Indicator — 智能成交量分析工具 (MT5) 概述 Crystal Volume Indicator 是一款用于 MetaTrader 5 的高级成交量分析工具。它结合价格行为与成交量动态,识别关键的成交量事件,如买入高潮、卖出高潮以及低量蜡烛,帮助交易者发现潜在的反转或延续区域。 主要功能 支持 Tick Volume 与 Real Volume(取决于经纪商) 彩色直方图分类成交量事件 自动识别买入高潮与卖出高潮 低成交量蜡烛检测 可选成交量均线 (MA) 自定义回溯周期 (Lookback Window) 按蜡烛方向着色(看涨/看跌/中性) 成交量事件分类 买入高潮 — 极高成交量,收盘接近最高点 卖出高潮 — 极高成交量,收盘接近最低点 弱势蜡烛 — 处于回溯周期内的最低成交量 相对高成交量 — 与蜡烛区间相比显著偏高 中性柱 — 普通成交量,无明显倾向 高级功能 (版本 4.3) 六色成交量分类系统 TradingView 风格的显示模式 实时 Volume Delta 买卖压力分析 DOM 深度盘口面板 模式识别:TBR、STBR
FREE
Crystal FVG Touch Detector – 智能资金概念高级指标 Crystal FVG Touch Detector 是为使用 Smart Money Concepts (SMC) 与 ICT 方法的专业交易者设计的高性能指标。 它能自动检测任何周期或品种的 Fair Value Gaps (FVG),并通过颜色区域与触碰检测清晰显示在图表上。 采用无重绘算法和高效结构,实时识别机构失衡区间。 主要特点 精准检测多空 FVG 区域。 实时跟踪价格触碰并自动更新。 多时间框架兼容并显示提醒。 自动配色适配深浅主题。 高效、稳定、无延迟。 参数全面可调。 关键词: FVG, 公允价值缺口, Smart Money Concepts, SMC, ICT, 订单块, 不平衡, 流动性, 机构交易, 供需, 不重绘, 成交量价差分析, 市场结构, 结构突破, CHoCH, BOS, 流动性清扫, 外汇指标, 黄金交易, MT5 指标, 剥头皮, 波段交易.
FREE
CRYSTAL HEIKIN ASHI SIGNALS MT4 Professional Trend Detection Indicator with Smart Entry Signals See the Trend. Catch the Move. Trade with Confidence. The professional Heikin Ashi indicator built for traders who want clarity, precision, and EA-ready signal automation. WHAT IS CRYSTAL HEIKIN ASHI SIGNALS? Crystal Heikin Ashi Signals is a professional-grade MetaTrader 4 indicator that combines pure Heikin Ashi candle visualization with an advanced momentum-shift detection system. Designed for both

Crystal Trade Manager
Muhammad Jawad Shabir
4.25 (4)
Crystal Trade Manager – 全能交易控制中心 概述 Crystal Trade Manager (CTM) 是一款 MetaTrader 5 风险管理与即时交易执行工具。集成风险保护、自动化和交易控制,适合手动交易者、挑战 prop firm 的交易者以及 专业资金管理者。 核心功能 风险保护 :每日回撤限制 (1–70%) ,自 动平仓,挂单删除,每日锁定 (FTMO 规则兼容 ) 。 盈 亏目 标 :自 动平仓达到的利润 / 亏 损目标。 自 动 SL/TP :新 订单自动附加 SL/TP 。 保本保 护 :到达盈利后自 动移动至 BE+ 缓冲。 移 动止损 : 动态跟随止损。 手数控制 : 设定最大手数,超出自动部分 / 全部平 仓。 快捷操作面板 : 6 个按 钮 ( 平 50% , 转 BE ,平全部, 删挂单,加倍仓位, Profit Shield) 。 信息面板 :余 额、净值、浮盈亏、当日盈亏 % 、 风险暴露、回撤。 通知系 统 :横幅、推送、声音提醒。 安全 逻辑 : 检测锁仓违规, pip 精度,重启恢复。 适用人群 Prop firm 交
FREE
Trend X Pro
Muhammad Jawad Shabir
5 (1)
TREND-X Pro — Professional Smart Money Concepts Indicator for MetaTrader 5 Trade the trend. Let the market lead. Win with structure. Retail traders guess. Institutions read structure. That single difference decides who takes the move and who chases it. Every session, price leaves a trail: a break of structure, a shift in character, liquidity taken, an imbalance left behind. Professionals build their entire decision around that trail. Most traders never see it — not because they cannot learn it,
Crystal Smart Volume MT4
Muhammad Jawad Shabir
5 (2)
Crystal Smart Volume 概述 Crystal Smart Volume 是一款专为 MT4 平台开发的高级成交量与 Delta 分析指标,用于揭示隐藏在普通价格波动背后的机构交易活动。 它结合了 Smart Money Concepts (SMC) 、 Volume Spread Analysis (VSA) 和 Delta 逻辑 ,以同时分析价格与成交量的行为。 该指标能够识别关键市场事件,例如 Buying Climax(买入高潮) 、 Selling Climax(卖出高潮) 、 Weak Candles(弱势蜡烛) 以及 High-Volume Reversals(高成交量反转) ,帮助交易者精确捕捉市场的潜在转折点。 系统内置 TBR(Trap Break Reversal) 、 STBR(Sweep Trap Break Reversal) 与 EVR(Engulf Volume Reversal) 等反转形态识别模块,同时包含专业的六色成交量柱状图和实时 Delta 计算。 该指标拥有简洁直观的图形界面与极低的 CPU 占用率,非常适合专业日内交易员及依
FREE
The Real RSI – 专业级背离识别指标 概述 The Real RSI 是一款面向专业交易者的 RSI 背离识别指标,旨在以机构级精度识别基于 RSI 的反转和趋势延续信号。 它能够自动检测价格与 RSI 之间的 常规背离 和 隐藏背离 ,并通过智能枢轴逻辑与实时结构验证来确认每一个信号。 该指标以高精度、稳定性和实战性能为目标而设计,在真实市场环境中运行时 无重绘、无信号延迟 。 如果您希望基于这些信号实现自动化交易,可使用以下版本: The Real RSI BOT – Auto Divergence Trading EA 核心功能 1. 自动背离检测 • 自动识别常规与隐藏背离,支持多空两种结构。 • 适用于所有时间周期及品种,包括外汇、黄金、指数与加密货币。 • 同时识别反转型与趋势延续型结构。 2. 智能枢轴识别系统 • 通过左右柱逻辑自动定位高概率拐点。 • 可调节最小与最大枢轴间距,提升精确度与计算效率。 • 非重绘算法,仅基于已确认的枢轴生成信号。 3. 实时与历史扫描引擎 • 渐进式历史加载算法,提升图表响应速度。 • 实时扫描新K线,确保信号即时更新。 •
FREE
Crystal MTF Candle Pro
Muhammad Jawad Shabir
5 (1)
Crystal MTF Candle Pro – Professional Multi-Timeframe Analysis Tool Overview Crystal MTF Candle Pro is a professional indicator for MetaTrader 5, designed to provide direct visualization of higher timeframe candles on the current chart. The tool overlays selected higher timeframe candles with precise countdown timers, allowing traders to monitor live candle development without switching charts. This indicator is optimized for multi-timeframe (MTF) analysis, offering professional styling, custo
FREE
Auto Candle Sequence Counter
Muhammad Jawad Shabir
5 (1)
Auto Candle Sequence Counter – MT5指标 概述 Auto Candle Sequence Counter 是一款专业的 MetaTrader 5 指标,可以自动检测并标记连续的多头/空头K线序列。该工具提供实时可视化、统计和提醒,帮助交易者快速分析价格动能和趋势。 主要功能 检测2–7根连续K线(看涨或看跌)。 实时信号,无遗漏。 Doji检测(灵敏度0.01–0.10可调)。 过滤弱势/噪音K线。 专业可视化(绿色=看涨序列,红色=看跌序列,黄色=Doji)。 实时统计面板:多头/空头序列数量。 报警系统:弹窗、声音、推送通知。 优势 快速识别趋势延续或动能衰竭。 与供需、支撑/阻力、SMC结合使用。 适合剥头皮、波段和日内交易。 节省时间,不再手动数K线。 参数设置 序列阈值:2–7根K线。 回溯范围:50–500根。 Doji灵敏度:0.01–0.10。 主题:黑/白背景。 提醒:弹窗、声音、推送。 兼容性 平台: MetaTrader 5 市场: 外汇、黄金、指数、股票、大宗商品、加密货币 时间周期: 所有 (M1–MN1) 免责声明 该指
FREE
Dynamic CCI
Muhammad Jawad Shabir
CCI with Dynamic OSB Zones The CCI indicator you have been using is broken. Not because of the formula — because of the fixed levels. Every market condition is different. A reading of +150 in a low-volatility pair is extreme. The same reading in a trending, high-volatility session is completely normal. Yet every standard CCI indicator treats both situations identically. Crystal AI Systems built this indicator to fix that problem permanently. Two Modes. One Indicator. Full Market Coverage. This i
FREE
Crystal Cross Sync
Muhammad Jawad Shabir
Crystal Cross Sync Advanced MT5 Chart Synchronization & Backtesting Engine Crystal Cross Sync is a high-performance MetaTrader 5 utility designed to transform the way traders analyze, replay, and synchronize market data. Built specifically for serious MT5 traders, this tool delivers ultra-fast chart synchronization, automatic time alignment, precision zoom control, and structured backtesting assistance — all in one optimized engine. This is not an indicator. This is a professional chart control
FREE
Crystal Trade Manager – Advanced MT5 Risk and Trade Control Utility Overview Crystal Trade Manager (CTM) is a professional MetaTrader 5 utility designed for risk management, trade automation, and instant execution control. It provides traders with an integrated system for protecting equity, managing daily drawdowns, controlling lot sizes, and applying automation features such as automatic SL/TP, break-even, and trailing stop. The tool is suitable for manual traders, prop-firm challenge particip
Export History Data to CSV
Muhammad Jawad Shabir
5 (1)
Crystal AI Data Extractor — Get Clean MT5 Data Into Excel or Python in One Click If you have ever tried to pull historical data out of MetaTrader 5 and ended up with a messy file where everything lands in one column — this tool is for you. Crystal AI Data Extractor does one job and does it properly: it takes your MT5 chart data and saves it as a clean, properly separated CSV file that opens correctly in Excel, Python, or any other tool you use. No more copying and pasting from the terminal. No m
FREE
Crystal Copycat ULTIMATE v4.00 – 专业 MT5 交易复制工具 概述 Crystal Copycat ULTIMATE v4.00 是一款高性能 MetaTrader 5 交易复制器,可 实现不同账户与经纪商之间的超高速、可靠复制。系统通过 MT5 本地公共文件 夹运行,无需 DLL 或 API ,适合 VPS 与多 账户环境。 核心功能 双模式 : MASTER: 广播 订单、修改与关闭。 SLAVE: 即 时执行并带风险控制。 智能 仓位缩放 :固定手数、 资金比例、基于风险百分比。 风险管理 :最大回撤保 护、资金监控、单笔风险控制、基于 SL 的 计算。 订单覆盖 :市价、挂 单、修改、删除、 CLOSE_ALL 。 符号映射 :自 动 / 手 动支持(如 XAUUSD=XAUUSD.r )。 文件通信 :基于本地文件 夹,无需 DLL 和 API 。 可 视化面板 : 实时显示交易状态、风险、错误。 应用场景 多 终端复制交易。 Prop Firm 账户管理。 信号提供。 多 经纪商环境。 亮点 支持跨 经纪商复制。 支持市价与挂 单。 兼容
FREE
Live Price With PNL
Muhammad Jawad Shabir
实时价格和总利润显示指标 完美适用于实盘交易和屏幕分享 专为日内交易者、剥头皮交易者和实时交易直播会话设计 这个专业指标直接在您的图表上提供实时价格显示和综合利润跟踪 - 对于高频交易和实时交易广播至关重要。 核心功能 实时价格显示 每秒更新实时买价 所有品种类型的专业格式化 黄金/XAU的特殊格式化 大型清晰显示,完美适合屏幕分享 日内交易决策的即时价格更新 综合利润跟踪 来自交易历史的账户总利润 交易平仓时的实时利润更新 自定义额外利润金额 包含佣金和库存费 带正负指标的专业利润格式化 性能优化 智能缓存系统 - 最小CPU使用 1秒更新间隔 - 闪电般快速 高效的基于定时器的更新 实时交易监控 专业错误处理 高级自定义 可调节字体名称和大小 盈亏自定义颜色 图表上任意位置的灵活定位 专业角落锚定 关键词: 实时价格显示,实时利润追踪器,交易利润指标,账户监视器,日内交易工具,剥头皮指标,直播显示,屏幕分享工具,高频交易,外汇指标,黄金价格显示,利润计算器,实时更新,实时图表显示,交易表现监视器,MT5指标,MetaTrader 5工具
FREE
Volatility Monitor – 实时波动检测指标 概述 Volatility Monitor 是一款轻量级且专业的 MT5 指标,用于跟踪突发价格波动并实时提醒交易者。无论您交易外汇、黄金、日元货币对还是加密货币,该工具都能通过 ATR 自动检测或手动点数阈值提供清晰的市场波动信号。 它会在图表上直接标记蜡烛,并发送渐进式提醒,帮助交易者快速应对行情波动、新闻事件和突破行情。 主要功能 实时波动检测 – 即时识别市场波动。 灵活的检测模式 – ATR 自动模式或手动点数模式。 渐进式提醒 – 声音提示 (1–3 次),弹窗通知和推送提醒。 智能蜡烛标记 – 彩色圆点 (黄色/橙色/红色) 标示不同波动强度。 自动适配颜色 – 自动识别深色或浅色图表背景。 内置仪表盘 – 显示实时蜡烛范围、ATR 值、波动百分比及历史峰值。 通用支持 – 兼容外汇、黄金、日元货币对和加密货币。 输入与设置 检测模式: ATR 自动或手动点数。 历史回溯: 自定义分析蜡烛数量。 标记设置: 启用/禁用标记,选择大小和颜色模式。 提醒: 启用声音、弹窗、推送提醒。 仪表盘: 可调整位置,实时显示波
FREE
Crystal Copycat – MT5 Trade Copier Pro (Local + Online) OVERVIEW Crystal Copycat ULTIMATE HYBRID  is a professional MT5 trade copier designed for prop accounts, money managers, and signal providers who need both ultra-fast local copying and flexible online distribution. It supports 2 engines in one EA: Local File Engine – copies trades between MT5 terminals on the same PC/VPS using the MT5 Common folder (no DLLs, no external web APIs). Online Telegram Engine – sends master trades to a Telegram b
Crystal Trade Manager – 高级MT4风险与交易管理工具 概述 Crystal Trade Manager (CTM) 是一款专业的 MetaTrader 4 工具 ,专为 风险管理、交易自动化和快速执行控制 设计。 它可以帮助交易者保护账户资金、管理每日回撤、控制手数,并自动化关键交易功能(Auto SL/TP、Break-Even、Trailing Stop)。 该工具非常适合 手动交易者、Prop Firm 挑战参与者以及专业资金管理人 ,确保在MT4中保持精确和纪律。 主要功能 1. 风险与回撤保护 可调节每日最大回撤(1%–70%)。 达到限制时自动关闭所有订单。 可选择同时删除挂单。 每日锁定模式 → 阻止当天继续交易(Prop Firm 合规)。 2. 盈亏目标控制 设置每日盈利/亏损目标(USD)。 达到目标后自动关闭所有交易。 符合 Prop Firm 一致性要求。 3. 自动止损与止盈 (Auto SL/TP) 每笔新交易自动添加 SL/TP。 可按点数调整(兼容不同报价精度)。 免去手动设置 SL/TP。 4. Break-Even (保本)
FREE
Crystal Dashboard
Muhammad Jawad Shabir
Crystal Profit Dashboard – Real-Time MT5 Account Performance Utility Overview Crystal Profit Dashboard is a lightweight MetaTrader 5 utility that provides real-time profit and loss monitoring directly on the chart. It offers a clean, modern dashboard interface that updates account performance without clutter, allowing traders to focus on execution while keeping essential metrics visible. Designed for scalpers, intraday traders, and swing traders, this tool provides accurate floating profit/los
FREE
Crystal CopyCat Pro Trade Copier Ultra-Fast Master–Slave Copier with Zero-Delay Execution and Cross-Platform MT5 Compatibility Architecture:   MT4 → MT4 and MT4 → MT5 Full Compatibility MT5 Version Free :   https://www.mql5.com/en/market/product/144569 MT5 Version Pro :  https://www.mql5.com/en/market/product/165051 Complete User Setup Guide:-  https://www.mql5.com/en/blogs/post/764222   1. Overview Crystal CopyCat Ultimate 5.0 is a next-generation trade copy engine engineered for professi
筛选:
无评论
回复评论