Four rsi mt4

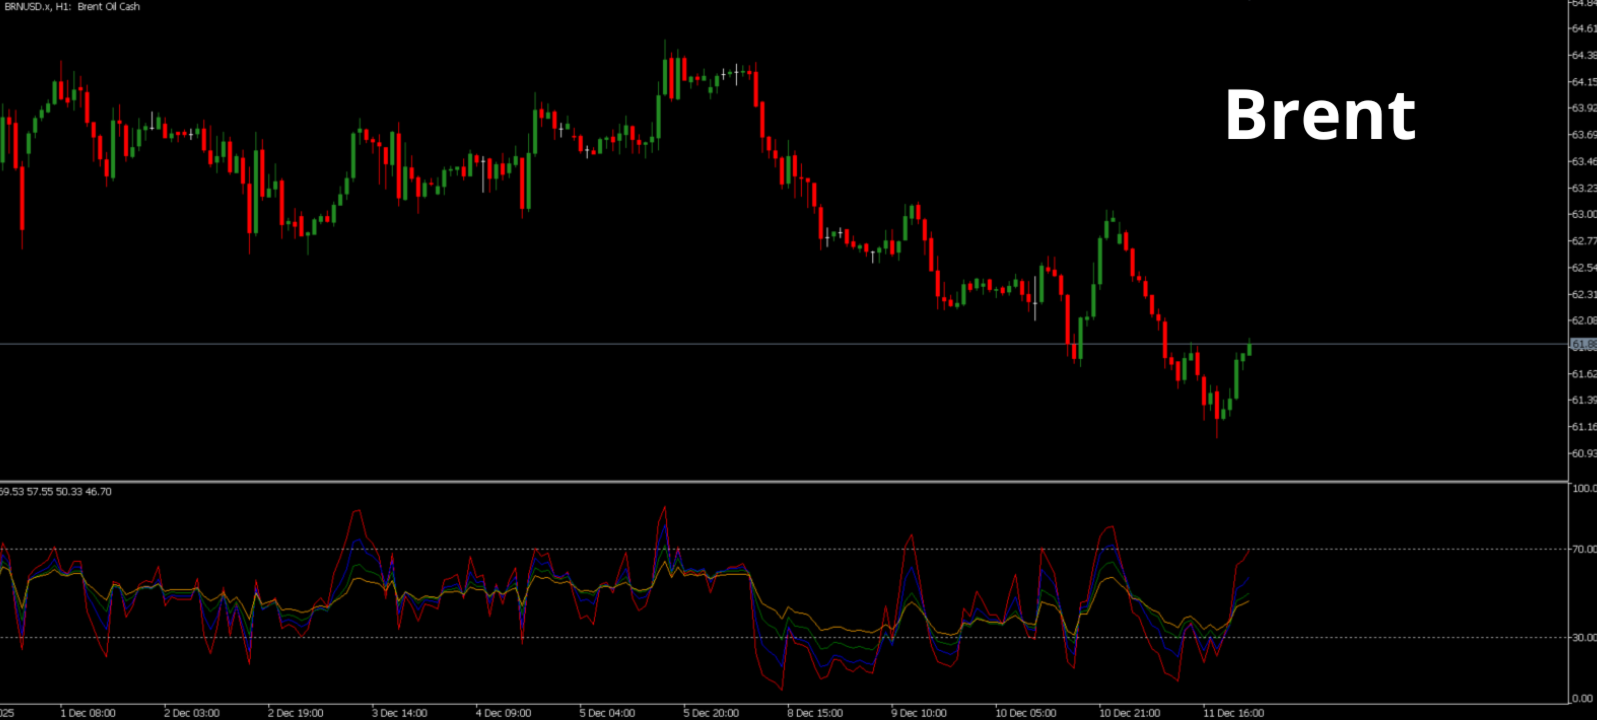
🎯 Multi-RSI – 4 RSIs in 1 for Complete Market Analysis

💎 Analyze market strength and momentum like a pro!

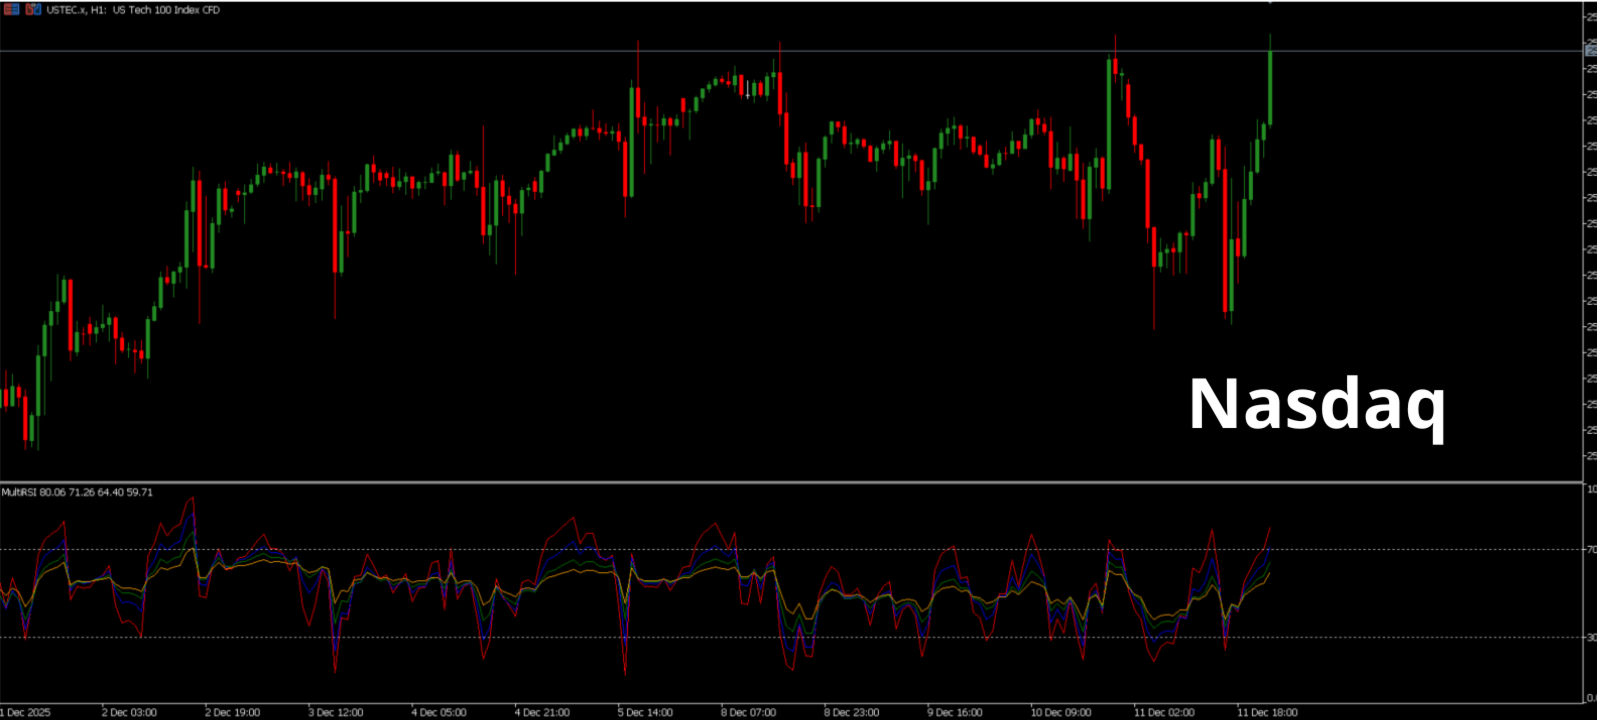
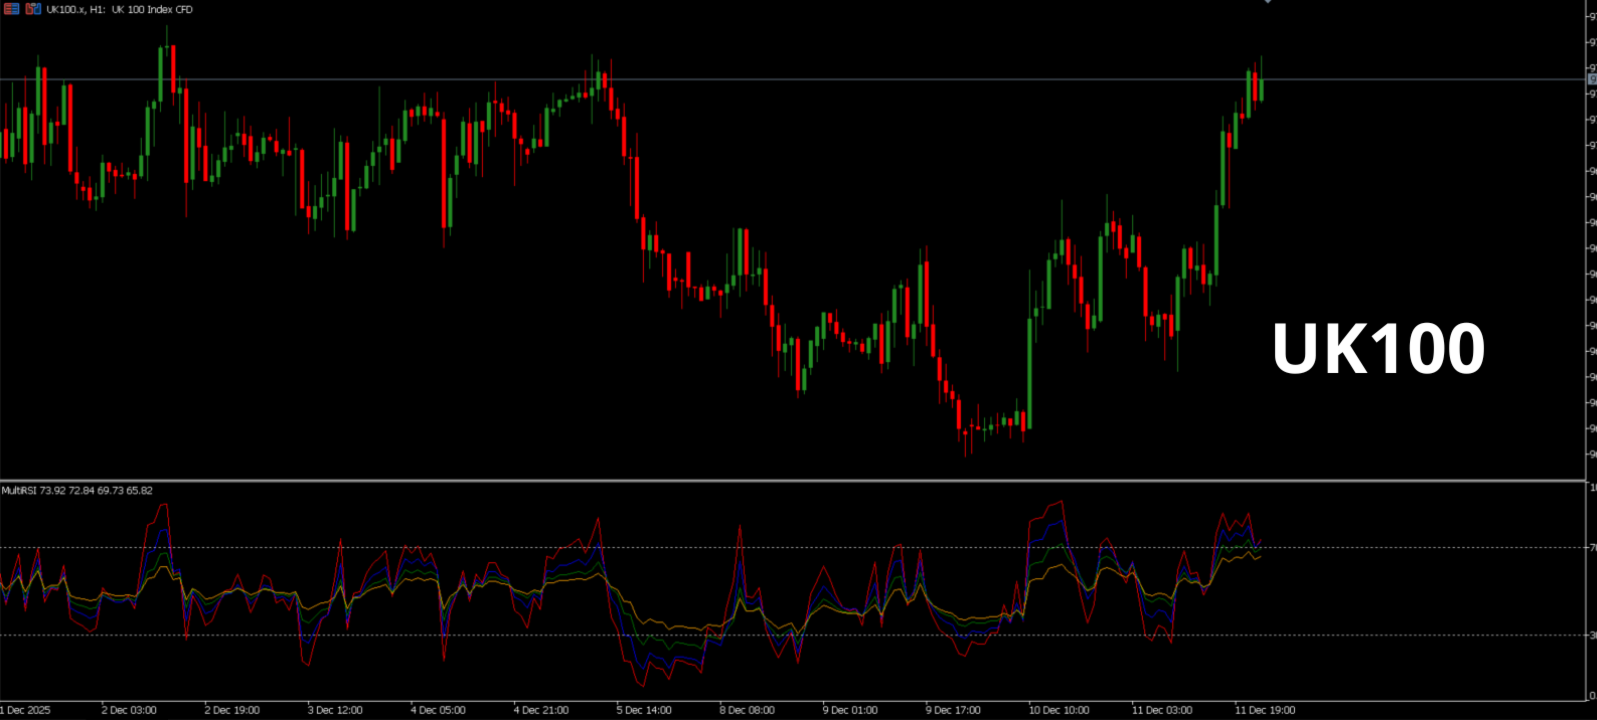
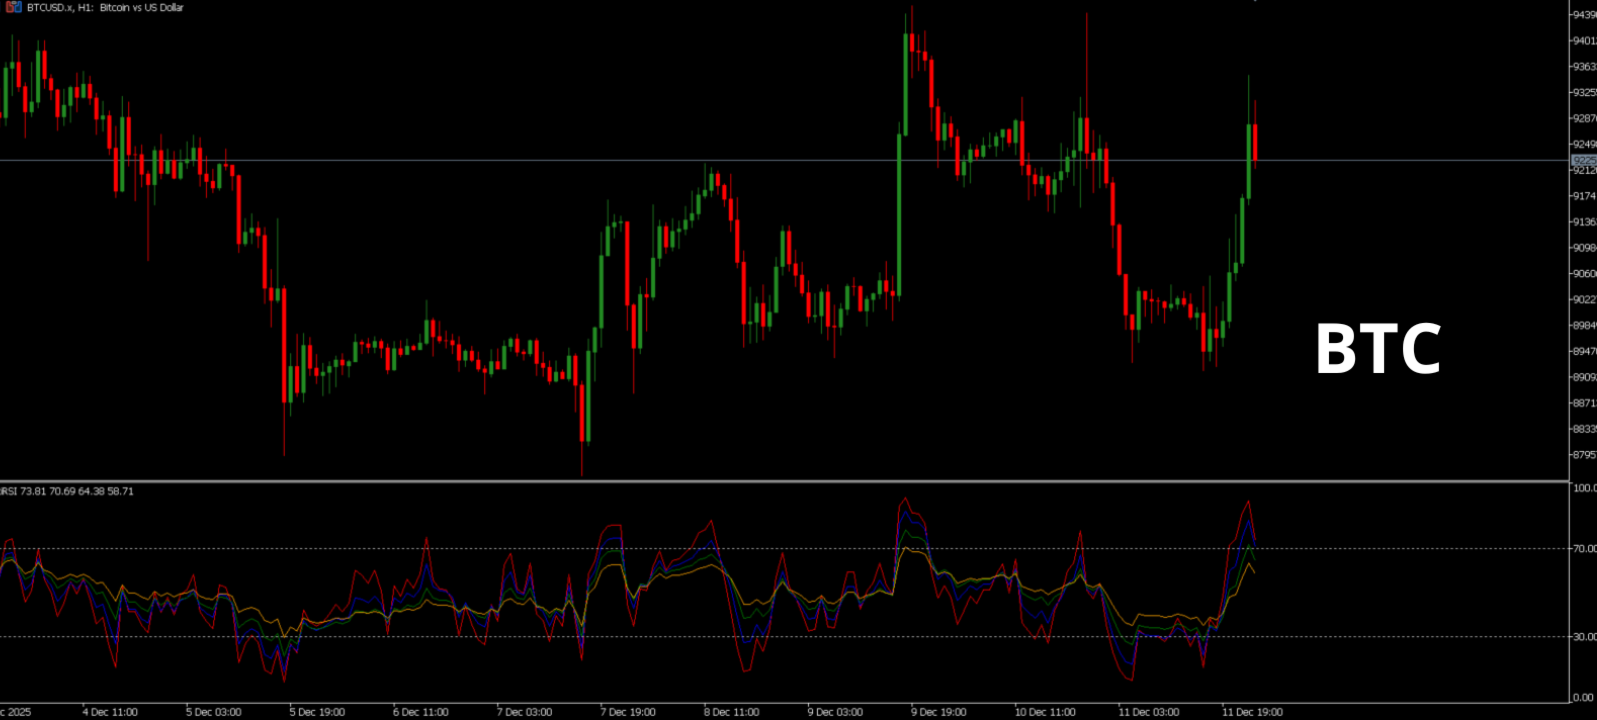
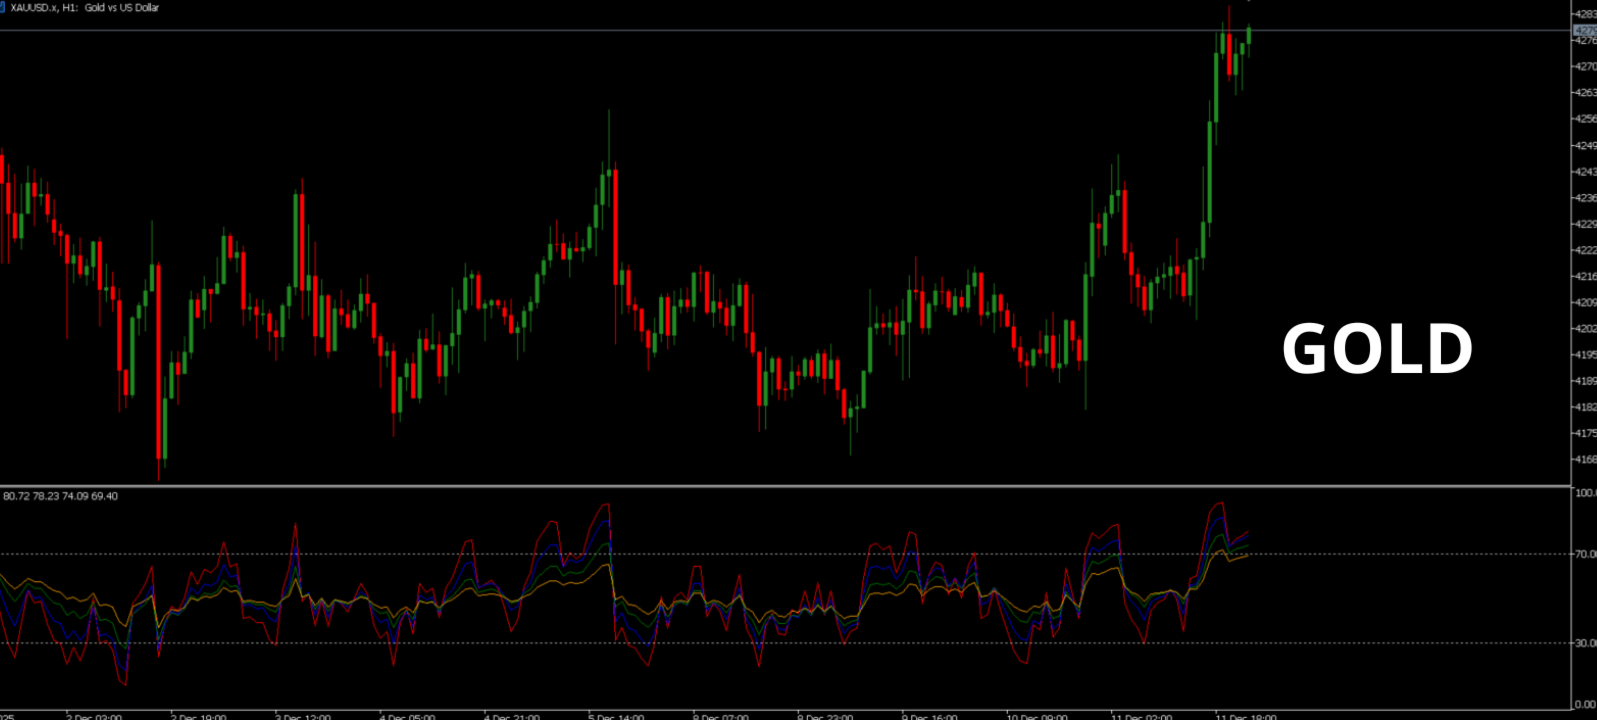
Multi-RSI combines 4 distinct RSIs in a single window, giving you a clear and fast view of market momentum across multiple timeframes. Each RSI has its own configurable period, allowing you to adapt the indicator to your trading strategies and style.

✨ Key Features:

  • 📊 4 RSIs in one indicator – track multiple periods simultaneously.

  • ⚙️ Fully customizable periods – adjust each RSI individually to fit your strategy.

  • 🎨 Clear and colorful display – each RSI has its own color for instant readability.

  • 📈 Separate window – keeps your charts clean and uncluttered.

  • Optimized calculation – stays fast even on long histories and large datasets.

🚀 Ideal Use Cases:

  • Identify overbought and oversold conditions across multiple periods.

  • Compare short-, medium-, and long-term momentum at a glance.

  • Confirm entry and exit signals with more precision.

  • Multi-period tracking without cluttering your chart with multiple indicators.

💡 Why Multi-RSI?
Because it combines 4 powerful RSIs in a single indicator, giving you a complete view of market momentum in one glance. With configurable periods and a clean display, Multi-RSI is the perfect tool for any trader who wants to analyze relative strength across multiple timeframes quickly and efficiently.

🔥 Enhance your analysis and trade with more precision using Multi-RSI!


Prodotti consigliati
Chart Analyzer
Innovicient Limited
The Chart Analyzer is an MT4 indicator that provides visual arrow signals without redrawing them. In addition, we have included trendlines to validate your entries. This indicator has been fine-tuned to work with all timeframes and instruments.  The Chart Analyzer has a number of advantages Does not fade or remove arrows when drawn Sends both email and phone alerts. It is light on computer resources Easy to install. Default setting works just fine.  If price opens above the trendline, open bu
TMoney OrderblockDay
Moises Orlando Urbina Sojo
The indicator is triggered at the start of each trading day and detects both bullish and bearish ORDERBLOCK potentials. These levels are of high operational probability, being able to use a minimum ratio of 3 to 1 to maximize profits. It is recommended to use TimeFrame M5 to M30 for a proper display and consider pending orders at the OB levels of the chart and place the SL up to a maximum of 20 pips from the entry price. Submit the indicator to Backtesting to become familiar with its performan
My Point MT4
Claudia Ramona Angerer
4 (1)
Diagnosis of major and minor pivot Trend detection with many signals Can be used in all symbols Can be used in all time frames Settings: Back Show: The number of candles it displays If you need any adjustments, or have any questions or suggestions, message me How to trade: Blue: sell signal Red: buy signal Blue and red at the same time: no signal Exit signal: Opposite signal
Questo indicatore è un indicatore per l'analisi automatica delle onde perfetto per il trading pratico! Caso... Nota:   non sono abituato a usare nomi occidentali per la classificazione delle onde a causa dell'influenza della convenzione di denominazione di Tang Lun (Tang Zhong Shuo Zen), ho chiamato l'onda base come   penna   e la banda dell'onda secondaria come   segmento   At allo stesso tempo, il segmento ha la direzione del trend. La denominazione   è principalmente segmento di trend   (que
The Strong Volume Trend  MT4 indicator is a powerful tool designed to help traders identify and capitalize on significant volume trends in the financial markets. With its advanced algorithm, this indicator accurately detects the strength and direction of volume movements, allowing traders to make informed trading decisions. Features: Volume Strength Analysis: The indicator analyzes the volume data and identifies strong volume trends, helping traders spot potential market reversals, breakouts, or
Fibonacci colores
Carlos Augusto Cedeno Rocha
Fibonacci por color en niveles para aplicar estrategia profesional inicialmente se coloca en el punto mas alto del dia y mas bajo con esto es para ubicar operaciones a una distancia exacta con lo cual se busca generar ganancias residuales internas en el mismo dia con esto las lineas fusias es para colocar las entrdas sell y las lineas verdes amarillas van los buy
A useful scanner/dashboard that shows the RSI values for multiple symbols and time-frames. It can be easily hidden/displayed with a simple click on the scanner man top left of the dashboard. You can input upper and lower RSI values and the colours can be set to show when above/below these values. The default values are 70 and 30. There are also input colours for when the RSI is above or below 50 (but not exceeding the upper/lower levels Symbols and time-frames are input separated by commas.
Note : The slow loading of the indicator issue has been addressed . This new version loads fast and does not slow the platform. Version 1.3 : We have updated the indicator to include an historical bar scanning option . So instead of scanning all bars in the history (which can make the indicator slow sometimes ) , you can select the maximum number of bars it can scan which can increase the performance and make the indicator faster. This indicator scans the 1-3 Trendline pattern . The indicato
Impulse fractals indicator - is counter-trend oriented complex market fractal pattern.  Market creates bull/bear impulse, trend starts, fractals on impulsed wave are an agressive pullback signals. Buy arrow is plotted when market is bearish and it's impulse showed up-side fractal, and sell arrow is plotted when market is bullish and it's impulse showed dn-side fractal. Main indicator's adjustable inputs : impulsePeriod - main period of impulse histogram  filterPeriod  - smoothes impulse accordi
Moving Pivot Average    The pivot indicator compares the selected period with its counterpart from the previous period. The indicator uses very flexible algorithm for pivot value calculating. It allows you to allocate in days a certain time intervals (custom bars) and calculate the average pivot value based on High, Low and Close prices of these bars. How many custom bars will be taken into account is determined by the "Days" setting. The pivot line can be considered an average trend line and us
Key Breakout and Jump/Fall levels. No lagging. No repaint. Trend line is useful for detecting pattern, which is intended for the triangle pattern, Support & Resistance lines, and as a breakout up or down line.  The trend lines are formed first before the price of the pair reach it. So it does not repaint.  Each line has a description, such as Support, Resistance, Current-Support as key breakout down, and Current-Resistance as a key breakout up.  Each broke out line turns into a new support or re
Alert Up Down MT4
William Oswaldo Mayorga Urduy
ALERT UP - DOWN FOR METATRADER 5 This indicator generates an alert when the price leaves the zone between the UP and DOWN lines. You can generate alerts of various types such as: > Sound > Message box > Message in the expert box > Mail (previously configured) > PUSH notifications (previously configured) The lines must be configured from the indicator properties and not from the lines properties, since if it is done from the lines properties, the finonacci may be affected. Among the s
Overview Happy Kangaroo is a trend-following tool designed to identify market direction and provide high-probability entry signals based on volatility. By combining price action with the Average True Range (ATR), it visualize a dynamic support and resistance level of the price.     Key Features   The indicator's power lies in its customizable parameters and mathematical precision:  Dynamic Trend Detection: Uses the ATR period and factor to calculate the volatility bands. It identifies an Uptrend
Trump Arrow
Thomas Bradley Butler
Trump Arrow is for trading the trends of the markets.  It uses convergence and divergence.  Use it during active times to get behind a trend and follow it with MA filters or other strategies you have.  The indicator works well for small time frames just and it suggests using 15 min. Others work too but for day trading 5-15 is best.  1 hr charts if you want to filter for longer term trends.
To access the TD sequential Scanner for MT5, please check https://www.mql5.com/en/market/product/123369?source=Site +Market+My+Products+Page. One of the MT5 versions includes additional timeframes such as M1, M2, M3,H2,H6,H8 and so on.( https://www.mql5.com/en/market/product/123367?source=Site +Market+My+Products+Page) TD Sequential Scanner: An Overview The TD Sequential scanner is a powerful technical analysis tool designed to identify potential price exhaustion points and trend reversals in fi
High Low Predict
Thomas Bradley Butler
This indicator is designed to help you forecast the potential high and low prices for the current trading day, based on the high and low of the previous day. It does this by applying a customizable percentage increase or decrease to those levels. How It Works: The idea is simple: It looks at the previous day's high and low prices and then adjusts them by a percentage you choose. Here's what that means: Predicted High: This is calculated by taking the high price of the previous day and adding a p
Con questo strumento di trading puoi scansionare 15 mercati contemporaneamente. Presentazione del nuovo indicatore di trading 2024: ️ Dashboard Stocastico multi valuta e multi time frame. Ci sono almeno due ragioni per cui ho creato questo strumento di trading: Innanzitutto, sono stanco di osservare solo un mercato. In secondo luogo, non voglio perdere il momento di ingresso in un altro mercato. Ecco perché voglio conoscere contemporaneamente altre condizioni di mercato. Per questo motiv
CYCLE WAVE OSCILLATOR indicator is an indicator based on cyclical price fluctuations. This indicator can help you determine overbought and oversold levels, and help you predict price trends within the cycle. MT5 Version here!  You can combine it with our indicators below to make your trading decisions more accurate: Supply Demand Ribbon MT4 Basic Feature: - Three Trend Types: + Zero + Basic + Advanced
FREE
Read detailed description and extra indicators: https://www.mql5.com/en/blogs/post/758622 This Supertrend dashboard is a multi-currency and multi-timeframe dash which gives signals whenever supertrend changes it's trend direction. Please note, that this is not a full trading system. It will help you get initial Supertrend signals and higher timeframe trend alignments. And it’s to be used with your own Supertrend Strategies. Features: 1- Select one of In-Built Supertrend Indicators: xSupertren
Rira VWAP Bands
Vitor Palmeira Abbehusen
VWAP Bands gives you the regular Volume-Weighted Average Price and also the deviation bands. Use this indicator to see the possible amount of market movement, find support and resistance lines, find good spots for entry and exit,  and the most important feature is to find possible pivot points. This indicator has been mathematically improved by Rira team. The calculation begins at the start of each trading day
Hurricane EMA
Mohammad Abbas Mohammad Dashti
EMA Slope Angle Tracker: Stop Guessing Momentum Most traders use Moving Averages to identify the trend, but they miss the most crucial piece of data: Momentum . Eyeballing the curve of an EMA can be incredibly deceptive. Is the trend actually accelerating, or is it just slowly bleeding out? The Hurricane EMA  takes the guesswork out of trend-following by calculating the exact mathematical trajectory of the market to give you an objective, geometric read-on market momentum. Instead of just plotti
FREE
REMINDER: Early buyers hot price discount: Price subject to rise after first 20 copies. Starting price $65 and final price will be $1275. Secure your discounted copy Now! Smart Money Analyser Indicator User Manual 1. Introduction Welcome to the   Smart Money Analyser Indicator This powerful tool provides traders with comprehensive market analysis by combining various technical indicators to generate actionable trading signals. Designed to be user-friendly, this indicator helps traders of all
I recommend you to read the   product's blog  (manual) from start to end so that it is clear from the beginning what the indicactor offers. This multi time frame and multi symbol supply and demand zone dashboard indicator sends alerts when the price has reached a supply/demand zone. It is also possible to use it to be alerted about regular double tops/bottoms instead of zones. It can be used with all time frames from M1 to MN. It is possible to use RSI, divergence (MACD, OsMA, RSI or Awesome) a
TPSproTREND PrO
Roman Podpora
4.67 (27)
TPSproTrend PRO       - si tratta di un indicatore di tendenza che analizza automaticamente il mercato e fornisce informazioni sulla tendenza e sui suoi cambiamenti, oltre a visualizzare i punti di ingresso per le negoziazioni       senza ridisegnare! ИНСТРУКЦИЯ RUS   -   ISTRUZIONI   ITA   -   VERSIONE MT5 Funzioni principali: Segnali di ingresso precisi       SENZA RIVERNICIARE! Una volta che un segnale appare, rimane valido! Questa è una differenza significativa rispetto alla rielaborazione
Se stai cercando un indicatore affidabile per fare trading con il concetto ICT, la Struttura di Mercato ICT fornisce un manuale per i trader che usano strategie più avanzate. Questo indicatore tutto in uno si concentra sui concetti ICT (Smart Money Concepts). La Struttura di Mercato ICT cerca di capire come operano le istituzioni, aiutando a prevedere le loro mosse. Comprendendo e utilizzando questa strategia, i trader possono ottenere preziose informazioni sui movimenti del mercato e trovare in
No idea why demo is not working. you can check the GIF to see how it works. Features With this scanner you can detect Candles which are below/above yesterday high/low lines. A pair's rectangle turns RED in dashboard if it is above the yesterday high, and rectangle turns GREEN in dashboard if it is below the yesterday low. It gives alerts in every 15m candle close. Contains a Dashboard which will help you to see all market pair's. It is possible to disable this sorting through to make it easier
"Experience the full power on EURUSD!" Title: ChanLun Structure and SMC System Description: This indicator combines ChanLun Theory (Bi, Duan, Zhongshu) with Smart Money Concepts (SMC) to analyze market structure. It visualizes the market in three distinct layers—Pen, Segment, and Wave—and automatically identifies Premium, Discount, and Optimal Trade Entry (OTE) zones. The tool features an Interactive Hybrid Control System , allowing traders to manage the chart using keyboard hotkeys or mouse int
FREE
Others
Tatiana Savkevych
The Others indicator is a trend-type indicator. In those moments when you need to make a decision to enter a position and give the trader a direction. The indicator gives the trader the opportunity to visually determine which trend will be present at a particular time interval. These are auxiliary tools for technical analysis of the market. Recommended for use in conjunction with any of the oscillators. The main application of the Others indicator is to generate buy and sell signals. Determini
Trend Divergence Indicator: Your Essential Tool for Market Analysis The Trend Divergence Indicator is a powerful tool designed to assist traders in identifying market trends and pinpointing entry points with precision. By leveraging price divergence, this indicator enhances your trading strategy, offering reliable insights and filtering unnecessary signals. Key Features and Benefits of the Trend Divergence Indicator Accurate Trend Analysis: The Trend Divergence Indicator uses price divergence t
The Best Choice compra y venta
Sandro Israel Hernandez Zamora
¿Has escuchado decir que la tendencia es tu amiga? pues nada es mas cierto en el mundo del trading. Este indicador analiza las tendencias y su fuerza para que puedas aprovecharlas y utilizamos un conjunto de indicadores como RSI, %W, MACD y EMAS para analizar el mercado y sus movimientos, por lo que podrás mantener tu gráfico limpio sabiendo que todos estos indicadores los tienes en uno solo. Este, como cualquier indicador, no representa una certeza de compra o venta definitiva, por lo siempre r
Gli utenti di questo prodotto hanno anche acquistato
Gann Made Easy
Oleg Rodin
4.83 (157)
Gann Made Easy è un sistema di trading Forex professionale e facile da usare che si basa sui migliori principi del trading utilizzando la teoria di mr. WD Gann. L'indicatore fornisce segnali ACQUISTA e VENDI accurati, inclusi i livelli di Stop Loss e Take Profit. Puoi fare trading anche in movimento utilizzando le notifiche PUSH. CONTATTAMI DOPO L'ACQUISTO PER RICEVERE GRATUITAMENTE LE ISTRUZIONI DI TRADING E OTTIMI INDICATORI EXTRA! Probabilmente hai già sentito parlare molte volte dei metodi d
M1 Sniper
Oleg Rodin
5 (19)
M1 SNIPER è un sistema di indicatori di trading facile da usare. Si tratta di un indicatore a freccia progettato per l'intervallo temporale M1. L'indicatore può essere utilizzato come sistema autonomo per lo scalping sull'intervallo temporale M1 e come parte del tuo sistema di trading esistente. Sebbene questo sistema di trading sia stato progettato specificamente per il trading sull'intervallo temporale M1, può comunque essere utilizzato anche con altri intervalli temporali. Inizialmente ho pro
Game Changer Indicator
Vasiliy Strukov
4.13 (23)
Game Changer è un indicatore di tendenza rivoluzionario, progettato per essere utilizzato su qualsiasi strumento finanziario, per trasformare il tuo MetaTrader in un potente analizzatore di trend. Funziona su qualsiasi intervallo temporale e aiuta a identificare i trend, segnala potenziali inversioni, funge da meccanismo di trailing stop e fornisce avvisi in tempo reale per risposte tempestive del mercato. Che tu sia un professionista esperto o un principiante in cerca di un vantaggio, questo st
Scalper Inside PRO
Alexey Minkov
4.74 (69)
An exclusive indicator that utilizes an innovative algorithm to swiftly and accurately determine the market trend. The indicator automatically calculates opening, closing, and profit levels, providing detailed trading statistics. With these features, you can choose the most appropriate trading instrument for the current market conditions. Additionally, you can easily integrate your own arrow indicators into Scalper Inside Pro to quickly evaluate their statistics and profitability. Scalper Inside
Dynamic Forex28 Navigator
Bernhard Schweigert
4.43 (7)
Dynamic Forex28 Navigator - Lo strumento di trading Forex di nuova generazione. ATTUALMENTE SCONTATO DEL 49%. Dynamic Forex28 Navigator è l'evoluzione dei nostri indicatori popolari di lunga data, che combinano la potenza di tre in uno: Advanced Currency Strength28 Indicator (695 recensioni) + Advanced Currency IMPULSE con ALERT (520 recensioni) + CS28 Combo Signals (Bonus). Dettagli sull'indicatore https://www.mql5.com/en/blogs/post/758844 Cosa offre l'indicatore di forza di nuova generazione?
Atomic Analyst
Issam Kassas
5 (3)
Innanzitutto, vale la pena sottolineare che questo indicatore di trading non è repaint, non è ridisegno e non presenta ritardi, il che lo rende ideale sia per il trading manuale che per quello automatico. Manuale utente: impostazioni, input e strategia. L'Analista Atomico è un indicatore di azione del prezzo PA che utilizza la forza e il momentum del prezzo per trovare un miglior vantaggio sul mercato. Dotato di filtri avanzati che aiutano a rimuovere rumori e segnali falsi, e aumentare il pote
GOLD Impulse with Alert
Bernhard Schweigert
4.64 (11)
Questo indicatore è una super combinazione dei nostri 2 prodotti Advanced Currency IMPULSE with ALERT  +   Currency Strength Exotics . Funziona per tutti i time frame e mostra graficamente l'impulso di forza o debolezza per le 8 valute principali più un simbolo! Questo indicatore è specializzato nel mostrare l'accelerazione della forza delle valute per qualsiasi simbolo come oro, coppie esotiche, materie prime, indici o futures. Primo nel suo genere, qualsiasi simbolo può essere aggiunto all
Scalper Vault
Oleg Rodin
5 (36)
Scalper Vault è un sistema di scalping professionale che ti fornisce tutto il necessario per scalping di successo. Questo indicatore è un sistema di trading completo che può essere utilizzato dai trader di forex e opzioni binarie. L'intervallo di tempo consigliato è M5. Il sistema fornisce segnali di freccia accurati nella direzione della tendenza. Ti fornisce anche i segnali più alti e più bassi e i livelli di mercato di Gann. Gli indicatori forniscono tutti i tipi di avvisi, comprese le notifi
Supply and Demand Dashboard PRO
Bernhard Schweigert
4.8 (20)
Attualmente 40% di sconto! Questo cruscotto è un software molto potente che lavora su più simboli e fino a 9 timeframe. Si basa sul nostro indicatore principale (migliori recensioni: Advanced Supply Demand ).   Il cruscotto offre un'ottima panoramica. Mostra:    Valori filtrati di domanda e offerta, compresa la valutazione della forza delle zone, distanze dei pip da/all'interno delle zone, Evidenzia le zone annidate, Fornisce 4 tipi di allarmi per i simboli scelti in tutti i (9) time-frames.
Trend Screener
STE S.S.COMPANY
4.79 (95)
Indicatore di tendenza, soluzione unica rivoluzionaria per il trading di tendenze e il filtraggio con tutte le importanti funzionalità di tendenza integrate in un unico strumento! È un indicatore multi-timeframe e multi-valuta al 100% non ridipingibile che può essere utilizzato su tutti i simboli/strumenti: forex, materie prime, criptovalute, indici e azioni. OFFERTA A TEMPO LIMITATO: l'indicatore di screening di supporto e resistenza è disponibile a soli 50$ e a vita. (Prezzo originale 250$) (o
Attualmente 40% di sconto! La soluzione migliore per ogni principiante o trader esperto! Questo software per cruscotti funziona su 28 coppie di valute. Si basa su 2 dei nostri indicatori principali (Advanced Currency Strength 28 e Advanced Currency Impulse). Offre un'ottima panoramica dell'intero mercato Forex. Mostra i valori di forza delle valute avanzate, la velocità di movimento delle valute e i segnali per 28 coppie Forex in tutti i (9) timeframe. Immaginate come migliorerà il vostro tra
Se acquisti questo indicatore, riceverai il mio Trade Manager Professionale   + EA  GRATUITAMENTE. Innanzitutto è importante sottolineare che questo sistema di trading è un indicatore Non-Repainting, Non-Redrawing e Non-Lagging, il che lo rende ideale sia per il trading manuale che per quello automatico. Corso online, manuale e download di preset. Il "Sistema di Trading Smart Trend MT5" è una soluzione completa pensata sia per i trader principianti che per quelli esperti. Combina oltre 10 indic
FX Power MT4 NG
Daniel Stein
4.95 (21)
FX Power: Analizza la Forza delle Valute per Decisioni di Trading Più Intelligenti Panoramica FX Power è lo strumento essenziale per comprendere la reale forza delle principali valute e dell'oro in qualsiasi condizione di mercato. Identificando le valute forti da comprare e quelle deboli da vendere, FX Power semplifica le decisioni di trading e rivela opportunità ad alta probabilità. Che tu segua le tendenze o anticipi inversioni utilizzando valori estremi di Delta, questo strumento si adatta
Volatility Trend System - un sistema di trading che fornisce segnali per le voci. Il sistema di volatilità fornisce segnali lineari e puntuali nella direzione del trend, nonché segnali per uscirne, senza ridisegnare e ritardi. L'indicatore di tendenza monitora la direzione della tendenza a medio termine, mostra la direzione e il suo cambiamento. L'indicatore di segnale si basa sui cambiamenti della volatilità e mostra gli ingressi nel mercato. L'indicatore è dotato di diversi tipi di avvisi. Pu
El indicador "MR BEAST ALERTAS DE LIQUIDEZ" es una herramienta avanzada diseñada para proporcionar señales y alertas sobre la liquidez del mercado basándose en una serie de indicadores técnicos y análisis de tendencias. Ideal para traders que buscan oportunidades de trading en función de la dinámica de precios y los niveles de volatilidad, este indicador ofrece una visualización clara y detallada en la ventana del gráfico de MetaTrader. Características Principales: Canal ATR Adaptativo: Calcula
RFI levels PRO
Roman Podpora
5 (1)
L'indicatore mostra accuratamente i punti di inversione e le zone di ritorno dei prezzi in cui il       Principali attori   . Vedi dove si formano le nuove tendenze e prendi decisioni con la massima precisione, mantenendo il controllo su ogni operazione. VERSION MT5     -     Rivela il suo massimo potenziale se combinato con l'indicatore   TREND LINES PRO Cosa mostra l'indicatore: Strutture di inversione e livelli di inversione con attivazione all'inizio di un nuovo trend. Visualizzazione dei l
PZ Harmonacci Patterns
PZ TRADING SLU
3.17 (6)
Trade smarter, not harder: Empower your trading with Harmonacci Patterns This is arguably the most complete harmonic price formation auto-recognition indicator you can find for the MetaTrader Platform. It detects 19 different patterns, takes fibonacci projections as seriously as you do, displays the Potential Reversal Zone (PRZ) and finds suitable stop-loss and take-profit levels. [ Installation Guide | Update Guide | Troubleshooting | FAQ | All Products ] It detects 19 different harmonic pric
Weis Wave with Alert
Trade The Volume Waves Single Member P.C.
4.82 (22)
Rental/Lifetime Package Options and Privileges' Rent Monthly Six Months   Yearly/Lifetime Weis Wave with Speed with Alert+Speed Index x x x Manual  x x x Quick Set up Video x x x Blog x x x Lifetime Updates x x x Setup and Training Material x x Rectangle Break Alert Tool      x Discord Access Channel "The SI traders" x   How to trade info visit:    http://www.tradethevolumewaves.com   ** If you purchase please contact me to setup your  : training Room and  complete manual access.  This is
Apollo Secret Trend è un indicatore di tendenza professionale che può essere utilizzato per trovare le tendenze su qualsiasi coppia e intervallo di tempo. L'indicatore può facilmente diventare il tuo indicatore di trading principale che puoi utilizzare per rilevare le tendenze del mercato, indipendentemente dalla coppia o dal periodo di tempo che preferisci negoziare. Utilizzando un parametro speciale nell'indicatore puoi adattare i segnali al tuo stile di trading personale. L'indicatore fornisc
Un indicatore tecnico che struttura i grafici e identifica i movimenti ciclici dei prezzi. Può funzionare su qualsiasi grafico. Diversi tipi di notifiche. Ci sono altre frecce sul grafico stesso. Senza ridisegnare la storia, lavora sulla chiusura della candela. TF consigliati da M5 in su. Parametri facili da usare e configurare. Se si utilizzano 2 indicatori con parametri diversi, è possibile utilizzarli senza altri indicatori. Ha 2 parametri di input Ciclicità e durata del segnale Questi 2 pa
Currency Strength Wizard è un indicatore molto potente che ti fornisce una soluzione all-in-one per un trading di successo. L'indicatore calcola la potenza di questa o quella coppia forex utilizzando i dati di tutte le valute su più intervalli di tempo. Questi dati sono rappresentati in una forma di indice di valuta facile da usare e linee elettriche di valuta che puoi utilizzare per vedere il potere di questa o quella valuta. Tutto ciò di cui hai bisogno è collegare l'indicatore al grafico che
Advanced Supply Demand
Bernhard Schweigert
4.91 (299)
Speciale Trading- SCONTO DEL 40% La soluzione migliore per qualsiasi trader principiante o esperto! Questo indicatore è uno strumento di trading unico, di alta qualità e conveniente, perché abbiamo incorporato una serie di funzionalità proprietarie e una nuova formula. Con questo aggiornamento, potrai visualizzare doppie zone di timeframe. Non solo potrai visualizzare un TF più alto, ma anche entrambi, il TF del grafico e il TF più alto: MOSTRA ZONE ANNIDATE. Tutti i trader che operano con Of
Slayer Binary
Abdulkarim Karazon
5 (1)
Slayer Binary è un indicatore di freccia a una candela con opzioni binarie. Questo indicatore non è per chi cerca il sacro graal, poiché è un approccio poco realistico al trading in generale. L'indicatore fornisce un tasso di successo costante e, se usato con la gestione del denaro e un obiettivo giornaliero, sarà ancora più affidabile. L'indicatore è dotato di molte caratteristiche elencate di seguito: CARATTERISTICHE NESSUNA RIDIPINGENZA: L'indicatore non ridipinge le sue frecce in tempo rea
Trend Lines PRO
Roman Podpora
5 (1)
LINEE DI TENDENZA PRO       Aiuta a capire dove il mercato sta realmente cambiando direzione. L'indicatore mostra reali inversioni di tendenza e punti in cui i principali attori rientrano. Vedi  Linee BOS   Cambiamenti di tendenza e livelli chiave su timeframe più ampi, senza impostazioni complesse o rumore inutile. I segnali non vengono ridisegnati e rimangono sul grafico dopo la chiusura della barra. VERSIONE MT 5     -      Svela il suo massimo potenziale se abbinato all'indicatore   RFI LEVE
PRO Renko System
Oleg Rodin
5 (30)
PRO Renko System è un sistema di trading altamente accurato appositamente progettato per il trading di grafici RENKO. Questo è un sistema universale che può essere applicato a vari strumenti di trading. Il sistema neutralizza efficacemente il cosiddetto rumore di mercato che consente di accedere a segnali di inversione accurati. L'indicatore è molto facile da usare e ha un solo parametro responsabile della generazione del segnale. Puoi facilmente adattare lo strumento a qualsiasi strumento di
Top Bottom Tracker è un indicatore basato su sofisticati algoritmi che analizza l'andamento del mercato ed è in grado di rilevare i massimi e i minimi del trend / Versione MT5 . Il prezzo aumenterà progressivamente fino a raggiungere i 500$. Prossimo prezzo --> 99$ Caratteristiche Nessuna riverniciatura Questo indicatore non cambia i suoi valori all'arrivo di nuovi dati Coppie di trading Tutte le coppie forex Timeframe Tutti i timeframe Parametri ==== Configurazione dell'indicatore ====
Currency Strength Exotics
Bernhard Schweigert
4.88 (33)
ATTUALMENTE SCONTATO DEL 20%! La soluzione migliore per qualsiasi principiante o trader esperto! Questo indicatore è specializzato nel mostrare la forza della valuta per qualsiasi simbolo come coppie esotiche, materie prime, indici o futures. È il primo nel suo genere, qualsiasi simbolo può essere aggiunto alla nona riga per mostrare la vera forza della valuta di Oro, Argento, Petrolio, DAX, US30, MXN, TRY, CNH ecc. Si tratta di uno strumento di trading unico, di alta qualità e conveniente pe
No Repaint Bext
Andrey Kozak
1 (1)
No Repaint Bext is a ready-made trading system. Shows when to open and when to close trades, as well as in which direction. Every time a green arrow appears, you need to open a buy trade. Close all buy trades when a red arrow appears. The same goes for the opposite direction, every time a red arrow appears, open sell trades and close them all when a green arrow appears. We use the M5 timeframe for trading. You can trade on any cozy pair. This indicator does not repaint and practically does not
Are you looking for a simple and reliable indicator that can help you spot market swing points easily? Do you want clear buy and sell signals that work on any timeframe and any trading instrument? Buy Sell Signal Pro is designed to do exactly that. It helps traders identify important market turning points and understand the current market structure in a clear and easy way. This indicator detects Higher Highs (HH), Higher Lows (HL), Lower Highs (LH), and Lower Lows (LL) so you can quickly see wh
TrendLine PRO MT4
Evgenii Aksenov
4.83 (167)
The Trend Line PRO indicator is an independent trading strategy. It shows the trend change, the entry point to the transaction, as well as automatically calculates three levels of Take Profit and Stop Loss protection. Trend Line PRO is perfect for all Meta Trader symbols: currencies, metals, cryptocurrencies, stocks and indices. The indicator is used in trading on real accounts, which confirms the reliability of the strategy. Robots using   Trend Line PRO   and real Signals can be found here:   
Altri dall’autore
Klinger Volume Oscillator  Short Description A volume-based flow analysis tool designed to visualize buying and selling pressure through a dual-colored histogram. Detailed Description The Klinger Volume Oscillator Histo is a technical analysis indicator that explores the relationship between price movement and transactional volume. By converting the traditional Klinger Oscillator into a dynamic histogram, this tool allows traders to observe the internal strength of market movements. The indicat
Kst pro tools MT4
Vincent Albert Feugier
KST Pro Tools – Smart Momentum Indicator Overview KST Pro Tools is an advanced momentum indicator based on Martin Pring’s classic Know Sure Thing (KST) . It has been redesigned to deliver a clean, instant, and unambiguous momentum reading , thanks to a smart and fully filtered histogram logic. This indicator shows only meaningful momentum , exactly when it matters. Indicator Components KST Line (blue) Measures the true strength of market momentum Built using 4 weighted and smoothed Rate
Vortex oscillator mt5
Vincent Albert Feugier
VORTEX OSCILLATOR: Master the Volume Flow VORTEX OSCILLATOR is a high-performance trading tool that reimagines the classic Vortex indicator as an ultra-responsive precision oscillator. Designed for traders who demand absolute clarity, it fuses price action with Tick Volume to reveal the true momentum behind every market move. Why VORTEX OSCILLATOR is a Game Changer Most indicators only track price, often reacting too late. VORTEX OSCILLATOR uses a sophisticated Volume-Weighted Flow algorit
Price manipulation risk
Vincent Albert Feugier
Price Manipulation Risk Indicator Advanced Tool for Market Risk Evaluation & Manipulation Detection Price Manipulation Risk Indicator is a professional tool designed to measure the current risk level in the market. It evaluates price behavior, market activity, and candle dynamics to detect unstable or potentially manipulated environments. This indicator helps traders avoid traps , filter false signals , and improve timing in both entries and exits. Product Purpose Provide an immediate a
True strength index mt5
Vincent Albert Feugier
5 (1)
TrueStrength Oscillator v1.00 What you see on the chart: Thick blue line   : main TSI, follows market momentum Thick red line   ️: signal line (perfect for spotting crossovers) Thin blue bars   : from zero line up to the blue line Dotted gray line in the middle   : zero level, easy to spot direction changes Why it's practical every day: Scale   always fixed   (-0.000001 to +0.000001), no surprises Zero repaint : calculated only on closed bars Works on   all timeframes   (M1 to MN1)
Price Manipulation Risk Indicator Advanced Tool for Market Risk Evaluation & Manipulation Detection Price Manipulation Risk Indicator is a professional tool designed to measure the current risk level in the market. It evaluates price behavior, market activity, and candle dynamics to detect unstable or potentially manipulated environments. This indicator helps traders avoid traps , filter false signals , and improve timing in both entries and exits. Product Purpose Provide an immediate a
Canal icare MT4
Vincent Albert Feugier
CANAL d'ICARE (Icarus Channel) Master the art of flight and prudence. The ICARUS CHANNEL is the ultimate tool for identifying "Discount" buy zones and "Premium" sell zones in the market. Inspired by the desire to reach new heights, this unique indicator dissects price action into strategic levels around its average. It empowers you to trade with professional discipline, clearly showing when the market is too expensive (Premium) or too cheap (Discount). Key Features and Benefits Base SMA (T
Pairs synthetique mt4
Vincent Albert Feugier
Pairs Synthétique Pro (Synthetic Pairs & Spread) Unlock Correlation Trading Power! Tired of tracking a single pair? Dive into the thrilling world of Pair Trading and Statistical Arbitrage with the Synthetic Pairs Pro indicator! This tool is more than just a ratio; it’s your personal radar for detecting price imbalances between TWO distinct assets before the market corrects itself. Picture this: Gold spikes ️, but Silver lags ️. The ratio diverges. Our indicator, framed by Intellige
Vortex oscillator mt4
Vincent Albert Feugier
VORTEX OSCILLATOR: Master the Volume Flow VORTEX OSCILLATOR is a high-performance trading tool that reimagines the classic Vortex indicator as an ultra-responsive precision oscillator. Designed for traders who demand absolute clarity, it fuses price action with Tick Volume to reveal the true momentum behind every market move. Why VORTEX OSCILLATOR is a Game Changer Most indicators only track price, often reacting too late. VORTEX OSCILLATOR uses a sophisticated Volume-Weighted Flow algorit
Fisher Transform MT4
Vincent Albert Feugier
Fisher Transform by HYPOLITE MAKER – Professional Precision Oscillator Experience the definitive version of the Fisher Transform, engineered by HYPOLITE MAKER. The Fisher Transform is renowned for spotting price reversals before they happen. However, the standard version is often too sensitive to market noise. Fisher Transform by HYPOLITE MAKER fixes these issues to provide a stable, highly visual, and profitable trading experience. What makes this version superior to the standard indicator? To
True strength index mt4
Vincent Albert Feugier
TrueStrength Oscillator v1.00 What you see on the chart: Thick blue line   : main TSI, follows market momentum Thick red line   ️: signal line (perfect for spotting crossovers) Thin blue bars   : from zero line up to the blue line Dotted gray line in the middle   : zero level, easy to spot direction changes Why it's practical every day: Scale   always fixed   (-0.000001 to +0.000001), no surprises Zero repaint : calculated only on closed bars Works on   all timeframes   (M1 to MN1)
Klinger Volume Oscillator  Short Description A volume-based flow analysis tool designed to visualize buying and selling pressure through a dual-colored histogram. Detailed Description The Klinger Volume Oscillator Histo is a technical analysis indicator that explores the relationship between price movement and transactional volume. By converting the traditional Klinger Oscillator into a dynamic histogram, this tool allows traders to observe the internal strength of market movements. The indicato
Kst pro tools
Vincent Albert Feugier
KST Pro Tools – Smart Momentum Indicator Overview KST Pro Tools is an advanced momentum indicator based on Martin Pring’s classic Know Sure Thing (KST) . It has been redesigned to deliver a clean, instant, and unambiguous momentum reading , thanks to a smart and fully filtered histogram logic. This indicator shows only meaningful momentum , exactly when it matters. Indicator Components KST Line (blue) Measures the true strength of market momentum Built using 4 weighted and smoothed Rate
Canal icare
Vincent Albert Feugier
CANAL d'ICARE (Icarus Channel) Master the art of flight and prudence. The ICARUS CHANNEL is the ultimate tool for identifying "Discount" buy zones and "Premium" sell zones in the market. Inspired by the desire to reach new heights, this unique indicator dissects price action into strategic levels around its average. It empowers you to trade with professional discipline, clearly showing when the market is too expensive (Premium) or too cheap (Discount). Key Features and Benefits Base SMA (T
Four rsi mt5
Vincent Albert Feugier
Multi-RSI – 4 RSIs in 1 for Complete Market Analysis Analyze market strength and momentum like a pro! Multi-RSI combines 4 distinct RSIs in a single window , giving you a clear and fast view of market momentum across multiple timeframes. Each RSI has its own configurable period , allowing you to adapt the indicator to your trading strategies and style. Key Features: 4 RSIs in one indicator – track multiple periods simultaneously. ️ Fully customizable periods – adjust each RSI individ
Pairs synthetique mt5
Vincent Albert Feugier
Pairs Synthétique Pro (Synthetic Pairs & Spread) Unlock Correlation Trading Power! Tired of tracking a single pair? Dive into the thrilling world of Pair Trading and Statistical Arbitrage with the Synthetic Pairs Pro indicator! This tool is more than just a ratio; it’s your personal radar for detecting price imbalances between TWO distinct assets before the market corrects itself. Picture this: Gold spikes ️, but Silver lags ️. The ratio diverges. Our indicator, framed by Intellige
Fisher Transform MT5
Vincent Albert Feugier
Fisher Transform by HYPOLITE MAKER – Professional Precision Oscillator Experience the definitive version of the Fisher Transform, engineered by HYPOLITE MAKER. The Fisher Transform is renowned for spotting price reversals before they happen. However, the standard version is often too sensitive to market noise. Fisher Transform by HYPOLITE MAKER fixes these issues to provide a stable, highly visual, and profitable trading experience. What makes this version superior to the standard indicator? To
Xauxag panel gestion mt5
Vincent Albert Feugier
XAU/XAG Panel Gestion Introduction Gold (XAU) vs. Silver (XAG) arbitrage is a cornerstone strategy for hedge funds and institutional traders. This professional-grade panel for MetaTrader 5 provides an all-in-one control station to exploit correlation gaps and relative strength between these two precious metals. Designed for surgical precision, it automates complex ratio calculations and risk management to ensure flawless execution. 1. Dual-Leg Trading System (Arbitrage) Unlike standard directio
Forex flux liquidity
Vincent Albert Feugier
The Ultimate Raw Strength & Currency Flow Analyzer for MetaTrader 5. FOREX FLUX LIQUIDITY is a high-precision dashboard designed to instantly identify where the "smart money" is moving. By scanning up to 28 currency pairs simultaneously, this tool filters out market noise to reveal the true intrinsic strength and current liquidity of every major currency. 1. Reading and Interpretation The interface utilizes a dual-visual system for lightning-fast decision-making: The Power Gauge: Measures the cu
Canal of shizukesa
Vincent Albert Feugier
SHIZUKESA Channel – Precision Volatility via Kijun Dynamics The SHIZUKESA Channel (Japanese for "Serenity") is a high-performance technical analysis tool built for traders who demand structural clarity. Unlike standard envelopes or Bollinger Bands that fluctuate with noise, this channel is mathematically rigid : it creates a 100% synchronized clone of the Kijun-Sen to identify objective price deviations. Core Features & Functionality Perfect Clone Structure : The bands do not rely on variable st
Trend series indicator
Vincent Albert Feugier
The Trend Series Indicator is a momentum-based tool designed to isolate and quantify the persistence of price cycles. While traditional oscillators like RSI or Stochastics often "flatten" during strong trends, the TSI measures the actual duration of the current market impulse. How It Works The indicator tracks the sequence of consecutive directional closes: Green Bars (Positive): Counts the streak of bullish candles. Each new higher close increments the bar (+1, +2, +3...). Red Bars (Negative):
STC Pro-Volume Dynamics: Advanced Momentum & Market Pressure Indicator STC Pro-Volume Dynamics is a high-performance trend cycle indicator developed for MetaTrader 5. Engineered for systematic and discretionary traders who demand precision, it merges the proven Schaff Trend Cycle (STC) algorithm with an integrated visual analysis of execution volumes. The objective of this tool is not to provide "magic" predictions, but to deliver a clear, stable, and statistically actionable reading of price dy
Trading isn't just about whether the price is going up or down; it's about how it is moving. The DPO is a structural indicator that neutralizes the underlying trend to isolate the market's pure cyclic component. What is the DPO, really? Mathematically, the DPO measures the distance between the current price and its moving average. It doesn't follow direction: It measures speed and acceleration. The "Detrending" concept: By subtracting the trend (the average), the indicator "flattens" the price.
Candle liquidity volume
Vincent Albert Feugier
Volume Color Candles v1.02   is an MT5 indicator that colors candlesticks based on their direction and relative volume. Bullish candles transition from light green to dark green, bearish candles from light red to dark red, featuring 8 gradient levels per direction (16 individually adjustable colors total). Parameters : 21 inputs including 16 customizable colors, volume average period (20), "high volume only" option, and threshold multiplier (1.2x). The algorithm compares current tick_volume to i
Why MarketSentiment Pro? Standard indicators only look at a single timeframe, leaving you blind to the bigger picture. Our proprietary algorithm analyzes 4 simultaneous time cycles across 4 different assets on a single screen. This gives you a unique "Eagle Eye" view of the market. Relative Strength Algorithm: Pure mathematical calculation based on the price position within its recent range ( $Position = \frac{Price - Low}{High - Low}$ ). 80% Reliability Target: By waiting for all 4 gauges to
Trail of SMOKE
Vincent Albert Feugier
Trail of SMOKE v1.0 The Kinetic Footprint of Price. Trail of SMOKE is an advanced momentum indicator that transforms raw volatility into a fluid visual structure. While traditional indicators merely follow price with a lag, Trail of SMOKE projects market energy to identify zones of real acceleration and institutional exhaustion. The Science Behind the "SMOKE" The name isn't just for aesthetics. The indicator functions like an aerodynamic slipstream: Force Projection: It calculates the gap betwee
Lyapunov exponent
Vincent Albert Feugier
Lyapunov Exponent Indicator for MT5 Measures the rate at which nearby market trajectories diverge over time — a concept from chaos theory applied to price series. What it measures The speed at which two initially close market states diverge. Fast divergence indicates a chaotic/trending regime. Convergence indicates a stable/consolidating regime. Reading the indicator Value near 1 → market in chaotic / trending regime Value near 0 → market in stable / ranging regime White line : Lyapunov exponent
Asymmetry lnp
Vincent Albert Feugier
ASYMMETRY OF LOSSES & PROFITS — MT5 Indicator The concept Most traders know their loss in %. Few know how much they need to gain to get back to breakeven. This is the mathematical asymmetry of markets: losing 50% doesn't require +50% to recover — it requires +100% . The bigger the loss, the more disproportionate the recovery effort. Loss Required gain to recover -10% +11.1% -25% +33.3% -50% +100% -75% +300% -90% +900% This indicator makes that number visible, continuously, directly on your MT5 c
NOTIFY PANEL            Your trading dashboard delivered straight                   to your pocket — in real time OVERVIEW NotifyPanel is a lightweight Expert Advisor featuring 3 buttons that instantly sends your trading data as push notifications to your smartphone via the MetaTrader 5
Kurtosis indicator
Vincent Albert Feugier
What is Kurtosis? Kurtosis is a statistical indicator that measures the flatness of the price distribution over a given period. More precisely, it quantifies the importance of extreme price movements compared to a normal distribution. A normal distribution has a kurtosis of 3 — this is the red reference line on the indicator. Formula Kurtosis = m₄ / (m₂)² Where m₂ is the variance of prices and m₄ is the 4th central moment. The more extreme price shocks occurred over the period, the larger the nu
Filtro:
Nessuna recensione
Rispondi alla recensione